Impact Factor ISSN: 1449-2288
- Issue 12; 2026
- Issue 11; 2026
- Issue 10; 2026
- Issue 9; 2026
- Issue 8; 2026
- Volume 22; 2026
- Past Issues
- Advance Articles
- Editorial Board
- Cover Images
- Index & Coverage
- Cover Suggestion
- Special Issues
Introduction
Materials and Methods
Results
Discussion
Abbreviations
Supplementary Material
Acknowledgements
References

 Global reach, higher impact
Int J Biol Sci 2022; 18(13):4932-4949. doi:10.7150/ijbs.76425 This issue Cite
Research Paper
CPNE8 Promotes Gastric Cancer Metastasis by Modulating Focal Adhesion Pathway and Tumor Microenvironment
Peiling Zhang1#, Xiaofei Cao1#, Mingmei Guan1#, Dailing Li1, Hong Xiang1, Qian Peng1, Yun Zhou1, Chengyin Weng1, Xisheng Fang1, Xia Liu1, Haibo Mao1, Qiao Li2 ![]() , Guolong Liu1
, Guolong Liu1 ![]() , Lin Lu1
, Lin Lu1 ![]()
1. Department of Medical Oncology, the Second Affiliated Hospital, School of Medicine, South China University of Technology, Guangzhou, Guangdong, China
2. Department of Surgery University of Michigan, Ann Arbor, Michigan, USA
# Peiling Zhang, Xiaofei Cao and Mingmei Guan contributed equally to this work
Received 2022-6-22; Accepted 2022-7-13; Published 2022-7-25
Abstract

Little is known about the oncogenic role or biological function of copine Ⅷ (CPNE8) in gastric cancer (GC). Based on TCGA database, we screened for CPNE8 and analyzed the expression of CPNE8 in GC. The correlations between CPNE8 and clinical features were analyzed using TCGA and GEO databases. The prognostic value of CPNE8 was assessed using Cox analysis and Kaplan-Meier curves. The results showed that increased expression of CPNE8 was positively correlated with metastasis and can be considered an independent prognostic risk factor for poor survival. We found that CPNE8 can promote cell proliferation, migration, and invasiveness in GC using in vitro and in vivo experiments. Our study demonstrated that CPNE8 promotes tumor progression via regulation of focal adhesion, and these effects can be rescued by focal adhesion kinase (FAK) inhibitor GSK2256098 or knockdown of FAK. In addition, CPNE8 was correlated significantly with the infiltration of cancer-associated fibroblasts and immune cells, as demonstrated by various algorithms, and high CPNE8 expression predicted poor efficacy of immune checkpoint therapy. Our findings suggest that CPNE8 modulates focal adhesion and tumor microenvironment to promote GC progression and invasiveness and could serve as a novel prognostic biomarker in GC.
Keywords: CPNE8, Gastric cancer, Metastasis, Focal adhesion, Tumor microenvironment.
Introduction
Gastric cancer (GC) ranks fifth in incidence and fourth in mortality worldwide [1]. East Asia is among the regions with a high incidence of GC, and the incidence of GC is highest of all in China [2]. Despite the advanced development of tumor-targeted therapy and immunotherapy, the prognosis of GC patients remains poor, with a 5-year overall survival rate of only approximately 30% [3-5]. GC is highly susceptible to distant metastasis, leading to failure of traditional treatment strategies such as chemotherapy and radiotherapy [6]. In fact, approximately 50-65% of GC patients are diagnosed at an advanced stage with extensive invasive or distant metastases, and these patients gain limited therapeutic benefit from treatment [7-9]. Therefore, it is important to understand the mechanisms involved in GC progression and metastasis to contribute to the development of improved targeted therapies.
The copine family encodes calcium-dependent phospholipid-binding proteins that may play a role in membrane trafficking and in mediating cellular processes by conferring calcium regulation to various signaling pathways [10, 11]. Increasing evidence has indicated that copine family members are involved in cancer development and progression. Tang summarized the biological properties of the copine family and their oncogenic roles in several cancers, including breast, colorectal, and non-small cell lung cancers [12]. The copine family of proteins perform different signal transduction functions, such as membrane transport, lipid messenger production, GTPase activation, protein phosphorylation, etc. [13-15]. Studies on the role of CPNEs in cancer are limited, and further research is needed. CPNE8 (copine Ⅷ), one of the copine family genes, was initially identified as a gene pre-expressed in the prostate and testis. Robust CPNE8 expression was detected in the prostate, heart, and brain, suggesting that CPNE8 might play an essential role in the regulation and development of the prostate [16]. CPNE family genes such as CPNE1 and CPNE3, were closely related to tumorigenesis and progression [12, 17, 18]. However, there is limited knowledge regarding the roles and mechanisms of CPNE8 in carcinogenesis. CPNE8 could fuse with AMLI genes to form AML-CPNE8 chimeras in acute myeloid leukemia (AML) patients, thus negatively regulating the proliferation of AML cancer cells [19]. A recent study suggested that RP11-396F22.1, acting as an early diagnostic indicator of cervical cancer, could enhance the progression of cervical cancer by negatively regulating CPNE8 [20]. Accumulating evidence suggests that CPNE8 functions in cancer cell migration and invasion. Dang et al. [21] found that CPNE8 promoted basal-like breast-cancer tumor invasion. Another study showed that CPNE8 promoted the migration and invasion of pancreatic cancer cells [22].
In this study, we used public databases to investigate the effect of CPNE8 on GC progression, focusing on GC metastasis. We found that CPNE8 was indeed a metastasis-related gene. High expression of CPNE8 in GC patients was closely associated with various clinicopathological features and predicts poor prognostic outcomes. Furthermore, we screened the downstream targets of CPNE8 and explored their regulatory mechanisms. In addition, CPNE8 expression is associated with multiple immune cell infiltrations in the tumor microenvironment, which may lead to GC metastasis. These findings provide a novel approach to the diagnosis and treatment of metastatic GC.
Materials and Methods
Characteristics of patients and ethical statement
A total of 55 patients with GC were included in this study. The patients met the diagnostic criteria for gastric adenocarcinoma, and none had received any anti-tumor treatment. All human tissues were obtained after informed consent was obtained. This study was approved by the Research Ethics Committee of the Second Affiliated Hospital of the South China University of Technology, and informed consent was obtained from all patients.
Data collection and analysis
The mRNA data and clinical data of stomach adenocarcinoma (STAD) patients were downloaded from TCGA database and processed for differentially expressed genes and GSEA (gene-set enrichment analysis) using R scripts. Since various versions of TNM staging were applied to gastric cancer patients in the TCGA-STAD cohort, including the 5th, 6th, and 7th editions. We re-analyzed the clinical data according to the 7th edition of the AJCC TNM staging system and performed it for subsequent analyses. And the modified clinical data was shown in Table S1. We used the GSE118916 dataset to analyze the expression of CPNE8 in GC. Genes associated with CPNE8 expression were screened for KEGG the Kyoto Encyclopedia of Genes and Genomes (KEGG) and Gene Ontology (GO) for functional enrichment analysis. Statistical significance was set at p <0.05.
Cell culture and transfection
The gastric mucosal epithelial cell line (GES-1) and GC cell lines AGS, BGC823, and MKN45 were obtained from the Global Bioresource Center (ATCC, USA). All cells were cultured in a DMEM medium (Gibco, USA) containing 10% fetal bovine serum (FBS) and 1% penicillin/streptomycin in a humidified atmosphere at 37 °C and 5% CO2. The shRNA sequence for CPNE8 (GAGCATGGCTAGATTGGCTAA, sh-CPNE8) was designed and synthesized by IGE Biotechnology (Guangzhou, China). An overexpression plasmid carrying the human CPNE8 sequence (oe-CPNE8) was acquired from Tsingke Biotechnology (Guangzhou, China). Lentiviruses containing scrambled sequences (sh-negative) and an empty vector (oe-vector) were used as controls according to the manufacturer's instructions. GC cells were transfected with lentiviral vectors and then selected with puromycin (a resistance marker) for one week to establish stable cell lines. Transfection efficiency was analyzed by quantitative real-time PCR (qRT-PCR) and Western blotting according to the manufacturer's instructions. We used siRNA targeting PTK2 (encoding FAK) to eliminate FAK expression for further rescue experiments. The target sequence of PTK2 (CCGGTCGAATGATAAGGTGTA, si-FAK) was synthesized by Tsingke Biotechnology (Guangzhou, China), and knockdown efficiency was determined by Western blotting.
Western blot
Whole-cell lysates were prepared by sonication in ice-cold lysis buffer (Beyotime Biotech, Shanghai, China) containing protease inhibitors at 1:100 dilution. Subsequently, total proteins were separated by electrophoresis on 10% SDS-PAGE gels. After electrophoresis, the separated protein bands were transferred to polyvinylidene fluoride (PVDF) membranes (Millipore, Cat. #IPVH00010) and blocked with 5% skim milk for 1 h at room temperature. The membranes were then treated with primary antibodies against CPNE8 (Cat. #AF9047), FAK (cat. #R24277) and pY397-FAK (Cat. #381143), total ERK1 /2 (Proteintech, Cat. #67170-1-Ig), phosphorylated ERK1 /2 (Cell Signaling Technology, Cat. # 9101), and GAPDH (Cat. # 5174) at a dilution ratio of 1:1000, overnight at 4 °C. The membranes were then washed in TBST for 30 min and incubated with a 1:10 000 HRP-conjugated secondary antibody (Promega, Cat. #W4021; Cat. #W4011) for 1 h at room temperature. The membranes were washed with TBST for 30 min and visualized using ECL kits (Thermo Fisher, Cat. # 34096).
Quantitative Real-Time PCR
Total RNA was isolated from the cells using TRIzol reagent (Thermo Fisher, Cat. #15596026). Reverse transcription kit (Vazyme, Cat. #R211-01) and ChamQ Universal SYBR qPCR Master Mix (Cat. #Q711) were used for quantitative PCR of the target genes according to the manufacturer's instructions. RT-qPCR primer sequences are listed in Table S2. GAPDH gene expression was used as the endogenous control. The relative expression of the target genes relative to the control was calculated according to the 2-ΔΔCT formula. Each experiment was performed in triplicate.
Cell viability assay
Cells were seeded in 96-well plates at a density of 2×10³ cells/well and allowed to grow for 5 days. Each day, 10 μl of CCK-8 (Cat. # GK10001-1) was added to 100 μl of medium and incubated at 37 °C for 2 h. Absorbance was measured at 450 nm using a multifunctional microplate instrument (Biotek Cytation5, USA). All experiments were performed in triplicate.
Colony formation
Cells were plated in 6-well plates at a density of 500 AGS cells/well and 250 BGC823 cells/well and allowed to grow for 10 days to form visible colonies. The colonies were fixed with 4% paraformaldehyde for 15 min and stained with 0.1% crystal violet for 20 min at room temperature. The colonies were then imaged, and the number of colonies counted.
EDU staining
An EDU staining kit (Beyotime Biotech, Cat. # C0071S) was used for this assay. Stably transfected cells were inoculated at a density of 5×10⁴ cells/well in a 24-well plate and allowed to adhere overnight for EDU staining. The cells were then washed with PBS and incubated in serum-free DMEM containing 10 μM EdU for 2 h. After fixing with 4% paraformaldehyde, the cells were stained to detect proliferating capabilities, according to the manufacturer's instructions. The cells were imaged by fluorescence microscopy, and the percentage of proliferating cells was determined.
Flow cytometry
For cell cycle assays, 1×10⁶ cells were washed twice with ice-cold PBS, resuspended in ice-cold 70% ethanol, and fixed overnight at -20 °C. Fixed cells were then centrifuged, resuspended with 0.5 mL/test (1×10⁶ cells) PI/RNase Staining Buffer (BD, Cat. #550825), and incubated for 15 min at room temperature before analysis. PE-Annexin V Apoptosis Detection Kit I ( Cat. # 559763) was used to detect apoptotic cells, according to the manufacturer's instructions. Flow cytometry was performed using a FACScan instrument (Becton Dickinson, USA), and analysis was performed using FlowJo software.
Mass spectrometry
Sufficient tumor cells were collected, lysed, and desalted for mass spectrometry analysis. Based on the mass-to-nucleus ratio of different substances, we detected the difference in mass-to-nucleus ratio at the cellular protein level to identify and quantify the differentially expressed proteins. The label-free proteome was detected using a mass spectrometer (Thermo Fisher Obitrap Plus). Data analysis was performed using the Proteomic Discovery software (ThermoFisher) to obtain data containing Master Protein/Gene, Relative Abundance, GO/KEGG pathway, PSM, and other information for further analysis using bioinformatics methods.
Wound healing assay
After being imaged at 0 h, cells were cultured in a 37 °C, 5% CO2 incubator for 24 h and captured under a microscope. Cells were seeded in 24-well plates and cultured to 90% confluence. After 24 h of starvation, the cells were gently scored between monolayers of cultured cells using a sterile 20 μl tip and washed twice with PBS. The widths of the original cells and scratches after cell migration were quantified using ImageJ software.
Migration and invasion assays
Migration and invasion experiments were performed using 24-well Transwell chambers (Cat. #3422) with 8µm wells. For cell migration experiments, 0.5 × 10⁵ cells were resuspended in 200 μl serum-free medium and placed into the upper chambers. Then, 600 µl DMEM containing 10% FBS was added to the lower chambers to incubate the cells for 24 h. For cell invasion experiments, Matrigel (BD, Cat. # 356234) at a dilution of 1:8 was pre-coated on the upper chamber surface, and then 2×10⁵ cells resuspended in 200 μl serum-free medium were added to the upper chambers. DMEM (600 μl) containing 10% FBS was added to the lower chambers and incubated for 24-48 h. The cells were then removed from the surface of the upper membrane using a cotton swab and washed three times in PBS to ensure that no cells remained on the surface. The cells were fixed with methanol at room temperature for 15 min and stained with 0.1% crystal violet for 20 min. After washing with PBS, cells were examined and counted under a microscope.
Cell adhesion assay
The 24-well plates were precoated with 10 μg/ml fibronectin (Cat. # F8180-1ml) overnight at 4 °C, and 2×10⁵ cells per well were incubated in a 37 °C, 5% CO2 incubator for 2 h. The plates were gently washed with PBS to remove the non-adherent cells. Adherent cells were fixed with 4% formaldehyde and stained with 0.1% crystal violet. Cells were imaged and counted under a microscope.
Select the optimal concentration of FAK inhibitor
GC cells were cultured in a 6-well plate and allowed to reach 70% confluence in regular culture medium. The medium was then replaced with fresh medium containing 0-10 μM GSK2256098 (TargetMol, Cat. #T2281), a small-molecule FAK inhibitor. The cells were incubated for 2 h. At the end of the treatment, the cells were extracted to detect FAK expression levels using western blotting. The concentration with the most significant reduction in FAK protein expression was selected as the optimal concentration for subsequent experiments.
Animal experiments
All animal experiments were performed according to the protocol approved by the Animal Care and Use Committee of South China University of Technology. Five to 6-week-old male BALB/c nude mice were purchased from Guangdong Scarjindar Biotechnology Co. For the tumor growth model, 2×10⁶ BGC823-oe-CPNE8 cells and control cells in 200 μl PBS were injected subcutaneously into the left lower dorsum of the nude mice. Tumor volume was measured every 3 days and calculated according to the following formula: tumor volume (mm3) = length × width2 × 0.5. BGC823-oe-CPNE8 cells or control cells (1×10⁶/100 μl PBS) were injected into the tail vein of male BALB/c nude mice to induce tumor lung metastasis. After 4 weeks, the mice were sacrificed and all tumors and lungs were surgically removed for imaging and embedding. HE staining was performed to visualize metastatic lesions.
Immunofluorescence staining
Mouse xenograft tumors were fixed in 4% paraformaldehyde for 24 h, embedded in paraffin, and cut into 5 µm sections. Tissue sections were placed in an oven at 60 °C for 2 h, then routinely dewaxed and heated with sodium citrate buffer (0.01 M, pH 6.0) for antigen repair. After blocking the antigen with goat serum for 30 min, the tissues were incubated with the antibody Ki67 (Zen BioScience, Cat. #381101-50 μl) overnight at 4 °C. The tissues were stained with secondary antibodies (Cat. # E032620). Parallel staining with secondary antibodies was used as the control for signal specificity. DAPI (Beyotime Biotechnology, Cat. # C1005) was used to stain the nuclei.
Immunohistochemistry staining
Tissue sections of the xenograft tumors were treated as described above. After antigen repair, endogenous peroxidase was inhibited with 3% hydrogen peroxide for 10 min, blocked with goat serum for 30 min, and incubated with the primary antibody CPNE8 (Proteintech, Cat. #20097-1-AP), FAK (Cat. #R24277) and anti-α-SMA antibodies (Cat. #GB111364), respectively, at a dilution of 1:100, at 4 °C overnight. After washing with PBS, the DAB kit (Cat. #AR1027) was used for immunostaining, and hematoxylin was used for re-staining. The results were analyzed using a microscope. The immunohistochemical score was calculated as the product of the staining intensity (0-3 points) and staining area (0-3 points) by two researchers, ZPL and CXF [23]. The staining intensity was scored as follows: 0 for no staining, 1 point for light yellow, 2 points for yellow, and 3 points for brown. The stained area was scored as follows: ≤5% scored 0, 5-25% scored 1, 25-50% scored 2, and ≥50% scored 3. Immunohistochemistry scores of <3 indicated a low expression group, and a score ≥3 indicated a high expression group.
Immuno-functional analysis
To explore the association of CPNE8 expression with the tumor microenvironment, we evaluated the immune score, estimated score (that implies tumor purity), and stromal score of GC patients using the R package “estimate” [24]. We visualized the correlation between CPNE8 expression and cancer-associated fibroblasts (CAFs) using TIMER2 [25]. We also analyzed the relationship between CPNE8 and CAFs in the GSE84437 database using the R package “estimate.” Using the TISIDB database, we determined the correlation between CPNE8 and various chemokines and chemokine receptors [26]. IHC and qRT-PCR analyses were performed to verify the relationship between CPNE8 and CAFs further. We applied the “MCP-counter” algorithm to quantify marker-based gene sets for immune infiltration [27]. We used the R package “GSVA” for single-sample gene set enrichment analysis (ssGSEA), which calculates the absolute enrichment of gene sets in each sample to assess the connection between CPNE8 and immune-related pathways. We downloaded mutation data from the TCGA-STAD cohort, calculated TMB and MSI scores, and used Spearman's correlation analysis to characterize their correlation with CPNE8 expression. Peng et al. designed a new computational framework that integrates two previously studied tumor immune escape mechanisms and tumor immune dysfunction and exclusion (TIDE) scores [28, 29]. We used the TIDE database to calculate the correlation between CPNE8 and dysfunction and TIDE scores. In addition, we calculated and compared the correlation of CPNE8 expression with immune checkpoint responses using the chi-squared test.
Statistical analysis
All statistical analyses were conducted using R software (version 4.0) and GraphPad Prism package (version 8.3). The median of CPNE8 expression was chosen as the cut-off for the high- and low-expression groups. Student's t-test or Wilcoxon test was used for comparisons between the two groups. Analysis of variance was used to compare multiple groups. Spearman analysis was used to assess linear relationships. The chi-squared test was used to analyze the correlation between CPNE8 expression and clinicopathological features or immune responses. For survival analysis, we selected GC patients with detailed survival status and survival time, including all stages of the disease. We used univariate and multivariate analyses to establish Cox regression models and plotted survival curves using the Kaplan-Meier method, including overall survival (OS), progression-free survival (PFS), and disease-free survival (DFS). We also performed ROC analysis using the R package “pROC” to evaluate the performance of multiple genes in the prediction of tumor carcinogenesis and metastasis, as well as survival analysis [30]. All experiments were repeated at least three times, and the data are expressed as mean ± standard deviation (SD). Statistical significance was defined as two-tailed p <0.05.
Results
CPNE8 expression is increased in GC and associated with poor survival outcomes
To identify candidate genes involved in GC progression and metastasis, we re-analyzed the TCGA stomach adenocarcinoma RNA-seq dataset and screened 16 genes that were highly expressed in GC and associated with metastasis, including CPNE8 (Figure 1A). Most of these genes were reported to be associated with tumor metastasis, such as TDO2, CYTL1, and LDB2. [31-33]. However, the role of CPNE8 in GC oncogenesis and metastasis remains poorly understood. Therefore, we analyzed CPNE8 mRNA levels using publicly available datasets, such as TCGA-STAD and GSE118916 cohorts. In TCGA-STAD data, CPNE8 was upregulated in GC tissues, compared to normal tissues (Figure 1B, p <0.001). CPNE8 expression was higher in tumor tissues in the GSE118916 dataset (Figure 1C, p <0.001). Moreover, CPNE8 expression was upregulated in metastatic GC, compared with that in primary tumors (Figure 1D, p <0.05), especially in patients with liver metastases (Supplementary Figure S1A, p <0.001). These results indicated that CPNE8 was highly expressed in GC, and metastatic tumors showed higher CPNE8 expression. To estimate the predictive value of CPNE8 expression in gastric carcinogenesis and metastasis, we performed ROC analysis on the TCGA-STAD cohort and GSE118916 datasets. CEACAM5, encoding CEA, is usually used as a clinical biomarker for gastrointestinal cancers and may promote tumor development through its role in cell adhesion [34]. The results showed that CPNE8 was no better a predictor of the carcinogenesis of GC than CEACAM5 (Supplementary Figure S1B, CPNE8: AUC=0.5847, p = 0.1117; CEACAM5: AUC=0.6351, p = 0.0112) in the TCGA-STAD cohort. However, CPNE8 exhibited excellent performance in the diagnosis of GC compared to CEACAM5 in the GSE118916 dataset (Supplementary Figure S1C, CPNE8: AUC=0.9422, p <0.0001; CEACAM5: AUC=0.5911, p = 0.3952). Additionally, CPNE8 exhibited good prediction of metastatic GC (Figure 1E, AUC=0.6439, p =0.0242), supporting the clinical significance of CPNE8 as an indicator of metastatic GC. Furthermore, the correlations between CPNE8 expression and GC clinical features were analyzed (Table 1). The data indicated that the expression of CPNE8 was significantly related to tumor grade (p =0.0212). As shown in Figure 1F, GC patients with advanced-stage exhibited higher CPNE8 expression than those in the early stage. Likewise, high CPNE8 expression was associated with an advanced GC grade (Figure 1G, p <0.05). However, there were no significant relationships between CPNE8 expression and other clinical features such as sex, tumor invasion depth, and lymph node metastasis (Supplementary Figure S1D-F). These data suggested that high CPNE8 expression predicts a more malignant phenotype. We further explored the predictive value of CPNE8 in prognosis and survival of different types of patients. Univariate Cox analysis showed that CPNE8 expression was a predictor of overall survival in GC patients (p <0.001) and remained an independent factor in multivariate Cox analysis (p =0.009) (Supplementary Figure S2A-B). Kaplan-Meier analysis indicated that higher CPNE8 expression was significantly associated with worse overall survival (OS), progression-free survival (PFS), and disease-free survival (DFS) (p <0.01, Figure 1H-J). ROC curves showed a favorable predictive capacity of CPNE8 expression for OS, PFS, and DFS in the TCGA-STAD cohort (AUC >0.5) (Supplementary Figure S2C-E). Immunohistochemistry was used to detect the expression of CPNE8 in paraffin-embedded GC and normal tissues. Figure 1K shows representative microscopic images of adjacent normal tissue and GC. IHC scores showed that CPNE8 was upregulated in most GC tissues compared to that in normal tissues (p =0.0198, Figure 1L). There was no significant correlation between CPNE8 expression and TMN stage in our patient samples (data not shown). Survival analysis based on CPNE8 expression showed that CPNE8 was significantly associated with poorer overall survival in our patient samples (p =0.0440, Figure 1M). Taken together, these data indicate that the CPNE8 gene was closely related to GC metastasis and is a novel prognostic biomarker that can independently predict a poor outcome in GC patients.
CPNE8 was overexpressed in gastric cancer and associated with poor patient survival. (A) Venn diagram showing genes with high expression and association with tumor metastasis in the TCGA-STAD cohort. (B) Comparison of CPNE8 gene expression between 375 tumor tissues and 32 normal tissues. (C) Normalized GEO data demonstrating differential expression of CPNE8 gene between 15 tumor tissues and paired normal tissues. (D) Increasing CPNE8 expression in metastatic gastric cancer compared to primary tumors. (E) The area under the ROC curve (AUC) indicated that CPNE8 revealed better efficiency in predicting metastatic gastric cancer. (F) Significantly different expression of CPNE8 among tumor stages in the TCGA-STAD cohort. (G) Significantly different expression of CPNE8 among tumor grades in the TCGA-STAD cohort. (H) Overall survival (OS) curves based on CPNE8 status. (I) Progression-free survival (PFS) curves based on CPNE8 status. (J) Disease-free survival (DFS) curves based on CPNE8 expression. (K) The representative microscopy images of CPNE8 in normal tissue and gastric cancer tissue were shown at 100X and 200X magnifications. (L) The IHC scores displayed that CPNE8 was upregulated in most GC than normal tissue. (M) The overall survival curve was based on CPNE8 scores obtained by immunohistochemistry.
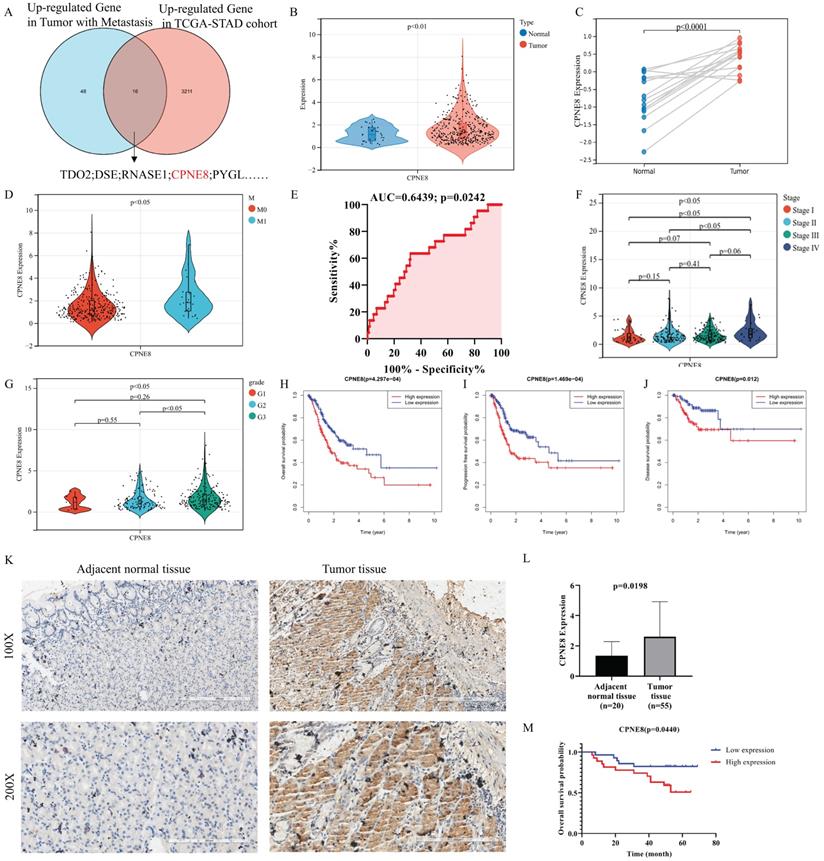
Relationship between CPNE8 expression and clinicopathologic Characteristics of TCGA-STAD patients (n=322)
| Characteristics | CPNE8 expression | χ2 | P-value | |
|---|---|---|---|---|
| Low (n=161) | High (n=161) | |||
| Gender | ||||
| Female | 61 | 60 | 0.01324 | 0.9084 |
| Male | 100 | 101 | ||
| Grade | ||||
| G1 + G2 | 70 | 50 | 5.314 | 0.0212* |
| G3 | 91 | 111 | ||
| Invasion depth | ||||
| T1 + T2 | 41 | 33 | 1.123 | 0.2893 |
| T3 + T4 | 120 | 128 | ||
| Lymph metastasis | ||||
| N0 + N1 | 93 | 76 | 3.599 | 0.0578 |
| N2 + N3 | 68 | 85 | ||
| Distant metastasis | ||||
| M0 | 154 | 146 | 3.122 | 0.0772 |
| M1 | 7 | 15 | ||
| TNM stage | ||||
| Stage I + II | 86 | 69 | 3.595 | 0.058 |
| Stage III + IV | 75 | 92 | ||
| *p <0.05 | ||||
CPNE8 enhances the proliferation of GC cells
We performed Western blotting to detect the expression levels of CPNE8 in the three GC cell lines. Our results showed that CPNE8 was highly expressed in AGS cells and barely detected in BGC823 cells (Figure 2A). To gain insight into the effects of CPNE8 on the cellular behavior of GC tumorigenesis, we generated the BGC823-oe-CPNE8 cell line, which stably overexpressed full-length CPNE8. We also developed an AGS-sh-CPNE8 cell line that stably expressed CPNE8-shRNA to suppress CPNE8 expression. The expression levels of CPNE8 in stably overexpressing or knocked down cell lines were confirmed by Western blot analysis (Figure 2B) and qRT-PCR (Figure 2C). Relative protein expression (CPNE8 protein/GAPDH) was also quantified and is shown in a column diagram (Figure 2B). To determine the effect of CPNE8 on cell proliferation, we performed a cell proliferation assay using CCK-8. We found that after stable knockdown of CPNE8, the proliferation ability of AGS cells was reduced, while the proliferation ability of BGC823 cells increased with the overexpression of CPNE8 (Figure 2D). Consistently, knockdown of CPNE8 significantly attenuated proliferation, whereas overexpression CPNE8 increased the proliferation of GC cells in colony formation assays (Figure 2E). EDU staining assays also showed significant differences in the proliferative capacities of GC cells with CPNE8 knockdown or overexpression compared to control cells (Figure 2F). Taken together, these results demonstrate that CPNE8 promotes GC cell proliferation.
CPNE8 enhanced the proliferation of GC cells. (A) Western blot plots showing the different expressions of the CPNE8 gene in GC cell lines. Relative protein expression (CPNE8 protein/GAPDH) was quantified in a column graph. (B) CPNE8 knockdown and transfection efficiency in GC cells was analyzed by Western blot and quantified as relative protein expression of CPNE8/GAPDH. (C) The knockdown and transfection efficiency of CPNE8 in GC cells was confirmed by qRT-PCR. The expression of mRNAs was calculated using the 2-ΔΔCt method. (D) CCK-8 assay showed significant differences in GC cell proliferation with knockdown or overexpression of CPNE8, respectively. (E) A colony formation assay assessed the effect of CPNE8 on GC cell proliferation. Colonies were stained with crystal violet, and the number of colonies was counted and shown in a column diagram. Error bars represent mean ± SD from three independent experiments. (F) EDU staining of proliferating cells. GC cells were analyzed using a fluorescence microscope (Olympus-Microsystems). DNA (blue) was stained with Hoechst. Cyan cells show EDU/Hoechst-positive cells. The column diagram represented the proliferation rates in various GC cells. Data are presented as mean ± SD for at least three independent experiments. (G) Cell cycle analysis in GC cells with respective knockdown or overexpression of CPNE8. The bar charts represented the proportion of cells in various cell cycle phases in GC cells. Data are presented as mean ± SD for at least three independent experiments. (H) Analysis of apoptosis in GC cells with knockdown or overexpression of CPNE8. The proportion of apoptotic cells in GC cells was also shown as column graphs. Data are presented as mean ± SD for at least three independent experiments.
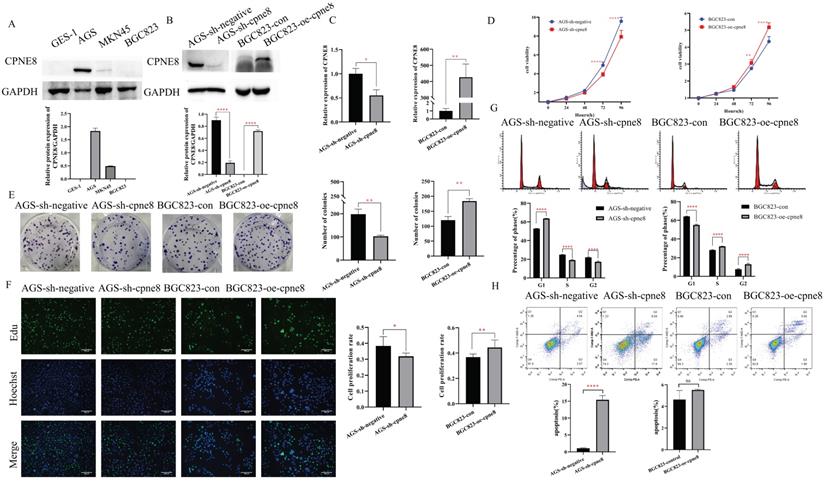
To explore the mechanism of the carcinogenesis-promoting effect of CPNE8 on GC cells, we performed cell cycle and apoptosis analyses. Flow cytometry analysis showed an increase in the percentage of G1 cells and a decrease in the rate of S/G2 phases in AGS-sh-CPNE8 cell, while the opposite was observed in BGC823-oe-CPNE8 cell (Figure 2G). These results indicate that CPNE8 promoted cellular G1/S phase transition. Knockdown of CPNE8 increased the percentage of apoptotic cells, although overexpression of CPNE8 did not significantly affect cell apoptosis (Figure 2H). These results suggested that CPNE8 is involved in the cell cycle and apoptosis of GC cells.
CPNE8 promotes GC cell migration and invasion in vitro
Considering the significant elevation of CPNE8 in metastatic GCs, we performed experiments to examine the malignant behavior of invasiveness using wound-healing and Transwell assays. Wound-healing assays demonstrated that knockdown of CPNE8 retarded cell migration and motility. By contrast, overexpression of CPNE8 enhanced cell migration and motility (Figure 3A). Quantitative analysis of wound closure area showed statistically significant differences after knockdown or overexpression of CPNE8 compared to controls (Figure 3B). Transwell assays showed that migratory and invasive abilities were significantly suppressed after CPNE8 knockdown, whereas cell migration and invasion capabilities were enhanced using BGC823-oe-CPNE8 compared with controls (Figure 3C). Representative images are shown, and the numbers of migratory and invasive GC cells were quantified in a histogram graph, displaying statistically significant alterations after knockdown or overexpression of CPNE8 (Figure 3D).
CPNE8 promoted GC cell migration and invasion in vitro. (A) Wound-healing assays revealed that stably suppressed CPNE8 expression inhibited migration of GC cells in vitro, whereas elevated CPNE8 expression had the opposite effects. (B) Quantitative analysis of wound closure. (C) Transwell assays showed that knockdown of CPNE8 reduced the migration and invasion of GC cells while overexpression of CPNE8 enhanced the migration and invasion ability of the GC cells. (D) Quantitative analysis of migration and invasion of GC cells. Data are presented as mean values ± SD of three independent experiments.
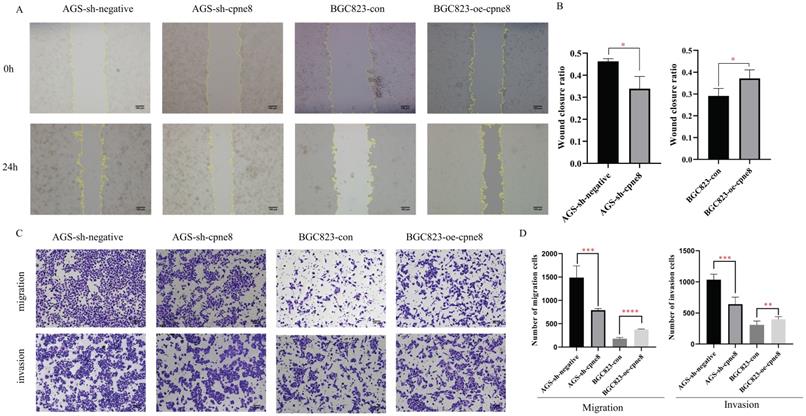
Collectively, these results demonstrate that CPNE8 promotes GC cell migration and invasion in vitro.
CPNE8 activates the Focal adhesion pathway to promote tumor metastasis
We investigated the potential mechanism of action of CPNE8 in GC metastasis. GSEA was performed based on the median expression levels of CPNE8, Gene Set Enrichment Analysis (GSEA) was performed in the TCGA-STAD cohort. A set of signaling pathways, such as focal adhesion, gap junction, and ECM receptor interaction, was functionally enriched in GC patients with high CPNE8 expression (Supplementary Figure S3A). In addition, we screened genes with strong correlations with CPNE8 expression (|R|≥0.4 and p≤0.05) using the Cbioportal website for KEGG functional enrichment analysis in the TCGA-STAD cohort. We found that the focal adhesion pathway, cell adhesion molecule (CAMs) pathway, and tight junctions were abundant (Supplementary Figure S3B). These signaling pathways are closely associated with tumor metastasis [35-37]. We performed mass spectrometry analysis on CPNE8 knockdown cells to screen for differentially expressed proteins for KEGG functional enrichment. Pathway analysis indicated that the genes regulating the focal adhesion pathway were most significantly disrupted after CPNE8 knockdown (enrichment score =2.5, p <0.01, Figure 4A).
CPNE8 acted on the Focal adhesion pathway to promote GC metastasis. (A) KEGG functional enrichment analysis revealed a significant correlation between CPNE8 expression and Focal adhesion pathway in AGS-sh-CPNE8 cells compared to the control cells. (B) There are relative changes of FAK (Gene Symbol as PTK2) and ERK mRNA levels in GC cells with knockdown or overexpression of CPNE8. (C) Western blot analysis of FAK, p-FAK, total Erk1/2, and p-ERK protein expression in GC cells with knockdown or overexpression of CPNE8. Relative protein expression (interested protein/GAPDH) was also quantified in GC cells. (D) EDU staining assay showed the proliferating cells with or without diminishing FAK expression, such as GSK2256098 treatment and knockdown of FAK. Photos were captured using a fluorescence microscope (Leica-Microsystems). DNA (blue) was stained with Hoechst. Cyan cells showed EDU/Hoechst-positive cells. The column diagram represented the proliferation rates in various GC cells. Data are presented as mean ± SD for at least three independent experiments. (E) Wound-healing assays revealed that both GSK2256098 and si-FAK could quantitatively reduce the CPNE8-induced migration in BGC823 cells using Image J software. (F) Transwell assays confirmed that GSK2256098 or knocking down FAK could inhibit migration and invasiveness of GC cells with overexpression of CPNE8. (G) The representative images showed the adhesion ability of GC cells with knockdown or overexpression of CPNE8 compared to the control cells and the attenuation of BGC823-oe-CPNE8 with GSK2256098 or knockdown of FAK. The number of GC cells shown in the bar graph that adhered to the plates coated after 2h of incubation was quantified using Image J software.
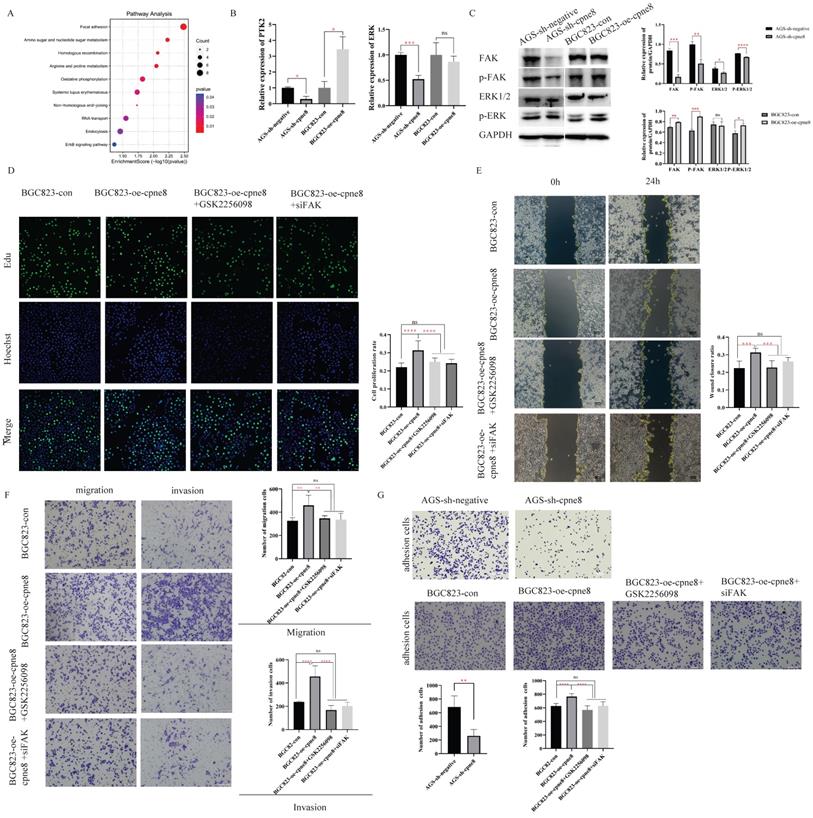
Focal adhesion has been recognized as an essential step in cancer cell migration and invasion, and can activate several signaling pathways through phosphorylation and protein-protein interactions that promote tumorigenesis and metastasis [35, 38]. To explore whether CPNE8-mediated metastasis of GC was regulated through focal adhesion, we examined the expression of FAK and the target gene ERK at the mRNA and protein levels by qRT-PCR and western blotting, respectively. Our results revealed that knockdown of CPNE8 in AGS cells markedly decreased FAK, p-FAK, total Erk1/2, and p-ERK expression at both the mRNA and protein levels. By contrast, BGC823 cells overexpressing CPNE8 exhibited significantly increased FAK and p-FAK at both the mRNA and protein levels, and increased p-ERK mRNA and protein levels, but with no significant change in total Erk1/2 (Figure 4B-C). To determine the effect of the focal adhesion pathway on gastric carcinogenesis and metastasis, we used siRNA and the FAK inhibitor GSK2256098 to treat CPNE8 overexpressed BGC823 cell lines to detect cell proliferation, motility, and invasiveness, respectively. We treated BGC823-oe-CPNE8 cells with different concentrations (0-10 μM) of GSK2256098 and incubated them at 37 °C for 2 h before detecting the expression levels of FAK by Western blotting. We found that treatment with GSK2256098 at a concentration of 10 μM significantly reduced FAK levels (Supplementary Figure S3C). Therefore, this concentration was selected for subsequent inhibitor assays. We also examined FAK levels by Western blotting to verify the knockdown efficiency of si-FAK (Supplementary Figure S3D).
We performed an EDU staining experiment to demonstrate the effect of attenuated FAK expression on proliferative capability. As shown in Figure 4D, the result illustrated that the growth capacity of BGC823-oe-CPNE8 cells decreased after knockdown of FAK or GSK2256098 treatment. In addition, we conducted cell cycle and apoptosis experiments to demonstrate the influence of tumor carcinogenesis with after weakening FAK expression. As shown in Supplementary Figure S4A, elevated CPNE8 had no effect on the cell cycle with GSK2256098 treatment or knockdown of FAK. After knockdown of FAK expression, there was a slight increase apoptotic cells in BGC823-oe-CPNE8 cells, while no apoptosis was induced by inhibitor treatment (Supplementary Figure S4B). These results suggested that CPNE8 might participate in other pathways to regulate cell growth.
The wound-healing assay showed that the mobility of BGC823-oe-CPNE8 cells was diminished in cells treated with si-FAK and GSK2256098 (Figure 4E). Furthermore, the Transwell assay showed that GSK2256098 reversed the CPNE8-induced migration and invasion abilities of GC cells (Figure 4F), and similar findings were observed after knockdown of FAK with si-FAK. These results indicate that the focal adhesion pathway mediates CPNE8-induced cell migration and invasion, which can be entirely reversed by the FAK inhibitor GSK2256098 or knockdown of FAK. In addition, we tested the effect of CPNE8 on cell adhesion by using an adhesion assay. As shown in Figure 4G, knockdown of CPNE8 in AGS cells resulted in significantly fewer adherent cells than in control cells. In contrast, the overexpression of CPNE8 in BGC823 cells enhanced their ability to adhere to the stroma. Consistently, treatment with GSK2256098 or siRNA targeting FAK resulted in significant reductions in the number of adherent BGC823-oe-CPNE8 cells. These results strongly supported our conclusion that CPNE8 promotes GC metastasis via upregulation of the focal adhesion pathway.
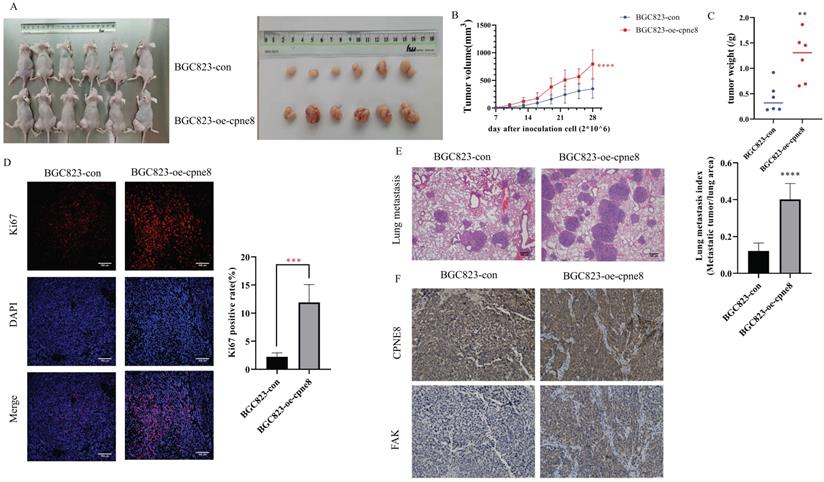
CPNE8 overexpression enhances GC metastasis in vivo
The effect of CPNE8 on GC metastasis was investigated in vivo. Mice injected with BGC-823-oe-CPNE8 cells showed a significant increase in tumor size and growth at 4 weeks post-inoculation compared to those injected with control cells (Figure 5A-B). After sacrificing the mice, tumor tissues were weighed. The group with CPNE8 overexpression showed a significant increase in tumor weight (Figure 5C). Immunofluorescence staining confirmed that tumors derived from the BGC823-oe-CPNE8 group exhibited higher Ki67 expression levels than tumors derived from control cells (Figure 5D). This implies that CPNE8 could improve the proliferative capacity of tumors in vivo. To further define the role of CPNE8 expression in promoting metastasis in vivo, we injected BGC823 cells with CPNE8 overexpression into nude mice through the tail vein. All mice were sacrificed four weeks later to harvest the lungs for H&E staining. Nude mice inoculated with CPNE8 overexpressing BGC823 cells exhibited more metastatic lung nodules (Figure 5E). Immunohistochemical analysis showed a consistent trend of CPNE8 and FAK expression in GC tissues of xenograft mice. IHC staining confirmed that tumors derived from the BGC823-oe-CPNE8 group exhibited higher CPNE8 and FAK expression levels than tumors derived from control cells (Figure 5F). Taken together, these in vivo experiments verified that CPNE8 was essential for promoting the growth and metastasis of GC cells.
CPNE8 overexpression enhanced GC metastasis in vivo. (A) The representative image demonstrated the tumor-bearing mice subcutaneously injected with BGC823 cells overexpressing CPNE8 versus control mice and the tumors harvested from the nude mice. (B) Tumor volumes were recorded every 3 days. Data are represented as mean ± SD of five mice in each group. (C) Significant increase in tumor weight of mice with overexpression of CPNE8. (D) Immunofluorescence staining of the proliferation marker revealed a higher expression of Ki67 in tumors overexpressing CPNE8. (E) Representative images of HE staining of lungs were collected from mice injected with GC cells via tail vein. Results are also expressed as metastatic lung index (lung tumor area/total lung area) analyzed in mice bearing the metastasis. (F) Immunohistochemistry staining of CPNE8 and FAK in GC tissues harvested from the xenograft mice.
Influence of high CPNE8 expression on the infiltration of CAFs in GC
Interactions between tumor cells and tumor microenvironment (TME) dynamically regulate the metastatic process [39-41]. We reanalyzed the TCGA-STAD dataset using the ESTIMATE algorithm and calculated the stromal score, immune score, and tumor purity (Figure 6A). The results showed that the stromal score (p <0.001), immune score (p <0.01), and ESTIMATE score (p <0.001) were significantly higher in the high CPNE8 expression cluster (Figure 6A). Consistently, we found that high CPNE8 expression was associated with higher stromal, immune, and ESTIMATE scores compared to the low CPNE8 group in GSE84437 (Supplementary Figure S5A).
High expression of CPNE8 was associated with the infiltration of cancer-associated fibroblasts in GC. (A) Manipulated Stromal score, Immune score, and ESTIMATE score based on CPNE8 status in TCGA-STAD cohort. (B) The correlation of CPNE8 expression and the infiltration of CAFs was quantified using the TIDE, EPIC, and XCELL algorithm in the TCGA-STAD cohort in the TIMER2 database. Each dot represents one sample. (C) Immunohistochemistry staining of CPNE8 and a-SMA in GC tissues of xenograft mice. (D) Significant and positive correlations between CPNE8 expression and ACTA2, FAP, ITGB1, PDPN, S100A4, and THY1. (E) The correlation of CPNE8 expression with various chemokines or chemokine receptors was displayed using the TISIDB database. (F) The mRNA levels of chemokine receptors were quantified by qRT-PCR in GC cells with respective knockdown or overexpression of CPNE8 compared to the control cells.
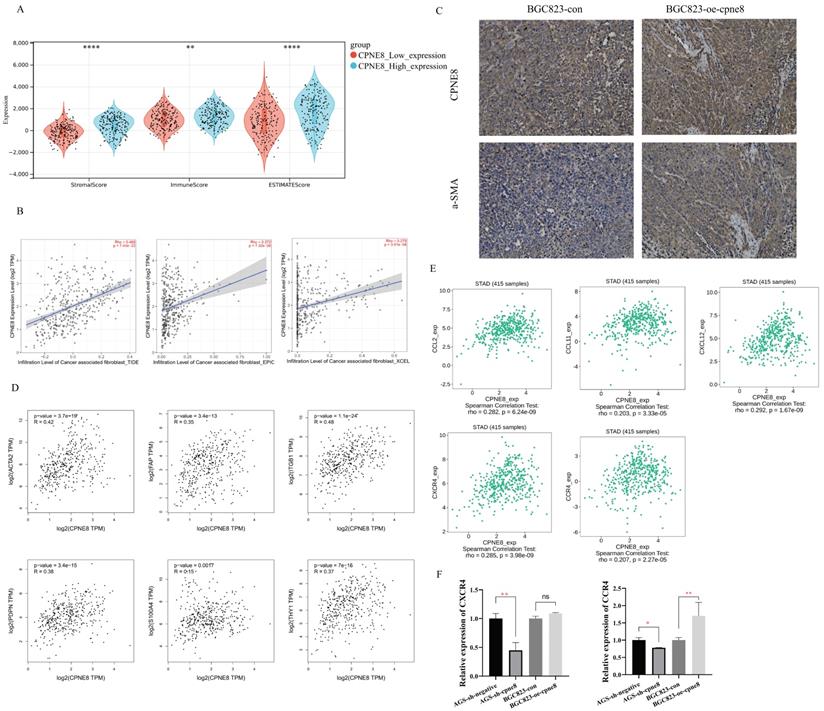
Cancer-associated fibroblasts (CAFs), the most prominent and abundant cell type in the GC stroma, are activated fibroblasts that play a key role in GC progression and metastasis [42-44]. We used multiple algorithms to compare the association between CAFs infiltration and CPNE8 expression. Consistent results demonstrated a high correlation between CPNE8 and CAF infiltration in the TCGA-STAD cohort (Figure 6B) and GSE84437 (Supplementary Figure S5B). These results suggest that CPNE8 may manipulate the recruitment of CAFs into the tumor microenvironment. IHC staining verified that tissues in xenograft mice overexpressing CPNE8 exhibited high expression of α-SMA, a well-known CAF marker (Figure 6C). In addition, we performed the correlation analysis between CPNE8 expression and several activated CAFs biomarkers in the TCGA-STAD cohort, such as α-smooth muscle actin (α-SMA, ACTA2), fibroblast-specific protein-1 (FSP-1, S100A4), fibroblasts activated protein (FAP), Thy-1 (THY1), (PDPN), and integrin beta1 (ITGB1). As shown in Figure 6D, there were significant positive correlations between CPNE8 and activated CAFs biomarkers, such as ACTA2 (R =0.42, p =3.7e-19), FAP (R =0.35, p =3.4e-13), ITGB1 (R =0.48, p =1.1e-24), PDPN (R =0.38, p =3.4e-15), S100A4 (R =0.15, p =0.0017), and THY1 (R =0.37, p =7e-15). CAFs always secret cytokines, chemokines, and growth factors in the tumor microenvironment to promote tumor progression and migration [45-47]. To test this in our model, we analyzed the correlation between CPEN8 and various chemokines and chemokine receptors using the TISIDB database. As shown in Figure 6E, there were significant positive correlations between CPNE8 and chemokines secreted from CAFs, such as CCL2 (R =0.282, p =6.24e-09), CCL11 (R =0.203, p =3.33e-05), and CXCL12 (R =0.292, p = 1.67e-09). We also observed a correlation between CPNE8 expression and chemokine receptors, including CXCR4 (R =0.285, p =3.98e-09) and CCR4 (R =0.207, p =2.27e-05). We used qRT-PCR analysis to verify the correlation between CPNE8 and chemokine receptor binding to the chemokines secreted by CAFs. The results showed that knockdown of CPNE8 resulted in a significant decrease in the expression of CXCR4 and CCR4 in GC cells compared to control cells, while overexpression of CPNE8 resulted in an upregulation of these genes (Figure 6F). These findings suggested that high CPNE8 expression may affect the infiltration of cancer-associated fibroblasts.
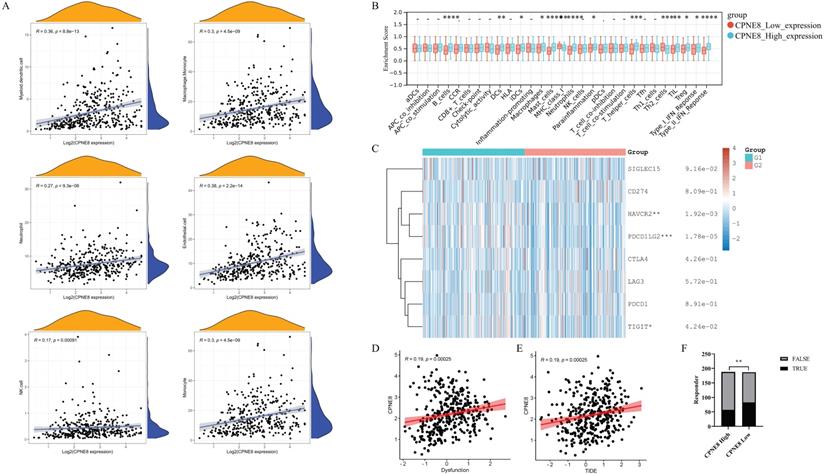
Higher expression of CPNE8 was correlated with poorer immunotherapy efficacy
Immune cells in the tumor microenvironment (TME) play an essential role in tumor progression [48]. We used the MCP-counter algorithm to analyze the relationship between CPNE8 expression and immune cell infiltration and found high correlations between CPNE8 expression and monocyte, macrophage/monocyte, myeloid dendritic cell, and neutrophil cell infiltration (Figure 7A). In addition, we used the “ssGSEA” algorithm to calculate the absolute enrichment of immune pathways in each sample and found that signaling pathways involved in immune responses, such as B cells, DCs, macrophages, MHC class I, Type I IFN Reponse, and Type II IFN Reponse, were enriched in the high CPNE8 expression cluster (Figure 7B). To further elucidate the role of CPNE8 in immunotherapy, as represented by immune checkpoint blockades CB), we extended our analysis to the association of CPNE8 with several well-known biomarkers. Spearman's correlation analysis of the TCGA-STAD cohort revealed that CPNE8 expression was significantly negatively correlated with MSI (R = -0.25, p = 8.87e-07) and TMB (R =-0.36, p =9.62e-13), implying a poor response to immunotherapy (Supplementary Figure S6A-B). In the TCGA-STAD cohort, CPNE8 expression was positively correlated with the expression of immune checkpoint genes such as PDCD1LG2, HAVCR2, and TIGIT, suggesting that higher CPNE8 expression may predict poorer immune responses in GC patients (Figure 7C). Furthermore, using the TIDE database (http://tide.dfci.harvard.edu), we calculated the correlations of CPNE8 with dysfunction and TIDE scores and found that increased CPNE8 expression was associated with higher immune dysfunction (R =0.19, p =0.00025) (Figure 7D) and TIDE scores (R =0.19, p =0.00025) (Figure 7E). Consistently, high CPNE8 expression predicted adverse responses to immune checkpoint therapy in GC patients (efficiency 30.32% vs. 44.39%, p =0.0049) (Figure 7F). These results suggest that CPNE8 expression can predict the clinical benefits of ICB in STAD.
CPNE8 expression could predict the clinical benefit of ICB. (A) Correlation of CPNE8 expression and immune infiltrating cells quantified using the MCP-counter algorithm in the TCGA-STAD cohort. (B) Correlation between ssGSEA scores of 29 immune cells and CPNE8 expression in gastric cancer. (C) The heatmap showed the correlation between CPNE8 expression and immune checkpoint genes. G1 represented the CPNE8 high expression group; G2 represented the CPNE8 low expression group. (D) Increased CPNE8 expression was associated with higher immune dysfunction scores. (E) The mRNA expression of CPNE8 was positively correlated with the TIDE score. (F) The rate of immune checkpoint blockade responses in GC patients was predicted by the TIDE algorithm in the high or low CPNE8 groups.
Discussion
Tumor metastasis, the leading cause of death in patients with advanced GC, remains a poorly understood cause of tumor progression [6, 9]. Therapeutic efficacy for metastatic GC remains limited owing to the poor prognosis of patients [49]. Accumulating evidence suggests that CPNE family members are involved in tumorigenesis and metastasis. However, the role of CPNE8 in GC progression and metastasis has not yet been thoroughly evaluated. Furthermore, tumor metastasis is not only driven by the accumulation of intrinsic changes within malignant cells, but is also modulated by various immune and stromal components in the tumor microenvironment [50-52]. Therefore, the aim of this study was to explore the potential mechanisms of CPNE8 in the progression and metastasis of GC and its potential immune activation and sensitivity to immunotherapies of GC patients.
Our research revealed that CPNE8 is highly expressed in GC, with significantly higher expression in metastatic tumors, especially in patients with liver metastases. In addition, CPNE8 was highly expressed in patients with advanced tumors (with a progressive grade or advanced TNM stage), suggesting that patients with high CPNE8 expression exhibit more aggressive clinicopathological characteristics. CPNE8 could be used as an independent prognostic factor for GC, and higher CPNE8 expression predicted poorer prognosis in GC. Summarily, CPNE8 may serve as a novel prognostic marker for GC. We knocked down or overexpressed CPNE8 in GC cells. In vitro and in vivo functional assays revealed that knockdown of CPNE8 reduced cell proliferation, possibly by promoting apoptosis and inhibiting the G1/S phase of cells. In contrast, overexpression of CPNE8 promoted cell proliferation by facilitating transition from the G1/S phase. Moreover, our results showed that GC cells with high CPNE8 expression demonstrated enhanced invasion and migration abilities, thus providing a basis for tumor metastasis. In vivo, CPNE8 promoted the growth and metastasis of xenograft tumors, which was consistent with the results obtained in vitro.
We further analyzed the mechanism of CPNE8 in enhancing GC metastasis. First, the GSEA and KEGG results showed that the high CPNE8 expression group was functionally enriched in focal adhesion, gap junction, and ECM receptor interaction in the TCGA-STAD cohort, which were correlated with cancer metastasis [35-37]. Our mass spectrometry analysis confirmed that CPNE8 is closely associated with focal adhesions. The role of focal adhesion in cell adhesion, migration, and cancer invasiveness has been well-studied [35, 53, 54]. The tyr397 phosphorylation and kinase activity of FAK were critical for GC invasiveness [55]. ERK is a member of the mitogen-activated protein kinase (MAPK) family and is activated by FAK interactions [56, 57]. Our study demonstrated that CPNE8 enhanced GC cell migration and invasion in an FAK-dependent manner. The phosphorylation levels of FAK (Tyr397) and ERK (p42/p44) decreased in cells with CPNE8 knockdown and increased in cells with CPNE8 overexpression. GSK2256098, a small molecule FAK inhibitor, reversed CPNE8-induced GC cell proliferative capability, mobility, and invasiveness. The proliferative capability of GC cells decreased after GSK2256098 treatment or knocking down FAK. However, there were no significant differences in the cell cycle and apoptosis between BGC823-oe-CPNE8 cells with and without the FAK inhibitor. Based on the findings from cell cycle and apoptosis analyses, knockdown of CPNE8 led to G1-S phase delay and apoptosis, while overexpression of CPNE8 promoted the cell cycle, suggesting that CPNE8 may regulate the G1-S phase transition and cell apoptosis via alternative pathways to focal adhesion.
We further studied tumor cell adhesion using fibronectin, an essential component for the adhesion of many cell types [58]. While our results showed that CPNE8 promoted GC cell adhesion, which could be reduced by FAK inhibitor, the underlying molecular mechanism between CPNE8 and FAK is still unknown. Nevertheless, our results suggest that CPNE8 plays a carcinogenic role in GC by activating the focal adhesion pathway, and FAK inhibition may be a promising therapy for GC patients with high CPNE8 expression.
Several studies have reported that the tumor immune microenvironment, consisting of immune cells, inflammatory cells, and CAFs, is associated with the invasion and metastasis of multiple tumor cells, and is closely correlated with tumor prognosis [50, 51]. CAFs, critical components of the stroma, have been reported to regulate chemokines in the tumor microenvironment and promote the progression of tumor metastasis [45, 46]. Our results demonstrated that CPNE8 was positively correlated with CAFs using different algorithms in TCGA-STAD and GSE84437 cohorts. IHC analysis results also revealed that overexpression of CPNE8 in GC tissue exhibited higher α-SMA expression, an evidential marker of CAFs, which implied that CPNE8 overexpression might recruit more CAFs in the microenvironment to promote GC metastasis. It has been previously demonstrated that CAFs secrete CXCL12, thus stimulating CXCL12/CXCR4 signaling and promoting tumor growth and angiogenesis in GC [59]. Previous studies also showed that CAFs could produce the chemokine ligand CCL17 to act on CCR4 of cancer cells to improve cancer proliferation and migration [60]. In addition, Tsuyada et al. showed that CCL2 and CXCL14 secreted by CAFs can increase the recruitment of macrophages and promote the invasive ability of breast cancer [61]. Nieh et al. found that CAFs facilitate cancer invasiveness through paracrine effects on micro-environmental CCL11 signaling in oral squamous cell carcinoma [62]. Our study revealed significant correlations between CPNR8 expression and chemokines secreted from CAFs in the TCGA-STAD cohort using the TISIDB database.
Interestingly, we assessed the mRNA levels of the chemokine receptors CCR4 and CXCR4 in GC cells and found that knockdown or overexpression of CPNE8 significantly regulated their expression, implying that CPNE8 may affect the function of CAFs via modulation of chemokine binding to cancer cells. However, whether mutual regulation between CPNE8 and CAFs exists is still unclear. The potential regulatory mechanism between CPNE8 and CAFs warrants more in-depth study, which may contribute to the understanding of additional mechanisms involved in GC metastasis.
Multiple tumor immune infiltrating cells, such as macrophages, MDSC, granulocytes, and lymphocytes, have been reported to promote multiple tumor metastases [39, 63]. In this study, we showed that CPNE8 expression is significantly positively correlated with monocytes, macrophages/monocytes, myeloid dendritic cells, and neutrophils. Functional enrichment by “ssGSEA” also demonstrated the involvement of CPNE8 in immune-related pathways.
Tumor immunotherapy is a powerful and promising clinical approach for the treatment of patients with cancer. However, the response rate remains challenging to assess in tumors, including in patients with GC [64, 65]. An increasing number of biomarkers are used to predict immune response, and these biomarkers play vital roles in the development, metastasis, and treatment of cancer [66, 67]. Microsatellite instability (MSI) is the first pan-cancer biomarker approved for immune checkpoint blockade (ICB) therapy [68, 69]. MSI-induced shift mutations result in the generation of large neoantigens, and tumors with high mutation rates may respond well to checkpoint inhibitors (CPIs) [70]. TMB has been reported as an effective biomarker of immune checkpoint inhibitor sensitivity [71]. Tumors with high TMB typically have higher levels of immune system-recognizable neoantigens that correlate with the response to PD-1, PD-L1, and CTLA-4 blockade immunotherapy [71, 72]. In this study, we observed a significant negative correlation between CPNE8 expression and MSI/TMB, implying a poor immune response in GC patients with high CPNE8 expression. Although the immune system can recognize malignant cells, the inactivation of anti-tumor T cells due to the upregulation of suppressive immune checkpoints in the tumor microenvironment results in an ineffective immune system response to the tumor cells [73]. We found that CPNE8 expression was positively correlated with the expression of suppressive checkpoints—HAVCR2, PDCD1LG2, and TIGIT. Peng et al. designed a new computational framework, the TIDE score, to assess the status of tumor immunity and predict the effect of immunosuppressive therapy [28, 29]. CPNE8 expression was positively correlated with immune dysfunction and TIDE scores in our study. By contrast, the response rate to immune checkpoint therapy was reduced by 14.07% in the CPNE8 high-expression group. These results suggest that GC patients with high CPNE8 expression may benefit less from available immune blockade therapy.
Our findings establish a novel link between CPNE8 expression and GC progression. CPNE8 might promote tumor proliferative capacity by accelerating the G1-S phase transition of the cell cycle. Conversely, knockdown of CPNE8 could lead to G1-S phase blockade to induce apoptosis, an outcome of cell cycle arrest [74-76]. In addition, CPNE8, a critical core factor of tumor metastasis, triggers the focal adhesion pathway by upregulating FAK and ERK expression and activating CAFs in the tumor microenvironment by regulating chemokines and their receptors, leading to a suppressed immune response.
Our study had some limitations, we did not elucidate the molecular mechanism of FAK regulation by CPNE8 and how CPNE8 activates CAFs. While studies concerning FAK activation in CAFs have been reported [77, 78], it is worthwhile to further investigate whether CPNE8 is involved in this regulatory effect.
In conclusion, our findings suggest that CPNE8 represents an independent prognostic risk factor that can predict poor outcomes in GC. CPNE8 could affect the migration and invasion of GC cells by enhancing focal adhesion, thus identifying a promising therapeutic target for GC. Furthermore, high levels of CPNE8 can recruit more CAFs and involve immune pathways in the tumor microenvironment. Together, these findings may help develop more effective therapeutic strategies by targeting GC progression and metastasis.
Abbreviations
AUC: area under curve; CAFs: cancer associated fibroblasts; CAMs: cell adhesion molecules; CPI: checkpoint inhibitor; CPN: copine; DFS: disease-free survival; FAK: focal adhesion kinase; FAP: fibroblast-activated protein; FBS: fetal bovine serum; FSP: fibroblast-specific protein; GC: gastric cancer; GES1-: gastric mucosal epithelial cell line; GO: gene ontology; GSEA: gene-set enrichment analysis; ICB: immune checkpoint blockade; ITGB1: integrin beta 1; KEGG: Kyoto encyclopedia of genes and genomes; MAPK: mitogen-activated protein kinase; MSI: microsatellite instability; OS: overall survival; PDPN: podoplanin; PFS: progression-free survival; ROC: receiver operating characteristic; ssGSEA: single-sample gene set enrichment analysis; STAD: clinical data of stomach adenocarcinoma; TIDE: tumor immune dysfunction and exclusion; TME: tumor microenvironment.
Supplementary Material
Supplementary figures and tables.
Acknowledgements
We sincerely acknowledge the contributions from the TCGA project and the GEO datasets.
Funding
This research was funded by the Natural Science Foundation of Guangdong Province, China (No. 2021A1515011113, Lin Lu), Guangzhou Science and Technology Program (No. 201904010427, Lin Lu), and Guangzhou General Science and technology project of Health and Family Planning (grant number 20201A011007, Lin Lu), and partially supported by the Longenbaugh Foundation (Qiao Li).
Availability of data and material
Publicly available datasets were analyzed in this study. This data can be found at 他the GEO browser ("https://www.ncbi.nlm.nih.gov/geo/") and TCGA project ("https://portal.gdc.cancer.gov/").
Author contributions
Guolong Liu and Lin Lu designed the study. Peiling Zhang and Xiaofei Cao performed the experimental manipulations, analyzed the data, and wrote the manuscript. Mingmei Guan and Dailing Li performed the experiments. Hong Xiang integrated the data. Qian Peng and Yun Zhou performed animal experiments. Chengyin Weng processed the data into graphs. Xisheng Fang analyzed data by software. Xia Liu did the investigation. Haibo Mao did the investigation. Mingmei Guan and Xiaofei Cao did the investigation. Lin Lu, Guolong Liu, and Qiao Li wrote the manuscript. Lin Lu was responsible for the manuscript review. All authors read and approved the final manuscript.
Competing Interests
The authors have declared that no competing interest exists.
References
1. Sung H, Ferlay J, Siegel RL, Laversanne M, Soerjomataram I, Jemal A. et al. Global Cancer Statistics 2020: GLOBOCAN Estimates of Incidence and Mortality Worldwide for 36 Cancers in 185 Countries. CA Cancer J Clin. 2021;71:209-49
2. Chen W, Zheng R, Baade PD, Zhang S, Zeng H, Bray F. et al. Cancer statistics in China, 2015. CA Cancer J Clin. 2016;66:115-32
3. Ferlay J, Colombet M, Soerjomataram I, Parkin DM, Pineros M, Znaor A. et al. Cancer statistics for the year 2020: An overview. Int J Cancer. 2021;149:778-89
4. Lu L, Mullins CS, Schafmayer C, Zeißig S, Linnebacher MJCC. A global assessment of recent trends in gastrointestinal cancer and lifestyle-associated risk factors. Cancer Communications. 2021;41:1137-51
5. Wang FH, Zhang XT, Li YF, Tang L, Qu XJ, Ying JE. et al. The Chinese Society of Clinical Oncology (CSCO): Clinical guidelines for the diagnosis and treatment of gastric cancer, 2021. Cancer Commun (Lond). 2021;41:747-95
6. Bilici A. Treatment options in patients with metastatic gastric cancer: current status and future perspectives. World J Gastroenterol. 2014;20:3905-15
7. Digklia A, Wagner AD. Advanced gastric cancer: Current treatment landscape and future perspectives. World J Gastroenterol. 2016;22:2403-14
8. Sexton RE, Al Hallak MN, Diab M, Azmi AS. Gastric cancer: a comprehensive review of current and future treatment strategies. Cancer metastasis reviews. 2020;39:1179-203
9. Riihimäki M, Hemminki A, Sundquist K, Sundquist J, Hemminki KJO. Metastatic spread in patients with gastric cancer. Oncotarget. 2016;7:52307
10. Creutz CE, Tomsig JL, Snyder SL, Gautier M-C, Skouri F, Beisson J. et al. The copines, a novel class of C2 domain-containing, calciumdependent, phospholipid-binding proteins conserved from Paramecium to humans. Journal of Biological Chemistry. 1998;273:1393-402
11. Tomsig JL, Creutz CE. Biochemical characterization of copine: a ubiquitous Ca2+-dependent, phospholipid-binding protein. Biochemistry. 2000;39:16163-75
12. Tang H, Pang P, Qin Z, Zhao Z, Wu Q, Song S. et al. The CPNE family and their role in cancers. Frontiers in Genetics. 2021 12
13. Arteta MY, Kjellman T, Bartesaghi S, Wallin S, Wu X, Kvist AJ. et al. Successful reprogramming of cellular protein production through mRNA delivered by functionalized lipid nanoparticles. Proceedings of the National Academy of Sciences. 2018;115:E3351-E60
14. Ilacqua AN, Price JE, Graham BN, Buccilli MJ, McKellar DR, Damer CK. Cyclic AMP signaling in Dictyostelium promotes the translocation of the copine family of calcium-binding proteins to the plasma membrane. BMC Cell Biol. 2018;19:13
15. Mukhopadhyay S, Badgandi HB, Hwang SH, Somatilaka B, Shimada IS, Pal K. Trafficking to the primary cilium membrane. Mol Biol Cell. 2017;28:233-9
16. Maitra R, Grigoryev DN, Bera TK, Pastan IH, Lee B. Cloning, molecular characterization, and expression analysis of Copine 8. Biochemical and biophysical research communications. 2003;303:842-7
17. Liu S, Tang H, Zhu J, Ding H, Zeng Y, Du W. et al. High expression of Copine 1 promotes cell growth and metastasis in human lung adenocarcinoma. Int J Oncol. 2018;53:2369-78
18. Lin H-c, Zhang F-l, Geng Q, Yu T, Cui Y-q, Liu X-h. et al. Quantitative proteomic analysis identifies CPNE3 as a novel metastasis-promoting gene in NSCLC. Journal of proteome research. 2013;12:3423-33
19. Ramsey H, Zhang DE, Richkind K, Burcoglu-O'Ral A, Hromas R. Fusion of AML1/Runx1 to copine VIII, a novel member of the copine family, in an aggressive acute myelogenous leukemia with t(12;21) translocation. Leukemia. 2003;17:1665-6
20. Zhao Y, Huang J, Liu T, He S, Shang C, Guo L. et al. Overexpression of long non-coding RNA RP11-396F22.1 correlates poor prognosis of patients with early-stage cervical cancer. Am J Transl Res. 2018;10:684-95
21. Dang TT, Westcott JM, Maine EA, Kanchwala M, Xing C, Pearson GWJO. ΔNp63α induces the expression of FAT2 and Slug to promote tumor invasion. Oncotarget. 2016;7:28592
22. Junfeng Z, Zhiping Z, Huan Q, Bing N, University WHJJoTMM. Copine 8 promotes proliferation, invasion and metastasis of pancreatic cancer. Journal of Third Military Medical University. 2020;42:601-10
23. Chiu WC, Lee YC, Su YH, Chai CY, Hu SC, Yuan SF. et al. Correlation of matrix metalloproteinase-2 and -9 expression with recurrences in primary spontaneous pneumothorax patients. J Thorac Dis. 2016;8:3667-75
24. Vegesna RJNC. Inferring tumour purity and stromal and immune cell admixture from expression data. Nat Commun. 2013;4:1-11
25. Li T, Fu J, Zeng Z, Cohen D, Li J, Chen Q. et al. TIMER2.0 for analysis of tumor-infiltrating immune cells. Nucleic Acids Res. 2020;48:W509-W14
26. Ru B, Ngar WC, Tong Y, Zhong JY, Zhong S, Wu WC. et al. TISIDB: an integrated repository portal for tumor-immune system interactions. Bioinformatics. 2019: 20.
27. Becht E, Giraldo NA, Lacroix L, Biology BBJG. Estimating the population abundance of tissue-infiltrating immune and stromal cell populations using gene expression. Genome Biology. 2016 17
28. Fu J, Li K, Zhang W, Wan C, Zhang J, Jiang P. et al. Large-scale public data reuse to model immunotherapy response and resistance. Genome Med. 2020;12:21
29. Jiang P, Gu S, Pan D, Fu J, Sahu A, Hu X. et al. Signatures of T cell dysfunction and exclusion predict cancer immunotherapy response. Nat Med. 2018;24:1550-8
30. Robin X, Turck N, Hainard A, Tiberti N, Lisacek F, Sanchez JC. et al. pROC: an open-source package for R and S+ to analyze and compare ROC curves. BMC Bioinformatics. 2011;12:77
31. Li L, Wang T, Li S, Chen Z, Wu J, Cao W. et al. TDO2 Promotes the EMT of Hepatocellular Carcinoma Through Kyn-AhR Pathway. Frontiers in oncology. 2021;10:3008
32. Wang X, Li T, Cheng Y, Wang P, Yuan W, Liu Q. et al. CYTL1 inhibits tumor metastasis with decreasing STAT3 phosphorylation. Oncoimmunology. 2019;8:e1577126
33. Huang Z, Zhou JK, Wang K, Chen H, Qin S, Liu J. et al. PDLIM1 inhibits tumor metastasis through activating hippo signaling in hepatocellular carcinoma. Hepatology. 2020;71:1643-59
34. Beauchemin N, Arabzadeh A. Carcinoembryonic antigen-related cell adhesion molecules (CEACAMs) in cancer progression and metastasis. Cancer metastasis reviews. 2013;32:643-71
35. Zhao J, Guan JL. Signal transduction by focal adhesion kinase in cancer. Cancer metastasis reviews. 2009;28:35-49
36. Lu L, Weng C, Mao H, Fang X, Liu X, Wu Y. et al. IL-17A promotes migration and tumor killing capability of B cells in esophageal squamous cell carcinoma. Oncotarget. 2016;7:21853-64
37. Eble JA, Niland S. The extracellular matrix in tumor progression and metastasis. Clin Exp Metastasis. 2019;36:171-98
38. Cao Q, Mao Z-D, Shi Y-J, Chen Y, Sun Y, Zhang Q. et al. MicroRNA-7 inhibits cell proliferation, migration and invasion in human non-small cell lung cancer cells by targeting FAK through ERK/MAPK signaling pathway. Oncotarget. 2016;7:77468
39. Kitamura T, Qian BZ, Pollard JW. Immune cell promotion of metastasis. Nat Rev Immunol. 2015;15:73-86
40. Goubran HA, Kotb RR, Stakiw J, Emara ME, Burnouf T. Regulation of tumor growth and metastasis: the role of tumor microenvironment. Cancer Growth Metastasis. 2014;7:9-18
41. Ungefroren H, Sebens S, Seidl D, Lehnert H, Hass R. Interaction of tumor cells with the microenvironment. Cell Commun Signal. 2011;9:18
42. Zheng H, Liu H, Li H, Dou W, Wang X. Weighted Gene Co-expression Network Analysis Identifies a Cancer-Associated Fibroblast Signature for Predicting Prognosis and Therapeutic Responses in Gastric Cancer. Front Mol Biosci. 2021;8:744677
43. Ham IH, Lee D, Hur H. Role of Cancer-Associated Fibroblast in Gastric Cancer Progression and Resistance to Treatments. J Oncol. 2019;2019:6270784
44. Yan Y, Wang LF, Wang RF. Role of cancer-associated fibroblasts in invasion and metastasis of gastric cancer. World J Gastroenterol. 2015;21:9717-26
45. Hussain S, Peng B, Cherian M, Song JW, Ahirwar DK, Ganju RK. The Roles of Stroma-Derived Chemokine in Different Stages of Cancer Metastases. Front Immunol. 2020;11:598532
46. Guo S, Deng CX. Effect of Stromal Cells in Tumor Microenvironment on Metastasis Initiation. Int J Biol Sci. 2018;14:2083-93
47. Karagiannis GS, Poutahidis T, Erdman SE, Kirsch R, Riddell RH, Diamandis EPJMcr. Cancer-associated fibroblasts drive the progression of metastasis through both paracrine and mechanical pressure on cancer tissue. Molecular cancer research. 2012;10:1403-18
48. Lei X, Lei Y, Li J-K, Du W-X, Li R-G, Yang J. et al. Immune cells within the tumor microenvironment: Biological functions and roles in cancer immunotherapy. Cancer letters. 2020;470:126-33
49. Yang D, Hendifar A, Lenz C, Togawa K, Lenz F, Lurje G. et al. Survival of metastatic gastric cancer: Significance of age, sex and race/ethnicity. J Gastrointest Oncol. 2011;2:77-84
50. Lunt SJ, Chaudary N, Hill RP. The tumor microenvironment and metastatic disease. Clin Exp Metastasis. 2009;26:19-34
51. Anderson NM, Simon MC. The tumor microenvironment. Curr Biol. 2020;30:R921-R5
52. Justus CR, Sanderlin EJ, Yang LVJIjoms. Molecular connections between cancer cell metabolism and the tumor microenvironment. International journal of molecular sciences. 2015;16:11055-86
53. Weiner TM, Liu ET, Craven RJ, Cance WG. Expression of focal adhesion kinase gene and invasive cancer. Lancet (London, England). 1993;342:1024-5
54. Wu S, Chen M, Huang J, Zhang F, Lv Z, Jia Y. et al. ORAI2 Promotes Gastric Cancer Tumorigenicity and Metastasis through PI3K/Akt Signaling and MAPK-Dependent Focal Adhesion Disassembly. Cancer research. 2021;81:986-1000
55. Lai I-R, Chu P-Y, Lin H-S, Liou J-Y, Jan Y-J, Lee J-C. et al. Phosphorylation of focal adhesion kinase at Tyr397 in gastric carcinomas and its clinical significance. The American journal of pathology. 2010;177:1629-37
56. Yin K, Shang M, Dang S, Wang L, Xia Y, Cui L. et al. Netrin-1 induces the proliferation of gastric cancer cells via the ERK/MAPK signaling pathway and FAK activation Corrigendum in/10.3892/or. 2018.6863. Oncology reports. 2018;40:2325-33
57. Ding Q, Gladson CL, Wu H, Hayasaka H, Olman MAJJoBC. Focal adhesion kinase (FAK)-related non-kinase inhibits myofibroblast differentiation through differential MAPK activation in a FAK-dependent manner. Journal of Biological Chemistry. 2008;283:26839-49
58. Ruoslahti E. Fibronectin in cell adhesion and invasion. Cancer metastasis reviews. 1984;3:43-51
59. Izumi D, Ishimoto T, Miyake K, Sugihara H, Eto K, Sawayama H. et al. CXCL12/CXCR4 activation by cancer-associated fibroblasts promotes integrin β1 clustering and invasiveness in gastric cancer. International journal of cancer. 2016;138:1207-19
60. Omland SH, Wettergren EE, Mollerup S, Asplund M, Mourier T, Hansen AJ. et al. Cancer associated fibroblasts (CAFs) are activated in cutaneous basal cell carcinoma and in the peritumoural skin. BMC cancer. 2017;17:675
61. Tsuyada A, Chow A, Wu J, Somlo G, Chu P, Loera S. et al. CCL2 mediates cross-talk between cancer cells and stromal fibroblasts that regulates breast cancer stem cells. Cancer research. 2012;72:2768-79
62. Nieh SJCR. The role of cancer-associated fibroblast-induced chemokine ligand 11 in tumor microenvironment contributes to the progression of oral cancer. Cancer research. 2017
63. Smith HA, Kang Y. The metastasis-promoting roles of tumor-associated immune cells. J Mol Med (Berl). 2013;91:411-29
64. Tanaka H, Yamakoshi Y, Sakimura C, Mori T, Deguchi S, Miki Y. et al. [Biomarkers for Immunotherapy Based on the Local Microenvironment of Gastric Cancer]. Gan To Kagaku Ryoho. 2020;47:1292-7
65. Lei Y, Li X, Huang Q, Zheng X, Liu M. Progress and Challenges of Predictive Biomarkers for Immune Checkpoint Blockade. Front Oncol. 2021;11:617335
66. Matsueda S, Graham DY. Immunotherapy in gastric cancer. World J Gastroenterol. 2014;20:1657-66
67. Koizumi K, Hojo S, Akashi T, Yasumoto K, Saiki IJCs. Chemokine receptors in cancer metastasis and cancer cell-derived chemokines in host immune response. Cancer science. 2007;98:1652-8
68. Le DT, Durham JN, Smith KN, Wang H, Bartlett BR, Aulakh LK. et al. Mismatch repair deficiency predicts response of solid tumors to PD-1 blockade. Science. 2017;357:409-13
69. Le DT, Uram JN, Wang H, Bartlett BR, Kemberling H, Eyring AD. et al. PD-1 Blockade in Tumors with Mismatch-Repair Deficiency. N Engl J Med. 2015;372:2509-20
70. Wang Z, Zhao X, Gao C, Gong J, Wang X, Gao J. et al. Plasma-based microsatellite instability detection strategy to guide immune checkpoint blockade treatment. J Immunother Cancer. 2020 8
71. Choucair K, Morand S, Stanbery L, Edelman G, Dworkin L, Nemunaitis J. TMB: a promising immune-response biomarker, and potential spearhead in advancing targeted therapy trials. Cancer Gene Ther. 2020;27:841-53
72. Klein O, Kee D, Markman B, Carlino MS, Underhill C, Palmer J. et al. Evaluation of TMB as a predictive biomarker in patients with solid cancers treated with anti-PD-1/CTLA-4 combination immunotherapy. Cancer Cell. 2021;39:592-3
73. Kim HR, Park HJ, Son J, Lee JG, Chung KY, Cho NH. et al. Tumor microenvironment dictates regulatory T cell phenotype: Upregulated immune checkpoints reinforce suppressive function. J Immunother Cancer. 2019;7:339
74. Owa T, Yoshino H, Yoshimatsu K, Nagasu T. Cell cycle regulation in the G1 phase: a promising target for the development of new chemotherapeutic anticancer agents. Curr Med Chem. 2001;8:1487-503
75. Pucci B, Kasten M, Giordano A. Cell cycle and apoptosis. Neoplasia. 2000;2:291-9
76. Foster IJR. Cancer: A cell cycle defect. Radiography. 2008;14:144-9
77. Wu HJ, Hao M, Yeo SK, Guan JL. FAK signaling in cancer-associated fibroblasts promotes breast cancer cell migration and metastasis by exosomal miRNAs-mediated intercellular communication. Oncogene. 2020;39:2539-49
78. Xuefeng X, Hou M-X, Yang Z-W, Agudamu A, Wang F, Su X-L. et al. Epithelial-mesenchymal transition and metastasis of colon cancer cells induced by the FAK pathway in cancer-associated fibroblasts. Journal of International Medical Research. 2020;48:0300060520931242
Author contact
![]() Corresponding author: Dr. Lin Lu, eylinlvedu.cn; Dr. Guolong Liu, eyglliuedu.cn; Dr. Qiao Li, qiaoliedu
Corresponding author: Dr. Lin Lu, eylinlvedu.cn; Dr. Guolong Liu, eyglliuedu.cn; Dr. Qiao Li, qiaoliedu