Impact Factor ISSN: 1449-2288
- Issue 12; 2026
- Issue 11; 2026
- Issue 10; 2026
- Issue 9; 2026
- Issue 8; 2026
- Volume 22; 2026
- Past Issues
- Advance Articles
- Editorial Board
- Cover Images
- Index & Coverage
- Cover Suggestion
- Special Issues
Introduction
Materials and Methods
Results
Discussion
Supplementary Material
Acknowledgements
References

 Global reach, higher impact
Int J Biol Sci 2022; 18(14):5415-5437. doi:10.7150/ijbs.75503 This issue Cite
Research Paper
Csf1r mediates enhancement of intestinal tumorigenesis caused by inactivation of Mir34a
Fangteng Liu1, Nassim Bouznad1*, Markus Kaller1*, Xiaolong Shi1, Janine König1, Stephanie Jaeckel1, Heiko Hermeking1,2,3 ![]()
1. Experimental and Molecular Pathology, Institute of Pathology, Ludwig-Maximilians-University München, Germany
2. German Cancer Consortium (DKTK), D-69120 Heidelberg, Germany
3. German Cancer Research Center (DKFZ), D-69120 Heidelberg, Germany
*These authors contributed equally
Received 2022-5-26; Accepted 2022-8-4; Published 2022-8-29
Abstract

The CSF1 receptor (CSF1R) encoding mRNA represents a direct target of miR-34a. However, the in vivo relevance of the suppression of CSF1R by miR-34a for intestinal tumor suppression mediated by the p53/miR-34a pathway has remained unknown. Here, ApcMin/+ mice with intestinal-epithelial cell (IEC)-specific deletions of Mir34a showed increased formation of adenomas and decreased survival, whereas deletion of Csf1r decreased adenoma formation and increased survival. In adenomas deletion of Mir34a enhanced proliferation, STAT3 signaling, infiltration with fibroblasts, immune cells and microbes, and tumor stem cell abundance and decreased apoptosis. Deletion of Csf1r had the opposite effects. In addition, homeostasis of intestinal secretory and stem cells, and tumoroid formation were affected in opposite directions by deletion of Mir34a and CSF1R. Concomitant deletion of Csf1r and Mir34a neutralized the effects of the single deletions. mRNAs containing Mir34a seed-matching sites, which encode proteins related to EMT (epithelial-mesenchymal transition), stemness and Wnt signaling, were enriched after Mir34a inactivation in adenomas and derived tumoroids. Netrin-1/Ntn1 and Transgelin/Tagln were characterized as direct targets of Mir34a and Csf1r signaling. Mir34a-inactivation related expression signatures were associated with CMS4/CRISB+D, stage 4 CRCs and poor patient survival. In tumoroids the loss of Mir34a conferred resistance to 5-FU which was mediated by Csf1r. This study provides genetic evidence for a requirement of Mir34a-mediated Csf1r suppression for intestinal stem/secretory cell homeostasis and tumor suppression, and suggests that therapeutic targeting of CSF1R may be effective for the treatment of CRCs with defects in the p53/miR-34a pathway.
Keywords: MiR34a, miR-34a, CSF1R, Csf1r, APC, p53, intestinal adenomas, colorectal cancer, Ntn1, Tagln
Introduction
Colorectal cancer (CRC) arises through a multistep process in which genetic and epigenetic alterations accumulate in a sequential order. CRC is caused by the sequential inactivation of tumor suppressor genes (APC, DCC, DPC4/SMAD4, TP53) and activation of oncogenes, such as KRAS [1]. Activation of the Wnt signaling pathway by mutations of the Adenomatous polyposis coli (APC) or the CTNNB1 gene is a hallmark of CRCs [2].
The miR-34a gene is directly activated by p53 and has tumor suppressive functions [3-7]. Numerous mRNAs directly targeted by miR-34a have been identified, which mediate its effects [8-10]. The miR-34a gene is frequently inactivated by epigenetic silencing in CRCs and other tumor entities [11, 12]. Whereas, inactivation of the Mir34a and/or Mir34b/c genes in mice does not increase the rate of tumor formation, combination of Mir34 loss with other pro-tumorigenic lesions or treatments promotes tumor formation and progression in mouse models of prostate [13], pancreatic [14] and lung cancer [15] as well as in sporadic [16], colitis-associated [17] and inherited colon cancer mouse models [18]. Since loss of Mir34a did not promote lymphoma formation in Eµ-Myc mice [19] and the ability of miR-34a to inhibit proliferation may depend on high levels of expression, the definition of miR-34a as bona fide tumor suppressor has been subject to debates [20]. However, besides its effects on proliferation miR-34a has been implicated in the negative regulation of numerous other pro-tumorigenic processes, such as autophagy and metabolism, by targeting key regulators and effectors of these processes [3-7]. Therefore, miR-34a presumably harbors context-dependent, tumor suppressive capacities.
Recently, we demonstrated that abrogation of the miR-34-mediated suppression of CSF1R/STAT3 signaling promotes EMT and associated processes, such as migration, invasion, metastasis and chemo-resistance of human colorectal cancer cell lines [21]. In primary CRCs elevated expression of CSF1R was detected at the tumor invasion front and was associated with CpG methylation of the miR-34a promoter as well as distant metastasis [21].
Here, we aimed to determine the in vivo role of Csf1r as a Mir34a target in a preclinical mouse model of CRC using a genetic approach. Therefore, we generated ApcMin/+ mice carrying intestinal-epithelial cell (IEC)-specific deletions of the Mir34a or Csf1r loci and combinations of these. Here we report the characterization of the resulting phenotypes at the organismal and molecular level. Our findings provide genetic proof of an important role of Csf1r down-regulation for tumor suppression by Mir34a during intestinal tumorigenesis.
Materials and Methods
Generation and breeding of mice
Conditional Csf1r gene knockout mice (Csf1rfl/fl), in which exon 5 of the Csf1r gene is flanked by loxP sites [22], were purchased from the Jackson Laboratory (Csf1rflox, Stock No: 021212). The generation of Mir34afl/fl mice was described previously [17]. To delete Csf1r and Mir34a in intestinal epithelial cells (IECs), Csf1rfl/fl and Mir34afl/fl mice were crossed with Villin-Cre mice with a C57BL/6 background [10, 22-24]. The offspring showed no overt phenotype and the genotypes were obtained in normal Mendelian ratios. Csf1rΔIEC, Mir34aΔIEC, Csf1rfl/fl;Mir34afl/fl and Csf1rΔIEC;Mir34aΔIEC mice were crossed with ApcMin/+ mice with a C57BL6 background. Mice were housed in individually ventilated cages (IVC) with a 12 hour light/dark cycle and ad libitum access to water and standard rodent diet. Animal experimentation was approved by the Government of Upper Bavaria. Oligonucleotides used for genotyping are listed in Supplementary Table S1.
Tissue preparation and adenoma counting
The whole murine intestinal tract was isolated and flushed with PBS. The small intestine was separated into three equal parts (duodenum, jejunum and ileum). The murine intestinal tract was opened longitudinally and rolled to form a “swiss roll”. Each part was photographed, fixed in formalin, dehydrated and embedded into paraffin. Tumor numbers and size were evaluated by using a ZEISS dissecting microscope.
Histology and Immunohistochemistry
5 μm paraffin sections were used for hematoxylin and eosin (H&E), and periodic acid-Schiff (PAS) staining. Immunohistochemistry (IHC) was conducted using DAB (3,3´-Diaminobenzidine) for brown stainings or aminoethyl carbazole (AEC) for red stainings. Antibodies and reagents are listed in Supplementary Table S2. Slides were scanned (Vectra® Polaris™ Automated Quantitative Pathology Imaging System), and quantified by ImageJ software [18].
In situ hybridization analysis
For detection of intestinal stem cells (ISCs), the Olfm4 and Lgr5 RNA probes were generated using the Bluescript II SK plasmid p695-pBS-mOlfm4 (kindly provided by Prof. Hans Clevers), and the pBSII KS-mLgr5 plasmid. The Lgr5 open reading frame (ORF) was obtained from the pCMV6 entry plasmid (bought from OriGene Technologies, Inc., catalog number MR219702), and cloned into the Bluescript II (pBSII) KS plasmid by using the restriction enzymes NotI and KpnI. For the generation of the probes the Bluescript II plasmid p695-pBS-mOlfm4 and the pBSII KS-mLgr5 were linearized with NotI and EcoRI restriction enzymes, respectively. The Olfm4 and Lgr5 RNA probes were in vitro transcribed with RNA-T7 Polymerase and labeled with digoxigenin (DIG) by using the DIG Northern Starter Kit (Roche Diagnostics). In situ hybridization (ISH) was performed as described [25]. For visualization of bacterial infiltration in intestinal adenoma, the universal eubacteria probe (EUB338) and negative probe (NON338) were used for fluorescence in situ hybridization (FISH) as previously described [16]. The oligonucleotides used for FISH are listed in Supplementary Table S3.
Generation of cell pools stably expressing conditional alleles
Stably transfected cells were generated as described previously [24]. Briefly, cells were transfected with pRTR plasmids [26] using Lipofectamin 2000 (Invitrogen) or FuGENE6 (Roche). After 24 hours, cells were transferred into media containing 4 μg/ml puromycin for one week. Homogeneity of the derived cell pools was tested by addition of 100 ng/ml DOX for 48 hours, and GFP expression was evaluated by fluorescence microscopy.
Cell lines and tumoroid culture
The lung cancer cell line H1299 and colorectal cancer cell line SW480 were kept in Dulbecco's modified Eagle's medium (DMEM), murine colorectal carcinoma cell CT26 was cultured in RPMI1640 (Sigma-Aldrich, Gibco Life Technologies). Intestinal adenoma cells from three tumors for each ApcMin/+ mouse were isolated by lysis in DMEM containing 4000 units Collagenase Type IV (Merck Millipore) and 125 μg/ml Dispase Type II (Sigma-Aldrich). 1.5×10⁴ single cells were counted using a hemocytometer and then embedded in 50 μl Matrigel per well and seeded in 24-well plates. Tumoroids were documented with a Nikon AZ-100 macroscope. Tumoroid passaging and culture medium formulation was done as described before [24, 27].
Immunofluorescence (IF) staining of tumoroids
Organoids were harvested for immunofluorescence staining as previously described [28, 29]. Briefly, Matrigel drops containing tumoroids were collected in 15 ml centrifuge tubes and washed with cold HBSS three times gently. Tumoroids were settled by gravity. Then tumoroids were fixed with 4% paraformaldehyde (PFA) for 30 minutes, permeabilized with 0.1% Triton X-100 for 30 minutes, and then pre-blocked with HBSS containing 5% BSA for 1 hour at room temperature. The antibodies used for immunofluorescence staining are listed in Supplementary Table S2. For EdU staining an EdU Click 555 Kit (baseclick GmbH) was used according to the manufacturer's protocol. The images of tumoroids were acquired with an LSM 700 confocal microscope (Zeiss).
Dual 3'-UTR luciferase reporter assays
The 3'-UTR of the murine Csf1r, Tagln and Ntn1 mRNA was PCR amplified from cDNA obtained from murine bone-marrow derived macrophages or murine genomic DNA. The 3'-UTRs of the human TAGLN and NTN1 mRNA were PCR amplified from cDNA obtained from SW480, inserted into the pGL3-control-MCS vector, and verified by sequencing. The mutagenesis of the miR-34a seed-matching sequences was performed with the QuikChange II XL Site-Directed Mutagenesis Kit (Stratagene) or Mut Express II Fast Mutagenesis Kit V2 (Vazyme Biotech Co.,Ltd) and verified by sequencing. H1299 or CT-26 cells were seeded in 12-well plate with 3×10⁴ cells/well for 24 hours, and transfection with 100 ng of the indicated firefly luciferase reporter plasmid, 20 ng of Renilla reporter plasmid for normalization, and 25 nM of pre-miR-34a oligonucleotide (Ambion, PM11030), or a negative control oligonucleotide (Ambion, neg. control #1) with HiPerFect Transfection Reagent (Qiagen). 48 hours later, luciferase assays were performed using a Dual Luciferase Reporter assay (Promega). Fluorescence intensities were measured with an Orion II Luminometer (Berthold) and analyzed with the SIMPLICITY software package (DLR). The oligonucleotides and the primers used for cloning and mutagenesis are listed in Supplementary Table S4.
Quantitative real-time PCR
Total RNA was isolated using the RNeasy Plus Mini Kit (Qiagen) or High Pure RNA Isolation Kit (Roche), and converted to cDNA using the Verso cDNA Kit (Thermo Scientific). Quantitative real-time PCR (qPCR) was conducted with Fast SYBR Green Master Mix (Applied Biosystems) on the LightCycler 480 II platform (Roche Diagnostics). Expression was normalized to Cyclophilin, B2M or β-actin expression and calculated using the 2-ΔΔCt method [30]. Primers used for qPCR are listed in Supplementary Table S5.
Western blot analysis
Cell-lysates were collected in RIPA lysis buffer (50 mM Tris/HCl, pH 8.0, 250 mM NaCl, 1% NP40, 0.5% (w/v) sodium deoxycholate, 0.1% sodium dodecylsulfate, protease inhibitor cocktail tablets (Roche) and phosphatase inhibitor cocktail tablets (Roche)), and then sonicated and centrifuged at 12000 rpm for 20 min at 4°C. 40-80 μg protein were separated on 12% sodium dodecyl sulfate-acrylamide gels and transferred to Immobilon-P transfer membranes (R1JB33689; Merck Millipore). Signals from horseradish-peroxidase-coupled secondary antibodies were generated by enhanced chemiluminescent substrate (WBKLS0100; Merck Millipore) and recorded with a CCD/Charged Coupled Device camera (Odyssey Fc; LI-COR, Lincoln, NE). Densitometric analysis of blots was performed using Image Studio Version 5.2 software. Antibodies used here are listed in Supplementary Table S2.
Transcriptomic analysis
Total RNA from adenomas or tumoroids was isolated using the RNeasy Plus Mini Kit (Qiagen), with an on-column DNase digestion (3 RNA samples per genotype; each tumor RNA sample represented a pool of 3 tumors isolated from the same mouse). Random primed cDNA libraries were constructed and sequenced using the HiSeq4000 (Illumina) platform by GATC (Konstanz, Germany). Each sample was covered by at least 30 million single reads of 50 bp length. RNA-Seq FASTQ files were processed using the RNA-Seq module implemented in the CLC Genomics Workbench v20.0.2 software (Qiagen Bioinformatics) and mapped to the GRCm38/mm10 mouse reference genome and its associated gene and transcript annotation (ENSEMBL) using the settings mismatch cost = 2, insertion cost = 2, deletion cost = 3, length fraction = 0.8, similarity fraction = 0.8. RNA-Seq data were filtered to exclude weakly expressed transcripts with less than two mapped exon reads in all samples from the analysis and subjected to upper quartile normalization using the R/Bioconductor RUVSeq (remove unwanted variation from RNA-Seq data) package as described in Risso et al. [31]. Differential gene expression analysis was performed with DESeq2 [32] after normalization using the RUVg approach to remove variation between RNA samples resulting from differences in library preparation. Principal Component Analysis (PCA) was performed using the PCA functionality of the EDASeq R package as implemented in RUVSeq. Gene Set Enrichment Analysis (GSEA) was performed with the fgsea R package [33]. Prior to GSEA, expression changes from low count genes were adjusted using the ashr (adaptive shrinkage) estimator [34]. Heatmaps were generated with Morpheus (Broad Institute). Gene sets were obtained from the Molecular Signatures database (MSigDB) [35] or as indicated [36-40]. miR-34a targets were predicted with TargetScanMouse 7.1 [41] and 11 additional miRNA target prediction algorithms, which are included in the miRWalk2.0 archive [42].
Analysis of expression and clinical data from public databases
For the generation of STAT3 and c-JUN expression signatures, we compiled RNA-Seq datasets from the NCBI Gene Expression Omnibus (GEO), as described recently [43]. Differentially regulated genes were identified using RNA-Seq data from cell lines/tissues with STAT3, c-JUN, or SRF ectopic expression or knockdown (KD)/knockout (KO). A list of analyzed RNA-Seq studies is provided in Supplementary Table S6-9 with the respective GEO accession numbers. Direct regulation was assessed by analysis of transcription factor ChIP-Seq data using the Cistrome database [44]. Only ChIP-Seq data sets that passed peak quality controls were included in the analysis. A list of ChIP-Seq studies analyzed is provided in Supplementary Table S6-9 with the respective GEO accession numbers.
For the analysis of human colon cancer samples, we retrieved expression and clinical data from the TCGA-COAD and GSE39582 patient cohorts [45, 46]. Association of patient samples with the different CMS categories was obtained from the Colorectal Cancer Subtyping Consortium (CRCSC) at www.synapse.org. The classifications of tumor samples by CRC intrinsic subtypes (CRIS) were obtained from [47]. Expression data of human CRC cell lines were obtained from the Cancer Cell Line Encyclopedia (CCLE) [48]. The statistics for Forest plots and survival curves was calculated by log-rank test. For binary classification of cases (high/low expression), the Survminer R-package (https://CRAN.R-project.org/package=survminer) was used to determine optimal cutoff values. Differential expression between tumors of different stages was calculated using one-way ANOVA with a post-test for linear trend from stage 1 to stage 4. Gene Set Enrichment Analysis (GSEA) of curated gene sets obtained from the Molecular Signatures database (MSigDB) [35], or as indicated [43, 49], was performed on pre-ranked gene lists ordered by expression correlation coefficients (Pearson) with the Δ34a expression signature, mature miR-34a, or CSF1R expression, as described previously [21]. The significance of enrichments is presented by normalized enrichment scores (NES) and false discovery rate-adjusted q values.
Statistical analyses
The GraphPad Prism 8.3.0 software was used for statistical analyses. The statistical significance of differences between group means was determined with the two-tailed unpaired Student's t test and one-way ANOVA. Kaplan-Meier curves were used to display the overall survival time and the results were compared with a log-rank test. P values less than 0.05 were considered as statistically significant with asterisks indicated (*P < 0.05, **P < 0.01, ***P <0.001, or ****P < 0.0001).
Results
Combined deletion of Mir34a and Csf1r in murine intestinal epithelium
Similar to the human CSF1R the 3'-UTR of the murine Csf1r contains a conserved Mir34a seed-matching sequence (SMS) (Fig. 1A). In a reporter assay the murine Csf1r 3'-UTR was repressed by ectopic Mir34a, whereas a reporter with point mutations in the Mir34a SMS was refractory to repression by ectopic Mir34a in murine CT26 CRC cells (Fig. 1B). In addition, expression of the endogenous Csf1r was repressed by ectopic pre-miR-34a in murine CT26 cells, similar to the known miR-34a targets Snai1 and Notch1, whereas β-actin expression was not affected (Fig. 1C). Therefore, Csf1r represents a direct, conserved target for repression by Mir34a in mice.
Analysis of the Csf1r/Mir34a connection in mice. A Scheme of the murine miR-34a seed, the seed-matching sequence and its targeted mutation in the 3'-UTR of the murine Csf1r mRNA. B Dual-reporter assay after transfection of CT26 cells with pre-Mir34a oligonucleotides and the murine Csf1r 3'-UTR reporter constructs. Data represent mean ± SD (n = 3). C qPCR analysis of the indicated mRNAs in CT26 cells after transfection with control or pre-Mir34a oligonucleotides for 48 hours. Data represent mean ± SD (n = 3). D Scheme showing the generation of mice with intestinal epithelial cell-specific deletions. E Analysis of the indicated mRNAs in intestinal epithelial cells (IECs) derived from the mice with the indicated genotypes. Data represent mean ± SD (n≥3). F Determination of the length of the small intestine, and the width and height of villi and the width and depth of crypts in the small intestine from ApcMin/+ mice with the indicated genotypes (≥ 160 ileum villi or crypts per group and n ≥ 4 mice per genotype). G Quantification of goblet cell number and size from the ApcMin/+ mice with the indicated genotypes after anti-MUC2 staining (≥ 200 villi and ≥ 3000 goblet cells per group, and n ≥ 3 mice per genotype). Scale bar: 20 μm. H Quantification of Paneth cell number per crypt from the ApcMin/+ mice with the indicated genotypes after staining with a Lysozyme-specific antibody (≥ 300 crypt bases per group and n ≥ 3 mice per genotype). Scale bar: 20 μm. I Quantification of entero-endocrine cells per crypt-villus axis from the ApcMin/+ mice with the indicated genotypes after staining with Chromogranin A specific antibodies (≥ 150 crypt-villus axes per group and n ≥ 3 mice per genotype). Scale bar: 20 μm. In (B,C,E), results are presented as mean ± SD using the two-tailed unpaired Student's t test. In (F-I), results are presented as mean ± SD using Tukey's multiple comparisons test. *P < 0.05, **P < 0.01, ***P <0.001, or ****P < 0.0001.
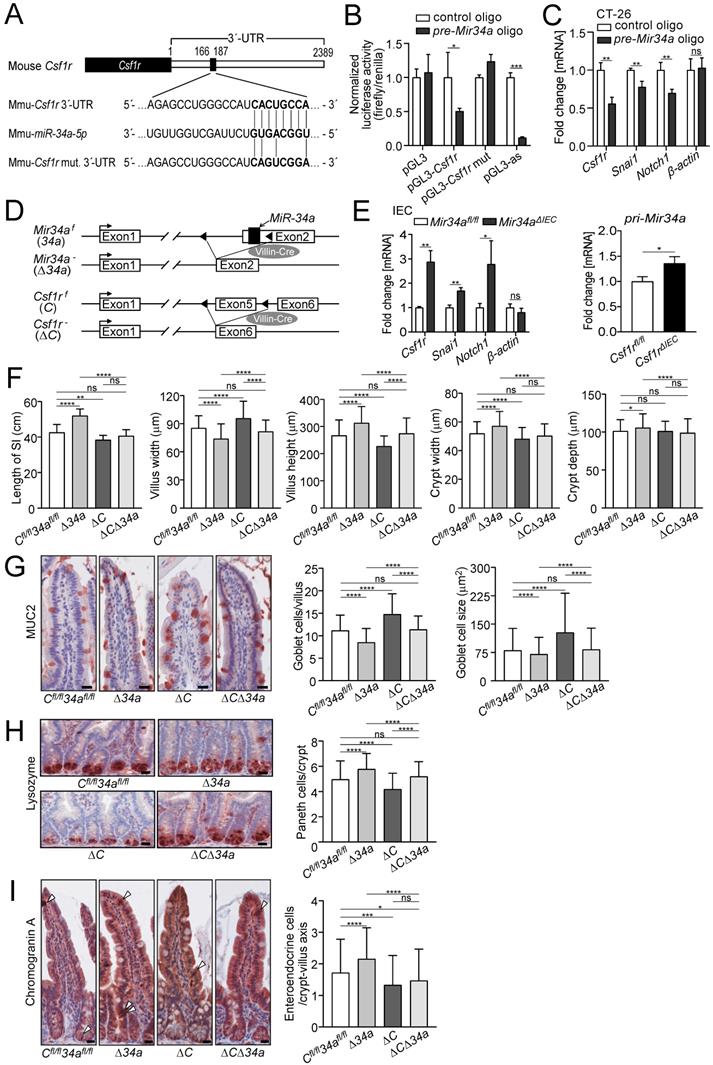
Next, we crossed mice harboring either Mir34a or Csf1r alleles flanked by two loxP sites with Villin-Cre mice (Fig. 1D). As a result, the respective alleles were inactivated in intestinal epithelial cells (IECs) from embryonic day 12.5 onwards. In IECs deficient for Mir34a, Csf1r expression, as well as expression of the known miR-34a targets Snai1 and Notch1, was up-regulated, whereas β-actin expression was not affected (Fig. 1E). In addition, pri-Mir34a expression was up-regulated in Csf1r-deficient IECs (Fig. 1E). Therefore, the reciprocal repression between miR-34a and CSF1R previously detected in CRC cell lines was confirmed on the organismal level.
Csf1r mediates effects of Mir34a loss on intestinal architecture and secretory cell homeostasis
In order to determine, whether inactivation of Mir34a affects intestinal tumor formation in a Csf1r-dependent manner, we generated ApcMin/+ mice with inactivation of Mir34a, Csf1r or of both genes in IECs. In Mir34a-deficient ApcMin/+ mice, we observed a significant increase in total length of the small intestine, and in the width and depth of crypts, as well as in the villus height, but a decrease in villus width of the small intestine (Fig. 1F). Deletion of Csf1r, except for depth of crypts, had the opposite effect on these parameters in ApcMin/+ mice. However, combined deletion of Mir34a and Csf1r had no significant effect on intestinal architecture when compared with the control group (Fig. 1F). The variations in the width of crypts presumably caused the differences in total length of the small intestine observed among the four genotypes. In addition, we evaluated goblet and Paneth cell numbers after immunohistochemical detection using specific markers as well as PAS staining (Fig. 1G and H, Supplementary Fig. S1A and B). A significant decrease in the number of goblet and an increase in Paneth cells was detected in Mir34a-deficient intestines. As reported previously [50], inactivation of Csf1r resulted in a decreased number of Paneth cells, while the number and size of goblet cells increased. In addition, the number of entero-endocrine cells was increased in Mir34a-deficient ApcMin/+ mice, but decreased in Csf1r-deficient ApcMin/+ mice (Fig. 1I). When both genes were deleted the effects on goblet, Paneth and entero-endocrine cells were neutralized.
Mir34a loss enhances intestinal tumorigenesis in a Csf1r-dependent manner
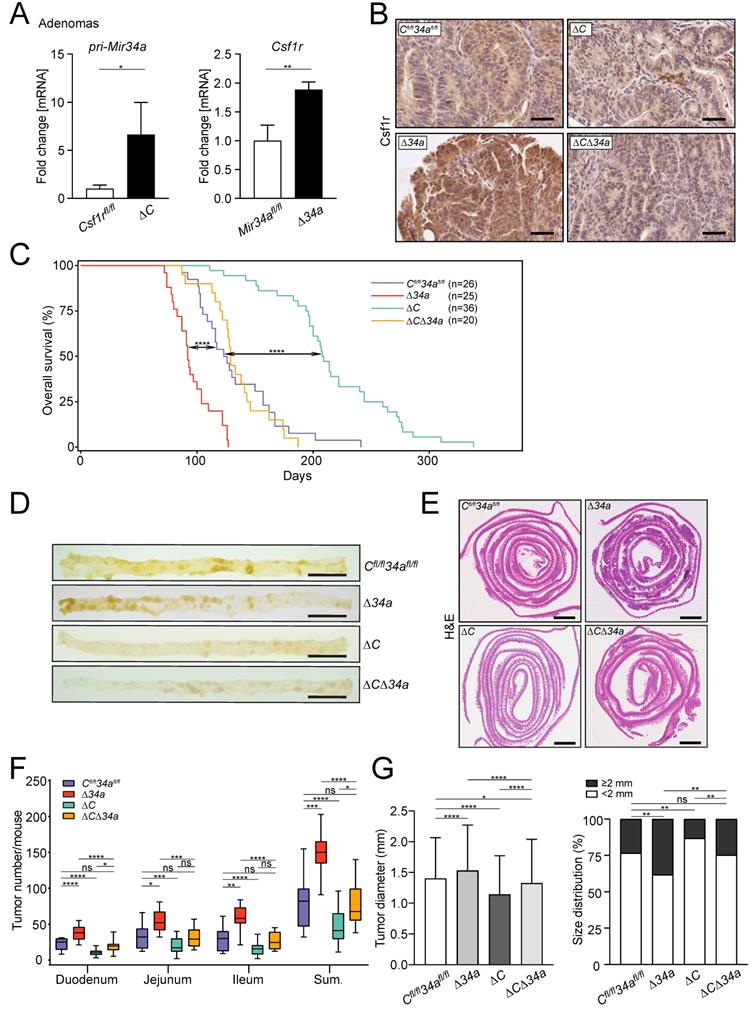
The expression of Csf1r was up-regulated in Mir34a-deficient adenomas and pri-Mir34a expression was increased in Csf1r-deficient adenomas on the mRNA and protein levels (Fig. 2A and B). Notably, IEC-specific deletion of Csf1r in ApcMin/+ mice resulted in a significantly longer life-span, while loss of Mir34a resulted in a shorter overall survival (Fig. 2C). In contrast, ApcMin/+ mice deficient for both Csf1r and Mir34a did not show a statistically significant change in survival when compared to Csf1rfl/fl;Mir34afl/fl;ApcMin/+ mice (Fig. 2C). When the entire small intestinal tract from 18 weeks old ApcMin/+ mice was examined, Csf1r-deficient ApcMin/+ mice showed a significantly reduced number of intestinal tumors, whereas Mir34a-deficient mice showed a dramatic increase in tumor numbers (Fig. 2D-F). Notably, ApcMin/+ mice with deletion of both Mir34a and Csf1r displayed similar frequencies of intestinal tumors as Csf1rfl/fl;Mir34afl/fl;ApcMin/+ mice. The size of adenomas was significantly larger in Mir34a-deficient and smaller in Csf1r-deficient ApcMin/+ mice when compared to Csf1rfl/fl;Mir34afl/fl;ApcMin/+ mice (Fig. 2G). Similarly, the frequency of large tumors (≥ 2 mm) was significantly higher in Mir34aΔIEC;ApcMin/+ mice, but lower in Csf1rΔIEC;ApcMin/+ mice. However, when Mir34a and Csf1r were inactivated concomitantly in IECs, the effects of single gene inactivations on tumor size and its distribution were largely neutralized (Fig. 2G). Furthermore, the deletion of Mir34a increased the number of tumors with high-grade dysplasia in ApcMin/+ mice, whereas deletion of Csf1r resulted in a lower percentage of tumors with high-grade dysplasia (Fig. 3A and B). However, concomitant deletion of both genes resulted in the compensation of both effects. Taken together, the effects of the single deletions of Mir34a and Csf1r were neutralized by simultaneous inactivation of both genes, implying that Mir34a and Csf1r functionally antagonize each other during intestinal tumor formation and progression. Therefore, Csf1r up-regulation caused by Mir34a deletion contributes to the increased number and size of intestinal adenomas observed in miR-34a-deficient mice, which ultimately determines the lifespan of these mice.
Effects of Mir34a and/or Csf1r deficiency on intestinal tumorigenesis in ApcMin/+ mice. A qPCR analysis of Csf1r and pri-Mir34a in adenomas of ApcMin/+ mice with the indicated genotypes. Results are presented as mean values ± SD (n ≥ 3). B IHC detection of Csf1r in intestinal adenomas in ApcMin/+ mice with the indicated genotypes. Scale bar: 50 μm. C Kaplan-Meier survival analysis of the ApcMin/+ mice with the indicated genotypes. Results were compared with a log-rank test. D Representative macroscopic images of polyps in resected small intestines in 18 weeks old ApcMin/+ mice with the indicated genotypes. Scale bar: 2 cm. E Representative “swiss-roll” sections of the small intestine of 18 weeks old ApcMin/+ mice by H&E staining. Scale bar: 2 mm. F Quantification of tumor numbers in the small intestine of 18 weeks old ApcMin/+ mice with the indicated genotypes. The box plot extends from the 25th to 75th percentiles. The line in the middle of the box indicates the median. The whiskers underneath or above the boxes range from min. to max. value, respectively (n ≥ 7 mice per genotype). G Quantification of tumor size and distribution in small intestine of 18 weeks old ApcMin/+ mice with the indicated genotypes (n ≥ 7 mice per genotype). In (A) results are presented as mean ± SD using the two-tailed unpaired Student's t test, in (G) results are presented as mean ± SD using Tukey's multiple comparisons test. *P < 0.05, **P < 0.01, ***P <0.001, or ****P < 0.0001.
Cellular effects of Mir34a and/or Csf1r deficiency in intestinal adenomas. A Representative images of low- and high-grade adenomas. Scale bar: 100 μm. B Quantification of tumor stage in adenomas from the small intestine in 18 weeks old ApcMin/+ mice with the indicated genotypes (n = 6 mice per genotype). C, D, E, IHC detection of Ki67 (C), cleaved-caspase-3 (D) and phospho-STAT3 (E) in adenomas from the small intestine in 18 weeks old ApcMin/+ mice with the indicated genotypes. (n ≥ 3 mice per genotype). Scale bar: 30 μm. In (B-E), results are presented as mean ± SD using Tukey's multiple comparisons test. *P < 0.05, **P < 0.01, ***P <0.001, or ****P < 0.0001.
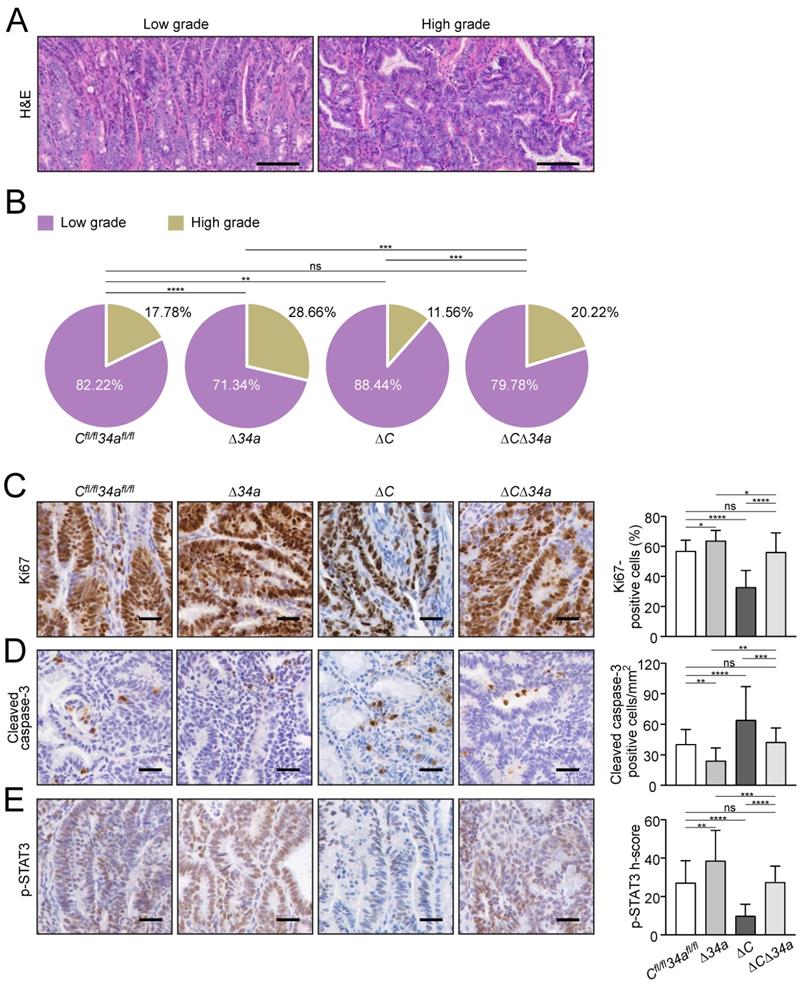
We hypothesized that the decreased tumor size observed after deletion of Csf1r in ApcMin/+ mice may be due to decreased tumor cell proliferation and increased apoptosis. Indeed, the proliferation-marker Ki67 was down-regulated and apoptosis was increased in adenomas of Csf1rΔIEC;ApcMin/+ mice (Fig. 3C and D).
On the contrary, proliferation was increased and apoptosis was decreased in Mir34a-deficient adenomas (Fig. 3C and D). When both deletions were combined, the rate of proliferation and apoptosis was similar as in adenomas of ApcMin/+ mice without deletion of these genes (Fig. 3C and D). Consistent with the finding that activation of CSF1R induces STAT3 phosphorylation (p-STAT3) in CRC cell lines [21], the frequency of cells displaying STAT3 activation was decreased in adenomas of Csf1rΔIEC;ApcMin/+ mice, whereas deletion of Mir34a increased the number of p-STAT3-positive tumor cells (Fig. 3E). ApcMin/+ mice with combined deletion Csf1r and Mir34a did not show a significant change in the frequency of p-STAT3-positive cells when compared to control ApcMin/+ mice.
Csf1r loss largely reversed the effects of Mir34a deletion on tumor microenvironment
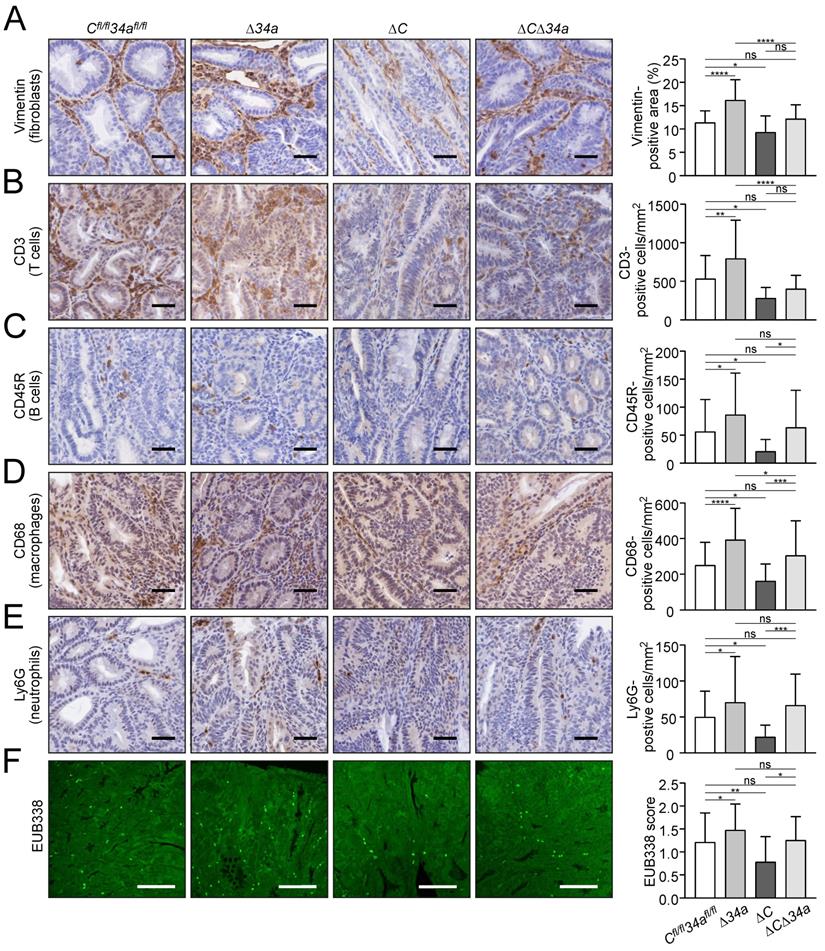
Tumor-associated fibroblasts were increased within adenomas in Mir34a-deficient adenomas, whereas deletion of Csf1r resulted in their decrease (Fig. 4A). Notably, concomitant Mir34a and Csf1r deletion resulted in unchanged numbers of fibroblasts within adenomas. Therefore, Csf1r is required for the recruitment of fibroblasts in Mir34a-deficient adenomas. Similarly, Mir34a inactivation resulted in a Csf1r-dependent increase in CD3-positive T-cells (Fig. 4B), CD45R-positive B-cells (Fig. 4C) and CD68-positive macrophages (Fig. 4D), as well as LY6G-positive neutrophils (Fig. 4E). Deletion of Csf1r decreased infiltration by these cell types (Fig. 4A-E). Furthermore, FISH with the universal eubacteria-specific probe (EUB338) revealed that Mir34a-deficient adenomas displayed more bacterial infiltration, whereas less bacterial infiltration was observed in Csf1r-deficient adenomas (Fig. 4F). The degree of bacterial infiltration was similar in adenomas with deletion of both genes when compared to control mice (Fig. 4F). Taken together, deletion of Csf1r largely reversed the effects of Mir34a loss on infiltration by fibroblasts, immune cells and bacteria in adenomas. Therefore, the up-regulation of Csf1r as a consequence of Mir34a inactivation in intestinal adenomas is an important mediator of tumor/stroma interactions, which may promote tumor initiation and progression.
Effects of Mir34a and/or Csf1R deficiency on infiltration by stromal cells and bacteria in ApcMin/+ adenomas. A, B, C, D, E IHC detection of fibroblast cells (A) by Vimentin and T cells (B), B cells (C), macrophages (D), neutrophils (E) by CD3, CD45R, CD68, Ly6G, respectively, in adenomas. (n ≥ 3 mice per genotype). Scale bar: 40 μm. F Quantification of bacterial infiltration using FISH of universal eubacteria probe (EUB338) in adenomas. (n ≥ 3 mice per genotype). Scale bar: 100 μm. In (A-F) results are presented as mean ± SD using Tukey's multiple comparisons test. *P < 0.05, **P < 0.01, ***P <0.001, or ****P < 0.0001.
Role of Csf1r in Mir34a-loss induced stemness and Wnt signaling
In order to assess effects on tumor cell stemness, we determined the expression of the stem cell marker Lgr5 in adenoma sections using in situ hybridization (ISH) (Fig. 5A). Lgr5-positive areas were increased in intestinal adenomas of Mir34aΔIEC;ApcMin/+ mice and decreased in adenomas of Csf1rΔIEC;ApcMin/+ mice. However, the combined inactivation of Mir34a and Csf1r neutralized these effects (Fig. 5A). In addition, a significant increase in the number of ISCs at the crypt base of Mir34aΔIEC;ApcMin/+ mice was determined by detection of the stem cell markers Olfm4 and Lgr5 by ISH, while Csf1rΔIEC;ApcMin/+ mice showed a decrease in ISCs (Fig. 5B and C). Combined deletion of both genes resulted in an ISC frequency similar to that observed in wild-type ApcMin/+ mice. Therefore, the enhanced frequency of stem cells observed in Mir34a-deficient adenomas and normal intestinal crypts, was dependent on the increased expression of Csf1r.
Effects of Mir34a and/or Csf1r deficiency on stemness, β-catenin localization and tumoroid formation/proliferation. A Quantification of Lgr5-positive area in ≥ 40 intestinal adenomas per group. (n= 4 mice per genotype). Scale bar: 140 μm. B, C in situ hybridization detection of Lgr5-positive cells (B) and Olfm4-positive cells (C) at the crypt base of 18 weeks old ApcMin/+ mice with the indicated genotypes. At least 40 crypts per mouse (n ≥ 3 mice per genotype) were counted. Scale bar: 40 μm. D Quantification of β-catenin/Ctnnb1 nuclear positive cells in ≥ 180 normal crypts per group (n= 3 mice per genotype). Scale bar: 15 μm. E Tumoroid formation assay of adenomas (three tumors per mouse) derived from ApcMin/+ mice with the indicated genotypes (n = 3 mice per genotype). Scale bar: 400 μm. F Quantification of EdU labeling of proliferating cells in 20 tumoroids derived from adenomas per group (n = 3 mice per genotype), relative ratio was normalized to the corresponding control. Scale bar: 40 μm. In (A-F) results are presented as mean ± SD using Tukey's multiple comparisons test. *P < 0.05, **P < 0.01, ***P <0.001, or ****P < 0.0001.
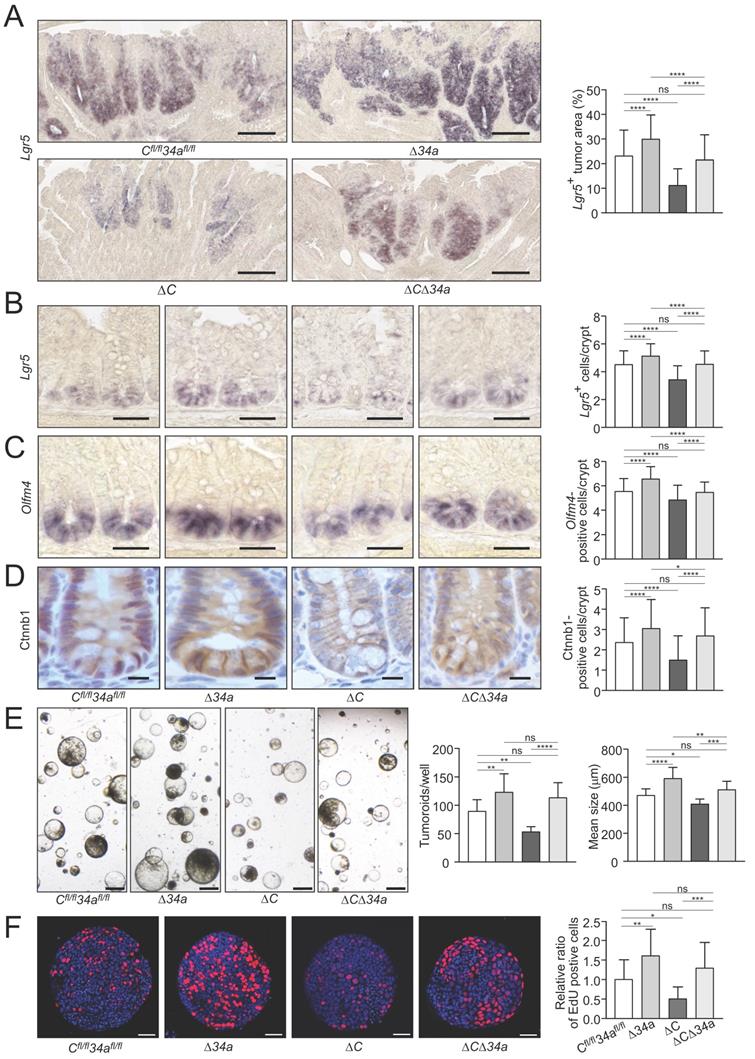
We had previously observed that miR-34a/b/c-deletion in combination of hemizygous APC inactivation promotes nuclear accumulation of β-catenin [18]. In order to assess the effect of the introduced deletions on Wnt signaling the β-catenin localization in the untransformed crypts of the ApcMin/+ mice with deletions of Mir34a or/and Csf1r was determined (Fig. 5D). As expected, an increased nuclear accumulation of β-catenin protein in cells at the crypt bases was observed after Mir34a deletion in ApcMin/+ mice. Interestingly, deletion of Csf1r decreased the number of cells with nuclear β-catenin at the crypt base and concomitant deletion of Mir34a and Csf1r resulted in similar numbers of cells with nuclear β-catenin as observed in the controls. Therefore, loss of Mir34a contributes to β-catenin activation in a Csf1r-dependent manner.
In order to obtain functional evidence for Mir34a/Csf1r mediated regulation of stemness in adenomas, we performed a tumoroid formation assay (Fig. 5E). Indeed, tumoroids derived from Mir34a-deficient adenomas displayed an increase in formation rate and mean size, whereas tumoroids derived from Csf1r-deficient adenomas formed at a decreased rate and were smaller.
When both genes were deleted concomitantly, tumoroids were similar in number and size to Mir34a/Csf1r- proficient tumoroids. Mir-34a-deficient tumoroids exhibited the highest frequency of actively proliferating cells as evidenced by EdU labeling (Fig. 5F, Supplementary Fig. S2), whereas Csf1r-deficient tumoroids showed the lowest rate of proliferation. The combined deletion of both genes nullified the effects of single gene deletions, implying that Csf1r is an important mediator of the increased proliferation resulting from Mir-34a inactivation. These effects on proliferation presumably explain the observed differences in tumoroid number and size among the genotypes.
Expression profiling of Mir34a- and/or Csf1r-deficient adenomas and tumoroids
Next, we determined the mRNA expression profiles of Mir34aΔIEC, Csf1rΔIEC and Mir34aΔIEC;Csf1rΔIEC adenomas and compared them to Mir34afl/fl;Csf1rfl/fl adenomas from 18-weeks old in ApcMin/+ mice. For each genotype, 3 libraries were generated from RNA isolated from adenomas of 3 mice (3 adenomas from each mouse were pooled) and subjected to RNA-Seq analysis with more than 30 million reads per library. Principal component analysis (PCA) showed that adenomas of Mir34aΔIEC and Csf1rΔIEC mice were indeed characterized by distinct transcriptomes, while the gene expression pattern in Mir34aΔIEC;Csf1rΔIEC adenomas was more similar to Mir34afl/fl;Csf1rfl/fl adenomas (Fig. 6A). Differential gene expression analyses using DESeq2 showed that in adenomas from Mir34a-deficient mice, 301 genes were significantly up- and 127 genes were down-regulated when compared to adenomas from control mice (Fig. 6B, Supplementary Table S10). In Csf1r-deficient adenomas, rather moderate changes in gene expression with 28 significantly up- and 26 significantly down-regulated genes were observed when compared to adenomas from control mice (Fig. 6B, Supplementary Table S11). However, in adenomas from Csf1r/Mir34a-deficient mice ApcMin/+ mice only 15 genes were significantly up- and 17 genes were down-regulated, indicating that the gene expression changes observed in Mir34a-deficient adenomas were largely abrogated by the concomitant deletion of Csf1r (Fig. 6B, Supplementary Table S12). In addition, we performed NGS analyses of tumoroids derived from Mir34a- and/or Csf1r-deficient adenomas in order to identify cell autonomous changes in gene expression, which are not potentially confounded by interactions of tumor cells with the tumor-microenvironment, as in the adenomas. PCA showed that tumoroids of the respective genotypes were characterized by distinct transcriptomes (Fig. 6C). Differential gene expression analyses showed that in tumoroids from Mir34a-deficient mice, 232 genes were significantly up- and 202 genes were down-regulated (Fig. 6D, Supplementary Table S13). In tumoroids derived from Csf1r-deficient and Csf1r/Mir34a-deficient adenomas, moderate transcriptome changes with lower numbers of differentially regulated genes were observed (Fig. 6D, Supplementary Table S14 and Supplementary Table S15).
Expression profiling of Mir34a- and/or Csf1r-deficient intestinal adenomas and tumoroids from ApcMin/+ mice. A Principal component analysis (PCA) of RNA expression in adenomas from mice with the indicated genotypes. B MA-plots showing differential RNA expression (FDR q-value <0.05) between adenomas with the indicated genotypes from ApcMin/+ mice. Significantly up- and down-regulated RNAs are highlighted as indicated. Non-significantly regulated genes are shown in gray. The numbers of differentially regulated RNAs are indicated. C Principal component analysis (PCA) of RNA expression in tumoroids derived from adenomas from mice with the indicated genotypes. D MA-plots showing differential RNA expression (FDR q-value <0.05) between tumoroids derived from adenomas of the respective loss-of-function mice and from ApcMin/+ mice. Significantly up- and down-regulated RNAs are highlighted as indicated. Non-significantly regulated genes are shown in gray. The numbers of differentially regulated RNAs are indicated. E Venn diagram showing overlap between RNAs differentially up-regulated in Mir34aΔIEC;ApcMin/+ adenomas or tumoroids. The numbers of differentially regulated RNAs are indicated. Statistical significance was determined by Fisher´s exact test. F Dot plot representation of Gene Set Enrichment Analyses (GSEA) of the indicated functional categories obtained from pair-wise comparisons of Mir34aΔIEC;ApcMin/+, Csf1rΔIEC;ApcMin/+, or Mir34aΔIEC;Csf1rΔIEC;ApcMin/+ with Mir34afl/fl;Csf1rfl/fl;ApcMin/+ adenomas and tumoroids. The significance of enrichments is presented by normalized enrichment scores (NES) and false discovery rate-adjusted q values.
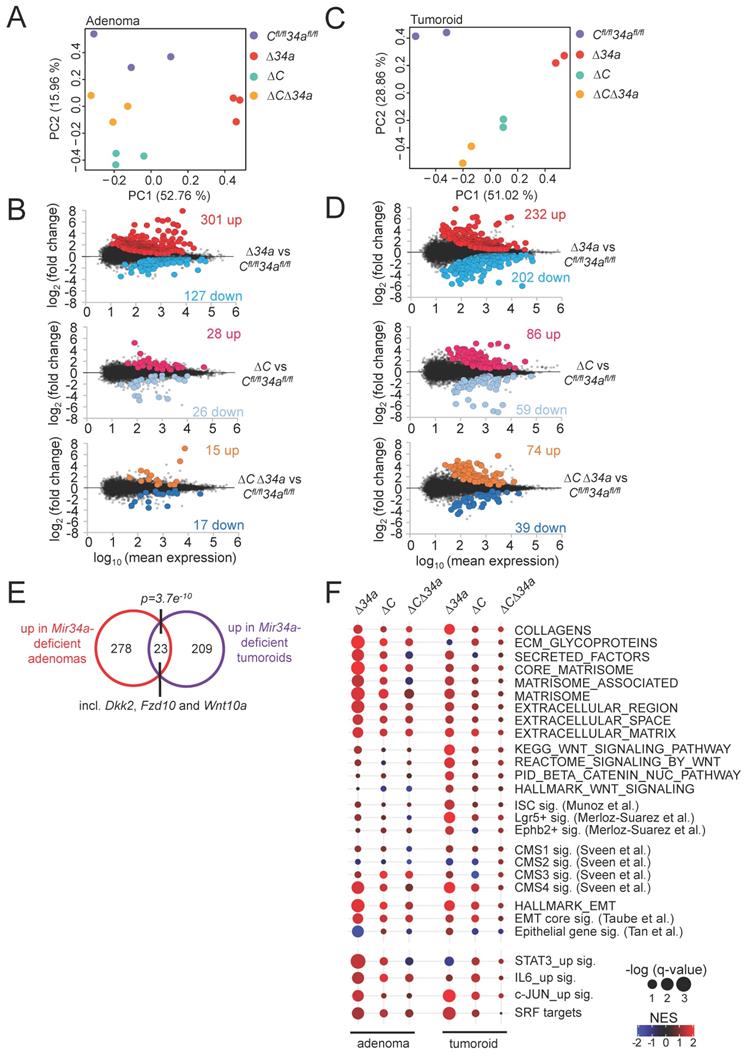
Interestingly, the overlap between mRNAs up-regulated in Mir34a-deficient adenomas and tumoroids, though limited, was statistically highly significant, and among the 23 mRNAs significantly up-regulated in both Mir34a-deficient adenomas and tumoroids were three factors involved in Wnt signaling (Dkk2, Fzd10 and Wnt10a) (Fig. 6E), suggesting that the tumor cell-autonomous repression of Wnt signaling by miR-34a may be a critical mechanism of miR-34a mediated tumor suppression, as reported previously [51, 52]. However, the divergent effects of Mir34a-deficiency in adenomas and in tumoroids may in part be due to interactions between Mir34a-deficient tumor cells in the adenomas and cells within the tumor microenvironment, such as infiltrating macrophages, which do not occur in tumoroids. In addition, tumoroids are cultured in an artificial matrix, which may not fully represent the in vivo environment of tumor cells in adenomas [53], and therefore influence gene expression.
Next we used Gene Set Enrichment Analyses (GSEA) to identify pathways that are differentially regulated in adenomas and tumoroids dependent on their Mir34a and Csf1r status (Fig. 6F). For this, we focused on processes relevant for tumor progression that are known to be suppressed by miR-34a, such as epithelial-mesenchymal transition (EMT), stemness, and Wnt signaling (Fig. 6F). In Mir34a-deficient adenomas, EMT-associated genes were strongly up-regulated. Moreover, extracellular matrix (ECM)-related factors, as well as Consensus Molecular Subtype (CMS) 4-associated genes indicative of mesenchymal tumors [54] were up-regulated (Fig. 6F). In Mir34a-deficient tumoroids, gene signatures characteristic for ISCs, Wnt signaling, and, to a lesser extent, EMT and ECM-related gene signatures were up-regulated (Fig. 6F). Remarkably, the up-regulation of factors involved in EMT, stemness, Wnt signaling and extracellular matrix components in Mir34a-deficient adenomas and/or tumoroids was largely abrogated by co-deletion of Csf1r (Fig. 6F). Deletion of Csf1r alone had a very limited effect on the analyzed gene signatures. Taken together, these results imply that the up-regulation of Csf1r expression in Mir34a-deficient tumors represents a central mediator of the effects of Mir34a loss on gene expression in intestinal adenomas and/or tumoroids.
Analysis of Mir34a target expression
Next, we analyzed which Mir34a targets were significantly up-regulated in either Mir34a-deficient adenomas and/or tumoroids. For the identification of up-regulated Mir34a targets, we employed the miRNA target prediction tools TargetScanMouse 7.1 and the mirWalk2.0 (mouse) archive.
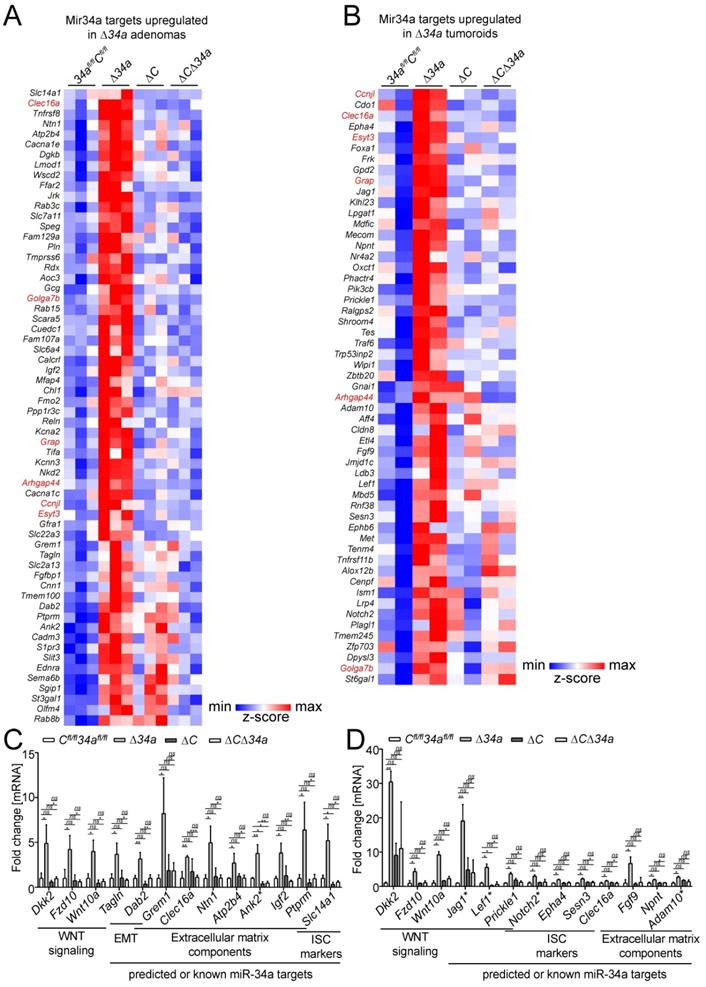
In Mir34a-deficient adenomas, we identified a set of 62 significantly up-regulated mRNAs with Mir34a seed-matching sites in their 3'-UTR (Fig. 7A). In addition, we identified a set of 58 mRNAs with miR-34a seed-matching sites that were up-regulated in tumoroids derived from Mir34a-deficient adenomas (Fig. 7B). Among these were mRNAs, which encode factors relevant for the effects of Mir34a deletion described above, such as Jag1, Kitl, Lef1, OLFM4, Met and Notch2. Six predicted Mir34a targets (Arhgap44, Ccnjl, Clec16a, Esyt3, Golga7b, Grap) were up-regulated in both Mir34a-deficient adenomas and tumoroids (Fig. 7A and B). Remarkably, the up-regulation of predicted Mir34a targets in Mir34a-deficient adenomas was largely abrogated by co-deletion of Csf1r (Fig. 7A). In Csf1r/Mir34a-deficient tumoroids, up-regulation of the majority of predicted Mir34a targets was strongly reduced, and only a subset of predicted Mir34a targets was still up-regulated when compared to Csf1rfl/fl; Mir34afl/fl tumoroids (Fig. 7B). RNA-Seq results were confirmed by qPCR analysis of selected RNAs up-regulated in Mir34a-deficient adenomas and/or tumoroids (Fig. 7C and D).
Identification of Mir34a mRNA targets in Mir34a- and/or Csf1r-deficient intestinal adenomas and tumoroids from ApcMin/+ mice. Heat-map of RNA expression of predicted Mir34a targets in A, adenomas or B, tumoroids with the indicated genotypes from ApcMin/+ mice. RNAs with upregulation in Δ34a vs 34afl/fl;Cfl/fl (FDR<0.05) are shown. RNAs up-regulated both in Δ34a adenomas and tumoroids are indicated in red. C, D Validation of the exemplary Mir34a target genes differently regulated in adenomas (C) or tumoroids (D) with the indicated genotypes by qPCR. Published miR-34a target are labeled with an asterisk (*). In (C, D), results are represented as mean ± SD, and data was subjected to an unpaired, two-tailed Student's t-test with p-values * < 0.05, ** < 0.01, *** < 0.001, ns: not significant.
In order to understand the effect of co-deletion of Csf1r on Mir34a loss induced changes in gene expression, we analyzed if genes up-regulated after inactivation of Mir34a are potentially subject to opposing regulation by Mir34a and Csf1r signaling. Activation of Csf1r is known to induce several signaling pathways, such as the JAK-STAT, MAPK and Rho-actin cascades [55], which ultimately result in the activation of several downstream transcription factors (TFs), such as STAT3, AP1 (JUN:FOS) and SRF [56-59]. Therefore, we analyzed whether expression signatures comprising RNAs commonly up-regulated after induction of these TFs were associated with loss of Mir34a in adenomas and/or tumoroids. Indeed, GSEA showed that loss of Mir34a in adenomas, and to a lesser extent in tumoroids, was associated with the induction of STAT3, JUN and SRF expression signatures. Furthermore, loss of Mir34a in adenomas was associated with the induction of RNAs commonly up-regulated after IL6 treatment, which includes STAT3 activation (Fig. 6F). Remarkably, this effect was largely abrogated by co-deletion of Csf1r (Fig. 6F).
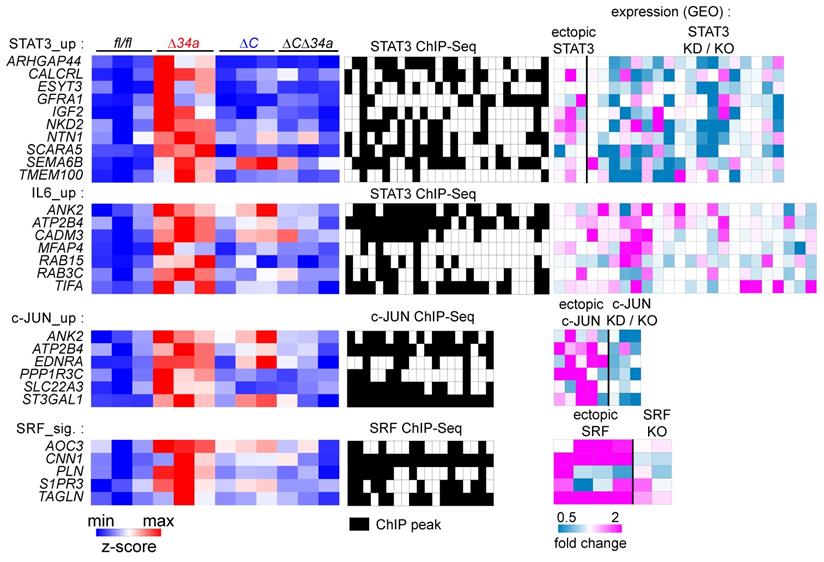
In order to further characterize how concomitant deletion of Csf1r affects transcriptome changes induced by loss of Mir34a in adenomas, we determined which Mir34a targets may be coordinately regulated by both Mir34a and STAT3, AP1 (JUN:FOS) and SRF (Fig. 8) in a coherent feed-forward manner (hereafter referred to as “Mir34a/TF targets”). Thereby, we identified 26 predicted Mir34a targets that are presumably directly regulated by either STAT3, JUN or SRF, as evidenced by analysis of previously published ChIP-Seq and RNA expression datasets (Fig. 8). Of note, only two (Ank2, Gfra1) of the identified targets have been characterized as direct miR-34a targets previously [60, 61]. Next, two of these targets, Ntn1/Netrin and Tagln/Transgelin were selected for further analysis (Supplementary Fig. S3 and Supplementary Fig. S4): Ntn1 is known to mediate survival signals that contribute to tumorigenesis [62-64]. Tagln may exert oncogenic functions by regulation of multiple tumor-relevant processes, such as EMT, invasion and metastasis [65, 66]. The 3'-UTR of murine Ntn1 contains three Mir34a SMSs (Supplementary Fig. S3A). Ectopic pre-Mir34a significantly repressed a murine Ntn1 3'-UTR reporters and mutations of the 3 SMS abrogated their repression by ectopic Mir34a (Supplementary Fig. S3B). In addition, Ntn1 mRNA and protein expression was significantly repressed by ectopic Mir34a in the murine CRC cell line CT26 (Supplementary Fig. S3C). Similar results were obtained for Tagln (Supplementary Fig. S3D-F). Interestingly, the 3'-UTR of the human NTN1 and TAGLN mRNA also harbors a miR-34a seed-matching site (Supplementary Fig. S4A and D). Human NTN1 and TAGLN 3'-UTR-reporters were significantly repressed after co-transfection of pre-miR-34a in an SMS-dependent manner (Supplementary Fig. S4B and E). Furthermore, ectopic expression of pri-miR-34a significantly decreased NTN1 and TAGLN mRNA and protein expression levels in the human CRC cell line SW480 (Supplementary Fig. S4C and F). Taken together, these results show that Ntn1 and Tagln are conserved and direct targets of miR-34a.
Characterization of coordinated regulation of Mir34a target mRNA expression by Mir34a and the transcription factors STAT3, AP1 (JUN:FOS) and SRF. Left: Heat-maps showing the expression of indicated genes in adenomas from Mir34afl/fl;Csf1rfl/fl;ApcMin/+, Mir34aΔIEC;ApcMin/+, Csf1rΔIEC;ApcMin/+, or Mir34aΔIEC;Csf1rΔIEC;ApcMin/+ mice. Middle: Heatmaps showing promoter occupancy by STAT3, c-JUN, or SRF according to GEO ChIP-seq datasets. Right: Heat-maps showing the fold change in expression of the indicated mRNAs in GEO datasets after STAT3 ectopic expression or knockdown (KD)/knockout (KO), IL6 treatment, and c-JUN or SRF ectopic expression or knockdown (KD)/knockout (KO). GEO data are shown from left to right in the order of the underlying datasets listed in Supplementary Table S6-9.
Clinical associations of Mir34a-related expression signatures
Next, we determined whether the expression signatures we identified in Mir34aΔIEC, Csf1rΔIEC and Mir34aΔIEC;Csf1rΔIEC adenomas are associated with clinical parameters, such as patient survival and tumor stage, in two independent CRC patient cohorts (TCGA-COAD and GSE39582). Interestingly, in primary CRCs the Mir34aΔIEC signature was associated with poor relapse free survival in both patient cohorts (Fig. 9A). Moreover, a pooled patient cohort comprising 946 patients from both patient cohorts recapitulated these findings with increased statistical significance (Fig. 9 B). Conversely, the Csf1rΔIEC signature was associated with improved relapse free survival (Fig. 9A). The Mir34aΔIEC;Csf1rΔIEC expression signature was not associated with a significant difference in relapse free survival (Fig. 9A). Moreover, the Mir34aΔIEC signature was elevated in advanced tumor stages, whereas the Csf1rΔIEC and Mir34aΔIEC;Csf1rΔIEC expression signatures were elevated in less advanced tumor stages (Fig. 9C).
Clinical associations of Mir34a-related expression signatures. A Forest plots showing hazard ratios for relapse free survival by comparing patients with high versus low expression of the Δ34a, ΔC and Δ34aΔC expression signatures in the TCGA and GSE39582 patient cohorts, and the pooled cohort comprising both individual cohorts. Dots represent Hazard ratios and horizontal lines show 95% CI. P-values were calculated using the log-rank method. B Kaplan-Meier analysis of relapse free survival for patients with high or low expression of the Δ34a expression signature using the pooled dataset of the TCGA and GSE39582 patient cohorts (n = 946 patients). The significance was calculated with the log-rank test and the x-axis represents relapse free survival in months. Below the graph the numbers of patients at risk with high or low expression of the Δ34a expression signature at the respective time point is provided. C Heat-map showing the expression of the Δ34a, ΔC and Δ34aΔC expression signatures in the indicated tumor stages using the pooled dataset of the TCGA and GSE39582 patient cohorts. The p-values for linear trend in expression from stage 1 to stage 4 are provided. D Gene Set Enrichment Analysis (GSEA) of the indicated functional categories showing their association with the Δ34a signature, mature miR-34a expression and Csf1r expression in tumors using the pooled dataset of the TCGA and GSE39582 patient cohorts (tumors) and cancer cell lines (CCLE). The significance of enrichments is presented by normalized enrichment scores (NES) and false discovery rate-adjusted q values.
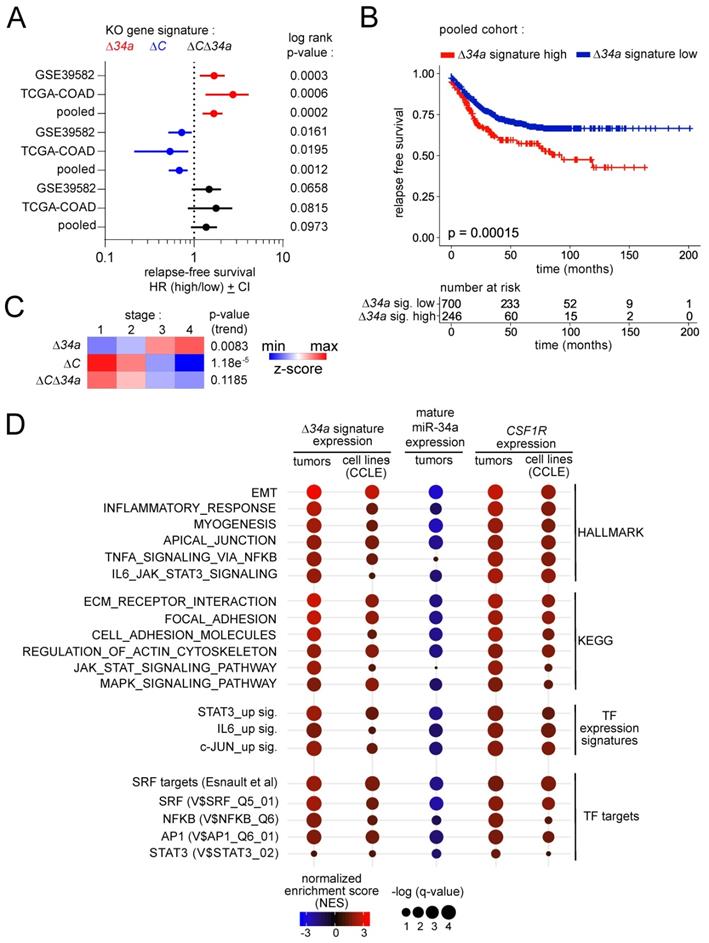
Next, we analyzed whether the Mir34aΔIEC adenoma signature, mature miR-34a expression and CSF1R expression is associated with HALLMARK, KEGG, as well as TF expression and TF target signatures in human CR tumors or CRC cell lines (Fig. 9D). In human CRCs, the Mir34aΔIEC adenoma gene signature was associated with EMT, inflammation and actin cytoskeleton signatures, as well as with the TNFα/NFKB, IL6/STAT3 and MAPK signaling pathways. Moreover, it was associated with STAT3 and JUN expression signatures. Remarkably, several SRF, AP1 and NFKB target signatures were strongly associated with the Mir34aΔIEC adenoma signature. Moreover, these associations could also be found in CRC cell lines, which strongly suggests tumor cell intrinsic regulations. Conversely, expression of mature miR-34a displayed a strong negative correlation with the large majority of the analyzed gene signatures. Furthermore, CSF1R expression positively correlated with the majority of the analyzed gene signatures, which largely reflected the associations found for the Mir34aΔIEC adenoma signature. These findings indicate that loss of miR-34a, and the resulting elevated expression of CSF1R in human CRCs is also associated with the signaling pathways and TF expression signatures identified in Mir34a-deficient, murine adenomas in this study.
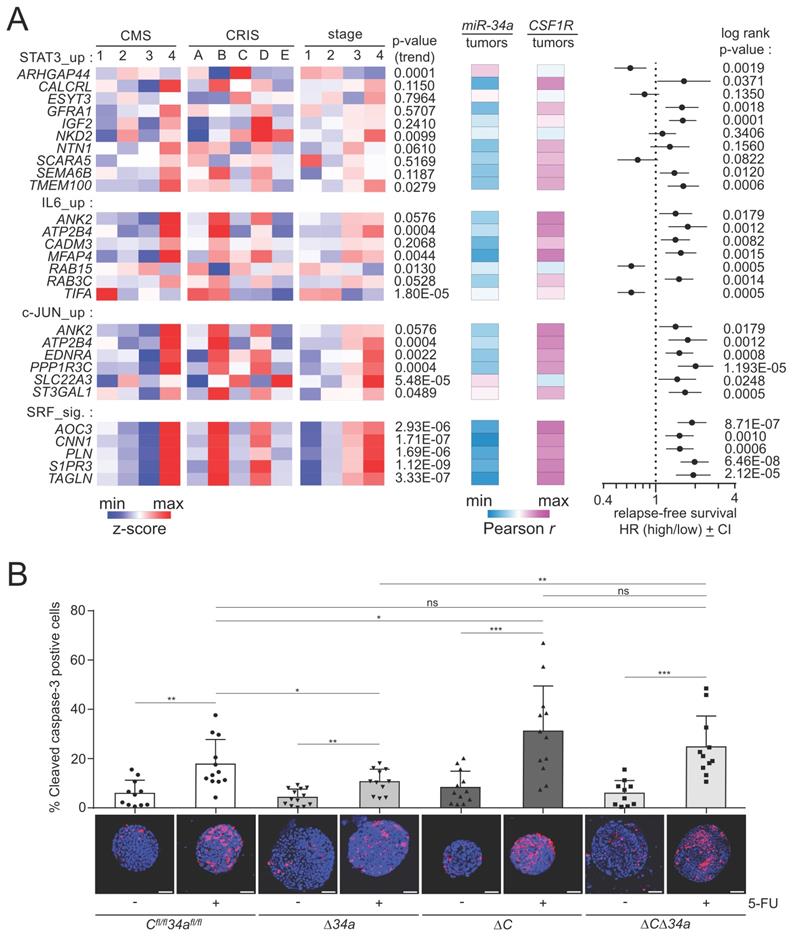
Next, we analyzed whether elevated expression of the “Mir34a/TF” targets (Fig. 8) is associated with molecular subtypes and stages of CRC, or CRC patient survival (Fig. 10A). Remarkably, the majority of the Mir34a/TF targets showed elevated expression in CMS4 tumors. Moreover, numerous targets showed elevated expression in CRIS-B and -D subtypes. The CMS4, CRISB and CRISD molecular subtypes display mesenchymal and WNT-associated expression signatures, respectively [47, 54]. Furthermore, the majority of Mir34a targets displayed elevated expression in the advanced tumor stages 3 and 4. While this pattern was less evident for STAT3 target genes, it was found for the majority of direct JUN and SRF targets. Strikingly, the large majority of the Mir34a/TF targets displayed a negative correlation with mature miR-34a expression, as well as a positive correlation with CSF1R expression in human CRCs (Fig. 10A), suggesting that the proposed feed-forward regulation of these genes is conserved between murine and human cells. Moreover, elevated expression of the majority of “Mir34a/TF” target mRNAs was significantly associated with poor relapse free survival of CRC patients (Fig. 10A).
Associations of miR-34a target mRNA expression with clinico-pathological parameters and effects of Mir34a/Csf1r loss on the response to 5-FU. A Left: Heat-maps showing the expression of indicated mRNAs in CMS and CRIS molecular subtypes and tumor stages. The p-values for linear trend in expression from stage 1 to stage 4 are indicated. Middle: Heat-maps showing the expression correlation between the indicated mRNAs and mature miR-34a and CSF1R. Right: Forest plot showing hazard ratios for relapse free survival by comparing patients with high versus low expression of the indicated mRNAs. Dots represent hazard ratios and horizontal lines show 95% CI. P-values were calculated using the log-rank method. B Tumoroids were cultured for 3 days and then treated with or without 5-FU (25 µg/ml) for 48 hours. ≥ 10 tumoroids from 3 mice per group are analyzed. Scale bar: 50 μm. Results are presented as mean ± SD using a two-tailed unpaired Student's t test. *P < 0.05, **P < 0.01, ***P <0.001, or ****P < 0.0001.
Mir34a and Csf1r influence therapeutic responses in tumoroids
We have previously reported a role of the miR-34/CSF1R/STAT3 axis in the response to 5-Fluorouracil (5-FU) in human CRC cell lines ex vivo [21]. Therefore, we asked whether the genetic inactivation of Mir34a and/or Csf1r would modulate the response to 5-FU in tumoroids (Fig. 10B). Interestingly, we found that Mir34a-deficient tumoroids showed less apoptosis in response to 5-FU, while Csf1r-deficient tumoroids displayed more apoptosis in response to 5-FU. When both genes were deleted the response to 5-FU was not significantly different from tumoroids with intact Mir34a and Csf1r genes (Fig. 10B). Since the effects of deleting Mir34a and Csf1r abrogated the effect of single gene deletions, these results showed that Csf1r is an important mediator of the 5-FU-resistance caused by Mir34a inactivation.
Discussion
Here, we determined a tumor suppressive role for Mir34a, whereas Csf1r displayed a tumor-promoting function in intestinal epithelial cells. The combined deletion of Mir34a and Csf1r demonstrated that activation of Csf1r is required for the effects of Mir34a loss during intestinal tumorigenesis. Therefore, the up-regulation of Csf1r expression that results from the inactivation of Mir34a is an important mediator of the pro-tumorigenic effects of Mir34a inactivation in mice and presumably also in human CRC. We had previously identified CSF1R as a direct target of miR-34a in human CRC cells, and characterized a CSF1R-STAT3-miR-34a feedback regulation [21]. Here we confirmed that Csf1r also represents a direct target of Mir34a in mice. Furthermore, we provide genetic evidence that this regulation occurs in vivo, since Mir-34a and Csf1r displayed reciprocal repression in murine intestinal epithelium and derived adenomas.
In this study, we show that the absence of miR-34a in IECs results in changes of the cellular composition of the small intestine, i.e. an increase of Paneth cells and Olfm4-positive stem cells, and an increased tumor burden as well as decreased survival in ApcMin/+ mice. In addition, we detected an increase in entero-endocrine cells in Mir34aΔIEC;ApcMin/+ mice. Entero-endocrine cells control microbial and intestinal homeostasis via innate immune signaling [67].
So far, the role of Csf1r has not been studied in mouse models of intestinal tumorigenesis. In this study, ApcMin/+ mice with IEC-specific deletion of Csf1r via Villin-Cre were established and analyzed. Notably, less and smaller adenomas as well as a prolonged survival time were observed in Csf1rΔIEC;ApcMin/+ mice. Besides the modulation of the SI architecture and changes in the number of secretory cells, a decrease in the frequency of intestinal stem cells as well as a decrease in the Lgr5-positive tumor area was detected in ApcMin/+ mice with IECs-specific deletion of Csf1r. Furthermore, the number and mean size of tumoroids that could be derived from Csf1r-deficient adenomas was decreased. Our results imply that Csf1r critically contributes to tumor formation caused by loss of Apc in intestinal epithelial cells.
Here, we observed that the phenotypes of ApcMin/+ mice with a combined deletion of Csf1r and Mir34a were similar as that of ApcMin/+ mice, indicating that the effects of Mir34a deletion on intestinal tumorigenesis are mediated, at least in part, by the up-regulation of Csf1r expression. It should however be mentioned that the deletion of Csf1r studied here could have a dominant effect in the context of Mir34a inactivation which is not identical to reverting the elevation of Csf1r expression caused by Mir34a loss. To formally proof that Mir34a suppresses tumorigenesis by down-regulation of Csf1r expression a deletion of the SMS for Mir34a in the 3'-UTR of Csf1r should be generated and studied similarly in the future.
Apart from the opposing effects of Mir34a and Csf1r on proliferation, apoptosis and STAT3 signaling, their antagonistic effects on the tumor-environment and intestinal cancer stem cells might also be responsible for the compensatory effect of deleting both genes. Here, Mir34a inactivation resulted in a Csf1r-dependent increase in tumor-associated fibroblasts, macrophages, neutrophils, T- and B-cells. Therefore, the up-regulation of Csf1r presumably mediated the effects of Mir34a loss on the tumor microenvironment.
In this study, we showed that Csf1r is an important mediator of the effects of Mir34a loss on stemness and Wnt signaling. Intestinal stem cells are thought to represent the tumor initiating cells during intestinal tumorigenesis [68], and multiple signaling pathways, including Wnt/β-catenin pathways, regulate the cell-cell and cell-matrix interactions in the intestinal stem cell niche [69, 70]. Interestingly, Lgr5, which was up-regulated in Mir34a-deficient adenomas and down-regulated in Csf1r-deficient adenomas, is not only a stem cell marker, but also potentiates Wnt/β-catenin signaling [71]. In addition, our expression analyses showed that, among potential Mir34a targets, genes associated with the induction of STAT3, JUN and SRF expression signatures are presumably involved in the opposing regulation of intestinal homeostasis and tumor formation by Mir34a and Csf1r signaling. In this study, we identified and characterized Ntn1/Netrin-1 and Transgelin/Tagln as direct targets of miR-34a in both murine and human cells. Ntn1/Netrin-1 and Transgelin/Tagln are coordinately regulated by both, miR-34a and the CSF1R-induced JAK-STAT, MAPK and Rho-actin signaling pathways. In addition, we also showed Mir34a-deletion-associated expression signatures correlate with clinico-pathological features of primary CRC and poor patient survival. Furthermore, inactivation of Mir34a and/or Csf1r modulated the cellular response to 5-FU in tumoroids, suggesting a role the miR-34a/CSF1R axis in resistance to 5-FU and warranting further studies on their potential role in chemo-resistance.
Netrin-1 exerts its functions through interaction with its receptors, including deleted in colorectal cancer (DCC) [72]. Notably, DCC, is localized on chromosome 18q, where frequent deletions are observed in CRC [73], and is down-regulated in more than half of CRCs [74]. Contrary to the effect of Netrin-1, DCC acts as an inhibitor of cell invasion, tumor growth and metastasis [75], and limits the progression of intestinal tumors in mouse models [76]. DCC regulates apoptosis as a dependency receptor [77]: it suppresses cell apoptosis when engaged by Netrin-1, while it triggers apoptosis in the absence of Netrin-1. Therefore, DCC represents a conditional tumor suppressor. Furthermore, Netrin-1 regulates cancer cell motility and tumorigenesis via multiple pathways, including YAP signaling [78], ERK/MAPK signaling [79, 80] and Notch signaling [81]. Therefore, the down-regulation of Netrin-1 by miR-34a may inhibit multiple pro-tumorigenic pathways in CRC.
Transgelin, belongs to a family of actin-binding proteins (ABPs) and may represent a promising target for treating multiple cancers [66, 82], including CRC [83]. High expression of transgelin is associated with tumor progression and poor prognosis for CRC patients [65, 84]. Transgelin is involved in remodeling of the actin cytoskeleton and promoting cell motility [85]. Enhanced expression of transgelin promotes tumor cell proliferation, migration, growth and EMT [65, 86, 87]. In addition, transgelin promotes the progression and metastasis of CRC through a series of complex signaling pathways, including Rho [88], AKT and JNK [89], and TGFβ signaling pathways [65, 90]. Repression of transgelin may therefore mediate tumor suppressive effects of miR-34a in CRC.
In conclusion, our results show that deregulation of the Mir34a/Csf1r double-negative feedback loop plays an important role during intestinal tumorigenesis. Our findings suggest that it may be beneficial to suppress CSF1R activity to obtain a therapeutic effect in CRCs that display inactivation of miR-34a and therefore activation of the CSF1R pathway. Notably, 75% of CRCs were shown to display epigenetic silencing of miR-34a [12]. Furthermore, restauration of miR-34a function by mimics and concomitant inhibition of CSF1R by small drugs may represent a feasible approach to treat CRC in the future.
Supplementary Material
Supplementary figures and tables.
Acknowledgements
We thank Ursula Götz for assistance and Markus Winter for technical advice. We are also grateful to Dr. Marlon Schneider for providing ApcMin/+ mice and Dr. Hans Clevers for the Olfm4 plasmid. This study was supported by grants to HH from the Wilhelm-Sander-Stiftung (2013.108.1) and the Rudolf-Bartling-Stiftung. Fangteng Liu is a recipient of a China Scholarship Council fellowship.
Author contributions
F.L.: designed and performed experiments, analyzed data and wrote the manuscript. N.B.: designed the mouse crossings and initial performance of genotyping. M.K.: performed the bioinformatics analyses and interpretation. X.S.: performed qPCR analysis of pri-Mir34a in IECs, Csf1r and pri-Mir34a in adenomas. J.K.: Dual-reporter assays of murine Csf1r 3'-UTR, and qPCR analysis of Csf1r in CT26 cells. S.J.: supported in situ hybridization and tumoroid analyses. H.H.: conceived and supervised the study, designed experiments/analyses and wrote the manuscript.
Ethics approval and consent to participate
Animal experimentation was approved by the Government of Upper Bavaria, Germany (AZ55.2-1-54-2532-4-2014 and AZ55.2-2532.Vet_02-20-177).
Consent for publication
All authors give consent for the publication of manuscript.
Data availability
The data that support the findings of this study are available from the corresponding author upon reasonable request. Expression profiling data obtained in this study was deposited in the Gene Expression Omnibus website (accession no. GSE167449 and GSE167450).
Competing Interests
The authors have declared that no competing interest exists.
References
1. Kinzler KW, Vogelstein B. Lessons from hereditary colorectal cancer. Cell. 1996;87:159-70
2. Bienz M, Clevers H. Linking colorectal cancer to Wnt signaling. Cell. 2000;103:311-20
3. He L, He X, Lim LP, de Stanchina E, Xuan Z, Liang Y. et al. A microRNA component of the p53 tumour suppressor network. Nature. 2007;447:1130-4
4. Chang TC, Wentzel EA, Kent OA, Ramachandran K, Mullendore M, Lee KH. et al. Transactivation of miR-34a by p53 broadly influences gene expression and promotes apoptosis. Mol Cell. 2007;26:745-52
5. Bommer GT, Gerin I, Feng Y, Kaczorowski AJ, Kuick R, Love RE. et al. p53-mediated activation of miRNA34 candidate tumor-suppressor genes. Curr Biol. 2007;17:1298-307
6. Tarasov V, Jung P, Verdoodt B, Lodygin D, Epanchintsev A, Menssen A. et al. Differential regulation of microRNAs by p53 revealed by massively parallel sequencing: miR-34a is a p53 target that induces apoptosis and G1-arrest. Cell Cycle. 2007;6:1586-93
7. Tazawa H, Tsuchiya N, Izumiya M, Nakagama H. Tumor-suppressive miR-34a induces senescence-like growth arrest through modulation of the E2F pathway in human colon cancer cells. Proc Natl Acad Sci U S A. 2007;104:15472-7
8. Hermeking H. p53 enters the microRNA world. Cancer Cell. 2007;12:414-8
9. Hünten S, Siemens H, Kaller M, Hermeking H. The p53/microRNA network in cancer: experimental and bioinformatics approaches. Adv Exp Med Biol. 2013;774:77-101
10. Rokavec M, Li H, Jiang L, Hermeking H. The p53/miR-34 axis in development and disease. J Mol Cell Biol. 2014;6:214-30
11. Lodygin D, Tarasov V, Epanchintsev A, Berking C, Knyazeva T, Korner H. et al. Inactivation of miR-34a by aberrant CpG methylation in multiple types of cancer. Cell Cycle. 2008;7:2591-600
12. Vogt M, Munding J, Gruner M, Liffers ST, Verdoodt B, Hauk J. et al. Frequent concomitant inactivation of miR-34a and miR-34b/c by CpG methylation in colorectal, pancreatic, mammary, ovarian, urothelial, and renal cell carcinomas and soft tissue sarcomas. Virchows Arch. 2011;458:313-22
13. Cheng CY, Hwang CI, Corney DC, Flesken-Nikitin A, Jiang L, Öner GM. et al. miR-34 cooperates with p53 in suppression of prostate cancer by joint regulation of stem cell compartment. Cell Rep. 2014;6:1000-7
14. Hidalgo-Sastre A, Lubeseder-Martellato C, Engleitner T, Steiger K, Zhong S, Desztics J. et al. Mir34a constrains pancreatic carcinogenesis. Sci Rep. 2020;10:9654
15. Okada N, Lin CP, Ribeiro MC, Biton A, Lai G, He X. et al. A positive feedback between p53 and miR-34 miRNAs mediates tumor suppression. Genes Dev. 2014;28:438-50
16. Öner MG, Rokavec M, Kaller M, Bouznad N, Horst D, Kirchner T. et al. Combined Inactivation of TP53 and MIR34A Promotes Colorectal Cancer Development and Progression in Mice Via Increasing Levels of IL6R and PAI1. Gastroenterology. 2018;155:1868-82
17. Rokavec M, Oner MG, Li H, Jackstadt R, Jiang L, Lodygin D. et al. IL-6R/STAT3/miR-34a feedback loop promotes EMT-mediated colorectal cancer invasion and metastasis. J Clin Invest. 2014;124:1853-67
18. Jiang L, Hermeking H. miR-34a and miR-34b/c Suppress Intestinal Tumorigenesis. Cancer Res. 2017;77:2746-58
19. Concepcion CP, Han YC, Mu P, Bonetti C, Yao E, D'Andrea A. et al. Intact p53-dependent responses in miR-34-deficient mice. PLoS Genet. 2012;8:e1002797
20. Mockly S, Houbron É, Seitz H. A rationalized definition of general tumor suppressor microRNAs excludes miR-34a. Nucleic Acids Res. 2022;50:4703-12
21. Shi X, Kaller M, Rokavec M, Kirchner T, Horst D, Hermeking H. Characterization of a p53/miR-34a/CSF1R/STAT3 Feedback Loop in Colorectal Cancer. Cell Mol Gastroenterol Hepatol. 2020;10:391-418
22. Li J, Chen K, Zhu L, Pollard JW. Conditional deletion of the colony stimulating factor-1 receptor (c-fms proto-oncogene) in mice. Genesis. 2006;44:328-35
23. el Marjou F, Janssen KP, Chang BH, Li M, Hindie V, Chan L. et al. Tissue-specific and inducible Cre-mediated recombination in the gut epithelium. Genesis. 2004;39:186-93
24. Jaeckel S, Kaller M, Jackstadt R, Götz U, Müller S, Boos S. et al. Ap4 is rate limiting for intestinal tumor formation by controlling the homeostasis of intestinal stem cells. Nat Commun. 2018;9:3573
25. Gregorieff A, Clevers H. In situ hybridization to identify gut stem cells. Curr Protoc Stem Cell Biol. 2010 Chapter 2: Unit 2F.1
26. Jackstadt R, Roh S, Neumann J, Jung P, Hoffmann R, Horst D. et al. AP4 is a mediator of epithelial-mesenchymal transition and metastasis in colorectal cancer. J Exp Med. 2013;210:1331-50
27. Sato T, Stange DE, Ferrante M, Vries RG, Van Es JH, Van den Brink S. et al. Long-term expansion of epithelial organoids from human colon, adenoma, adenocarcinoma, and Barrett's epithelium. Gastroenterology. 2011;141:1762-72
28. Li H, Rokavec M, Jiang L, Horst D, Hermeking H. Antagonistic Effects of p53 and HIF1A on microRNA-34a Regulation of PPP1R11 and STAT3 and Hypoxia-induced Epithelial to Mesenchymal Transition in Colorectal Cancer Cells. Gastroenterology. 2017;153:505-20
29. Broutier L, Andersson-Rolf A, Hindley CJ, Boj SF, Clevers H, Koo BK. et al. Culture and establishment of self-renewing human and mouse adult liver and pancreas 3D organoids and their genetic manipulation. Nat Protoc. 2016;11:1724-43
30. Livak KJ, Schmittgen TD. Analysis of relative gene expression data using real-time quantitative PCR and the 2(-Delta Delta C(T)) Method. Methods (San Diego, Calif). 2001;25:402-8
31. Risso D, Ngai J, Speed TP, Dudoit S. Normalization of RNA-seq data using factor analysis of control genes or samples. Nat Biotechnol. 2014;32:896-902
32. Love MI, Huber W, Anders S. Moderated estimation of fold change and dispersion for RNA-seq data with DESeq2. Genome Biol. 2014;15:550
33. Korotkevich G, Sukhov V, Sergushichev A. Fast gene set enrichment analysis. bioRxiv. 2019: 060012.
34. Stephens M. False discovery rates: a new deal. Biostatistics. 2016;18:275-94
35. Liberzon A, Birger C, Thorvaldsdottir H, Ghandi M, Mesirov JP, Tamayo P. The Molecular Signatures Database (MSigDB) hallmark gene set collection. Cell Syst. 2015;1:417-25
36. Sveen A, Bruun J, Eide PW, Eilertsen IA, Ramirez L, Murumägi A. et al. Colorectal Cancer Consensus Molecular Subtypes Translated to Preclinical Models Uncover Potentially Targetable Cancer Cell Dependencies. Clin Cancer Res. 2018;24:794-806
37. Taube JH, Herschkowitz JI, Komurov K, Zhou AY, Gupta S, Yang J. et al. Core epithelial-to-mesenchymal transition interactome gene-expression signature is associated with claudin-low and metaplastic breast cancer subtypes. Proc Natl Acad Sci U S A. 2010;107:15449-54
38. Tan TZ, Miow QH, Miki Y, Noda T, Mori S, Huang RY. et al. Epithelial-mesenchymal transition spectrum quantification and its efficacy in deciphering survival and drug responses of cancer patients. EMBO Mol Med. 2014;6:1279-93
39. Munoz J, Stange DE, Schepers AG, van de Wetering M, Koo BK, Itzkovitz S. et al. The Lgr5 intestinal stem cell signature: robust expression of proposed quiescent '+4' cell markers. EMBO J. 2012;31:3079-91
40. Merlos-Suarez A, Barriga FM, Jung P, Iglesias M, Cespedes MV, Rossell D. et al. The intestinal stem cell signature identifies colorectal cancer stem cells and predicts disease relapse. Cell Stem Cell. 2011;8:511-24
41. Agarwal V, Bell GW, Nam JW, Bartel DP. Predicting effective microRNA target sites in mammalian mRNAs. Elife. 2015 4
42. Dweep H, Gretz N. miRWalk2.0: a comprehensive atlas of microRNA-target interactions. Nat Methods. 2015;12:697
43. Winter M, Rokavec M, Hermeking H. 14-3-3σ Functions as an Intestinal Tumor Suppressor. Cancer Res. 2021;81:3621-34
44. Zheng R, Wan C, Mei S, Qin Q, Wu Q, Sun H. et al. Cistrome Data Browser: expanded datasets and new tools for gene regulatory analysis. Nucleic Acids Res. 2019;47:D729-d35
45. Marisa L, de Reyniès A, Duval A, Selves J, Gaub MP, Vescovo L. et al. Gene expression classification of colon cancer into molecular subtypes: characterization, validation, and prognostic value. PLoS Med. 2013;10:e1001453
46. Cancer Genome Atlas N. Comprehensive molecular characterization of human colon and rectal cancer. Nature. 2012;487:330-7
47. Isella C, Brundu F, Bellomo SE, Galimi F, Zanella E, Porporato R. et al. Selective analysis of cancer-cell intrinsic transcriptional traits defines novel clinically relevant subtypes of colorectal cancer. Nat Commun. 2017;8:15107
48. Barretina J, Caponigro G, Stransky N, Venkatesan K, Margolin AA, Kim S. et al. The Cancer Cell Line Encyclopedia enables predictive modelling of anticancer drug sensitivity. Nature. 2012;483:603-7
49. Esnault C, Stewart A, Gualdrini F, East P, Horswell S, Matthews N. et al. Rho-actin signaling to the MRTF coactivators dominates the immediate transcriptional response to serum in fibroblasts. Genes Dev. 2014;28:943-58
50. Huynh D, Dai XM, Nandi S, Lightowler S, Trivett M, Chan CK. et al. Colony stimulating factor-1 dependence of paneth cell development in the mouse small intestine. Gastroenterology. 2009;137:136-44 44.e1-3
51. Kaller M, Liffers S-T, Oeljeklaus S, Kuhlmann K, Röh S, Hoffmann R. et al. Genome-wide characterization of miR-34a induced changes in protein and mRNA expression by a combined pulsed SILAC and microarray analysis. Molecular & Cellular Proteomics. 2011;10:M111. 010462
52. Kim NH, Kim HS, Kim NG, Lee I, Choi HS, Li XY. et al. p53 and microRNA-34 are suppressors of canonical Wnt signaling. Sci Signal. 2011;4:ra71
53. Sugimoto S, Sato T. Organoid vs In Vivo Mouse Model: Which is Better Research Tool to Understand the Biologic Mechanisms of Intestinal Epithelium? Cell Mol Gastroenterol Hepatol. 2022;13:195-7
54. Guinney J, Dienstmann R, Wang X, de Reyniès A, Schlicker A, Soneson C. et al. The consensus molecular subtypes of colorectal cancer. Nat Med. 2015;21:1350-6
55. Stanley ER, Chitu V. CSF-1 receptor signaling in myeloid cells. Cold Spring Harb Perspect Biol. 2014 6
56. Burridge K, Wennerberg K. Rho and Rac take center stage. Cell. 2004;116:167-79
57. Fang JY, Richardson BC. The MAPK signalling pathways and colorectal cancer. Lancet Oncol. 2005;6:322-7
58. Finbloom DS, Larner AC. Regulation of the Jak/STAT signalling pathway. Cell Signal. 1995;7:739-45
59. Gau D, Roy P. SRF'ing and SAP'ing - the role of MRTF proteins in cell migration. J Cell Sci. 2018 131
60. He R, Liu P, Xie X, Zhou Y, Liao Q, Xiong W. et al. circGFRA1 and GFRA1 act as ceRNAs in triple negative breast cancer by regulating miR-34a. J Exp Clin Cancer Res. 2017;36:145
61. Zhu Y, Feng Z, Cheng W, Xiao Y. MicroRNA-34a mediates atrial fibrillation through regulation of Ankyrin-B expression. Mol Med Rep. 2018;17:8457-65
62. Mazelin L, Bernet A, Bonod-Bidaud C, Pays L, Arnaud S, Gespach C. et al. Netrin-1 controls colorectal tumorigenesis by regulating apoptosis. Nature. 2004;431:80-4
63. Brisset M, Grandin M, Bernet A, Mehlen P, Hollande F. Dependence receptors: new targets for cancer therapy. EMBO Mol Med. 2021;13:e14495
64. Arakawa H. Netrin-1 and its receptors in tumorigenesis. Nat Rev Cancer. 2004;4:978-87
65. Elsafadi M, Manikandan M, Almalki S, Mahmood A, Shinwari T, Vishnubalaji R. et al. Transgelin is a poor prognostic factor associated with advanced colorectal cancer (CRC) stage promoting tumor growth and migration in a TGFβ-dependent manner. Cell Death Dis. 2020;11:341
66. Dvorakova M, Nenutil R, Bouchal P. Transgelins, cytoskeletal proteins implicated in different aspects of cancer development. Expert Rev Proteomics. 2014;11:149-65
67. Watnick PI, Jugder BE. Microbial Control of Intestinal Homeostasis via Enteroendocrine Cell Innate Immune Signaling. Trends Microbiol. 2020;28:141-9
68. Barker N, Ridgway RA, van Es JH, van de Wetering M, Begthel H, van den Born M. et al. Crypt stem cells as the cells-of-origin of intestinal cancer. Nature. 2009;457:608-11
69. Pastuła A, Marcinkiewicz J. Cellular Interactions in the Intestinal Stem Cell Niche. Archivum Immunologiae et Therapiae Experimentalis. 2019;67:19-26
70. Takahashi T, Shiraishi A. Stem Cell Signaling Pathways in the Small Intestine. Int J Mol Sci. 2020;21:2032
71. Leung C, Tan SH, Barker N. Recent Advances in Lgr5(+) Stem Cell Research. Trends Cell Biol. 2018;28:380-91
72. Keino-Masu K, Masu M, Hinck L, Leonardo ED, Chan SS, Culotti JG. et al. Deleted in Colorectal Cancer (DCC) encodes a netrin receptor. Cell. 1996;87:175-85
73. Fearon ER, Cho KR, Nigro JM, Kern SE, Simons JW, Ruppert JM. et al. Identification of a chromosome 18q gene that is altered in colorectal cancers. Science. 1990;247:49-56
74. Mehlen P, Fearon ER. Role of the dependence receptor DCC in colorectal cancer pathogenesis. J Clin Oncol. 2004;22:3420-8
75. Rodrigues S, De Wever O, Bruyneel E, Rooney RJ, Gespach C. Opposing roles of netrin-1 and the dependence receptor DCC in cancer cell invasion, tumor growth and metastasis. Oncogene. 2007;26:5615-25
76. Castets M, Broutier L, Molin Y, Brevet M, Chazot G, Gadot N. et al. DCC constrains tumour progression via its dependence receptor activity. Nature. 2011;482:534-7
77. Mehlen P, Rabizadeh S, Snipas SJ, Assa-Munt N, Salvesen GS, Bredesen DE. The DCC gene product induces apoptosis by a mechanism requiring receptor proteolysis. Nature. 1998;395:801-4
78. Qi Q, Li DY, Luo HR, Guan KL, Ye K. Netrin-1 exerts oncogenic activities through enhancing Yes-associated protein stability. Proc Natl Acad Sci U S A. 2015;112:7255-60
79. Shimizu A, Nakayama H, Wang P, König C, Akino T, Sandlund J. et al. Netrin-1 promotes glioblastoma cell invasiveness and angiogenesis by multiple pathways including activation of RhoA, cathepsin B, and cAMP-response element-binding protein. J Biol Chem. 2013;288:2210-22
80. Yin K, Shang M, Dang S, Wang L, Xia Y, Cui L. et al. Netrin-1 induces the proliferation of gastric cancer cells via the ERK/MAPK signaling pathway and FAK activation. Oncol Rep. 2018;40:2325-33
81. Ylivinkka I, Hu Y, Chen P, Rantanen V, Hautaniemi S, Nyman TA. et al. Netrin-1-induced activation of Notch signaling mediates glioblastoma cell invasion. J Cell Sci. 2013;126:2459-69
82. Wei X, Lou H, Zhou D, Jia Y, Li H, Huang Q. et al. TAGLN mediated stiffness-regulated ovarian cancer progression via RhoA/ROCK pathway. J Exp Clin Cancer Res. 2021;40:292
83. Liu J, Zhang Y, Li Q, Wang Y. Transgelins: Cytoskeletal Associated Proteins Implicated in the Metastasis of Colorectal Cancer. Front Cell Dev Biol. 2020;8:573859
84. Lin Y, Buckhaults PJ, Lee JR, Xiong H, Farrell C, Podolsky RH. et al. Association of the actin-binding protein transgelin with lymph node metastasis in human colorectal cancer. Neoplasia. 2009;11:864-73
85. Zhou HM, Fang YY, Weinberger PM, Ding LL, Cowell JK, Hudson FZ. et al. Transgelin increases metastatic potential of colorectal cancer cells in vivo and alters expression of genes involved in cell motility. BMC Cancer. 2016;16:55
86. Zhong W, Hou H, Liu T, Su S, Xi X, Liao Y. et al. Cartilage Oligomeric Matrix Protein promotes epithelial-mesenchymal transition by interacting with Transgelin in Colorectal Cancer. Theranostics. 2020;10:8790-806
87. Chen Z, He S, Zhan Y, He A, Fang D, Gong Y. et al. TGF-β-induced transgelin promotes bladder cancer metastasis by regulating epithelial-mesenchymal transition and invadopodia formation. EBioMedicine. 2019;47:208-20
88. Lew ZX, Zhou HM, Fang YY, Ye Z, Zhong W, Yang XY. et al. Transgelin interacts with PARP1 in human colon cancer cells. Cancer Cell Int. 2020;20:366
89. Zhou H, Zhang Y, Chen Q, Lin Y. AKT and JNK Signaling Pathways Increase the Metastatic Potential of Colorectal Cancer Cells by Altering Transgelin Expression. Dig Dis Sci. 2016;61:1091-7
90. Zhou H, Li L, Xie W, Wu L, Lin Y, He X. TAGLN and High-mobility Group AT-Hook 2 (HMGA2) Complex Regulates TGF-β-induced Colorectal Cancer Metastasis. Onco Targets Ther. 2020;13:10489-98
Author contact
![]() Corresponding author: Prof. Heiko Hermeking, Experimental and Molecular Pathology, Institute of Pathology, Ludwig-Maximilians-University München, Thalkirchner Strasse 36, D-80337 Munich, Germany. Tel.: ++49-89-2180-73685; Fax: ++49-89-2180-73697; E-mail: heiko.hermekinguni-muenchen.de
Corresponding author: Prof. Heiko Hermeking, Experimental and Molecular Pathology, Institute of Pathology, Ludwig-Maximilians-University München, Thalkirchner Strasse 36, D-80337 Munich, Germany. Tel.: ++49-89-2180-73685; Fax: ++49-89-2180-73697; E-mail: heiko.hermekinguni-muenchen.de