Impact Factor ISSN: 1449-2288
- Issue 12; 2026
- Issue 11; 2026
- Issue 10; 2026
- Issue 9; 2026
- Issue 8; 2026
- Volume 22; 2026
- Past Issues
- Advance Articles
- Editorial Board
- Cover Images
- Index & Coverage
- Cover Suggestion
- Special Issues
Introduction
Materials and methods
Results
Discussion
Conclusions
Supplementary Material
Acknowledgements
References

 Global reach, higher impact
Int J Biol Sci 2023; 19(3):950-966. doi:10.7150/ijbs.80461 This issue Cite
Research Paper
CD73/NT5E-mediated ubiquitination of AURKA regulates alcohol-related liver fibrosis via modulating hepatic stellate cell senescence
Zhenni Liu1,2,3#, Baoming Wu1,2,3#, Xueqi Liu1,2,3, Xue Wu1,2,3, Jiyu Du1,2,3, Guoqing Xia1,2,3, Junnan Cai1,2,3, Hong Zhu1,2,3, Xiaodong Sheng1,2,3, Mengda Zhang1,2,3, Junrui Xu4, Tao Xu1,2,3, Xiongwen Lv1,2,3 ![]()
1. Inflammation and Immune Mediated Diseases Laboratory of Anhui Province, Anhui Institute of Innovative Drugs, Hefei, China.
2. School of Pharmacy, Anhui Medical University, Hefei, China.
3. Institute for Liver Diseases of Anhui Medical University, Hefei, China.
4. General Thoracic Surgery, the First Affiliated Hospital of Anhui Medical University, Hefei, China.
#Co-first authors with equal contributions to this work.
Received 2022-11-3; Accepted 2023-1-1; Published 2023-1-16
Abstract

Alcohol-related liver disease (ALD) is the most common chronic liver disease worldwide; however, no effective treatment to prevent the progression of alcohol-related liver fibrosis (ALF) is available. CD73/NT5E, a nucleotidase, controls cellular homeostasis by combining extracellular purinergic signaling with intracellular kinase activity and gene transcription and is associated with cell proliferation, differentiation, and death. In this study, we demonstrated that CD73/NT5E had a more significant regulatory effect on the activation, proliferation, and apoptosis of HSCs compared with that of CD39/ENTPD1. We examined the expression of CD73/NT5E in the normal and fibrotic human livers. The absence of CD73/NT5E was protective in mouse models of ALF. In addition, Kyoto Encyclopedia of Genes and Genomes (KEGG) pathway analyses showed that CD73/NT5E overexpression was related to the p53 signaling pathway, which regulates cell senescence. Proteins interacting with p53 were predicted using the STRING database. The overlap between proteomic analysis and STRING databases was for Aurora kinase A (AURKA), a cell cycle-regulated kinase. Coimmunoprecipitation (co-IP) assay and molecular docking confirmed that CD73/NT5E directly interacted with AURKA. We found that overexpression of CD73/NT5E inhibited AURKA ubiquitination, whereas p53 signaling was downregulated. Mechanistically, CD73/NT5E regulated ALF and the activation and senescence of stellate cells by binding to AURKA. These findings indicate that CD73/NT5E is a potential therapeutic target for ALF.
Keywords: Alcohol-related liver fibrosis (ALF), CD39-CD73-Adenosine axis, Aurora kinase A (AURKA), p53 signaling pathway
Introduction
Alcohol-related liver disease (ALD) is the most prevalent type of chronic liver disease and poses a significant disease burden worldwide [1]. Alcohol consumption has become a global phenomenon [2]. Owing to the improvement in the quality of life and the explosive growth of the economy in China, the consumption of alcohol has increased significantly, with an associated increase in ALD incidence [3, 4]. Excessive alcohol consumption is a major cause of chronic liver disease, leading to simple steatosis, steatohepatitis, fibrosis, cirrhosis, and hepatocellular carcinoma (HCC). Despite extensive research on ALD in recent years, no effective targeted therapy has been identified [5, 6].
ALD pathogenesis includes hepatic steatosis, oxidative stress, acetaldehyde-mediated toxicity, and cytokine and chemokine-induced inflammation [7]. The current academic view holds that fibrotic repair is a key link in the reversible recovery of ALD [8, 9]. Alcohol-related liver fibrosis (ALF) is a scarring reaction caused by long-term alcohol consumption and is characterized by the deposition of a large amount of extracellular matrix (ECM) in the liver. Hepatic stellate cells (HSC) play a central role in the pathogenesis of liver fibrosis, transdifferentiating in chronic liver disease from “quiescent” HSC to proliferative, migratory, and fibrogenic myofibroblasts that exhibit profibrotic transcriptional and secretory properties (so-called “cellular activation”), and secretes a large number of ECM proteins, tissue inhibitors of metalloproteinases, and matrix metalloproteinases (MMPs) that trigger structural remodeling of the liver [10, 11]. Therefore, HSC depletion is critical for fibrosis resolution.
Purine signaling is mainly composed of three parts: extracellular nucleotides, ectonucleotidases (such as CD39 and CD73), and specific receptors that act on nucleotides and their derivatives [12]. Among them, CD39 (ectonucleoside triphosphate diphosphohydrolase-1, ENTPD1) and CD73 (ecto-5′-nucleotidase, NT5E) are key regulatory molecules in the purine signaling pathway. ATP is rapidly hydrolyzed by CD39 and CD73 to adenosine when released from stressed or damaged cells into the extracellular space [13]. As a bridge to maintaining the balance of purinergic signaling, the role of the CD39-CD73-adenosine signaling pathway in fibrotic diseases has attracted the attention of many researchers. Fernández et al. reported that deletion of the enzymes involved in adenosine production (CD73, CD39, or both) prevents skin fibrosis in murine models [14]. Preventing the increase in extracellular adenosine levels by inhibiting the function of CD39 and/or CD73 may attenuate the fibrogenic effects of adenosine. However, some studies have provided evidence to the contrary. Peng et al. reported that knockout of CD39 in mice with sclerosing cholangitis promoted biliary tract injury and fibrosis [15].
Our previous experiments showed that the pharmacological blocking of CD73 or CD39 expression could inhibit the activation and proliferation of HSCs through the Wnt/β-catenin or TGF-β/Smad3 signaling pathways. In this study, we compared the roles of CD39 and CD73 in HSC activation and proliferation. We further tested the role of CD73 in alcohol-related liver fibrosis in vivo in CD73 knockout (KO) mice and in vitro in CD73-overexpressed and CD73-silenced HSCs/LX-2 cells. The downstream target of CD73 was also identified.
Materials and methods
Reagents and materials
Antibodies included anti-β-actin (Santa Cruz Biotechnology, sc-47778), anti-α-SMA (Bioss, bs-10196R and Bioss, bsm-33187M), anti-COL1a1 (Bioss, bs-10423R), anti-CD39 (proteintech, 14211-1-AP), anti-CD73 (Invitrogen, PA5-81614 and proteintech, 12231-1-AP), anti-c-Myc (Abcam, ab32072), anti-Cyclin D1 (Abcam, ab40754), anti-Bax (Abcam, ab32503), anti-Bcl-2 (Abcam, ab182858), anti-cleaved caspase 3 (Abcam, ab184787), anti-AURKA (Wanleibio, WL03733 and Abcam, ab52973), anti-p-AURKA (Abmart, TA3011), anti-p53 (Bioss, bs-8687R), anti-p21 (Abcam, ab109199) and anti-p16 (Wanleibio, WL01418). HRP-conjugated anti-rabbit secondary antibodies were obtained from ZSGB-BIO. MLN8237 was purchased from ApexBio Technology (A4110). Cycloheximide (CHX), MG132, chloroquine (CQ) and N-[N-(N-Acetyl-L-leucyl)L-leucyl]-L-norleucine (ALLN) were purchased from Selleck. ALT assay kit and AST assay kit were obtained from Mindray. The Senescence beta-Galactosidase Staining Kit was obtained from Beyotime (C0602).
Human liver tissue samples
The non-tumor portion of the liver were obtained from a patient who had undergone partial hepatectomy and had a history of drinking alcohol. The degree of fibrosis was classified as normal liver and mild to moderate fibrosis according to the Liver Cancer Study Group of Japan [16]. This study was approved by Biomedical Ethics Committee of Anhui Medical University. And all protocols adhered to the principles outlined in the Declaration of Helsinki.
Animal studies
Male C57BL/6 mice (aged 8-12 weeks) were obtained from the Experimental Animal Center, Anhui Medical University. All experimental procedures in this study were approved by the Animal Experimentation Ethics Committee from Anhui Medical University, Anhui, China. The mice in model group were fed a liquid diet containing 5% ethanol for 8 weeks, and were gavaged with a high-concentration alcohol (5 g/kg) twice a week. In the last two weeks, mice received intraperitoneal injections of CCl4 (10 % in olive oil, 1 ml/kg). The liver tissues and blood from these mice were collected after the last alcohol gavage for further analysis and primary hepatic stellate cells (HSCs) were isolated (Fig. 1F). CD73 knockout mice were obtained from the Cyagen Biosciences Inc. Mice were divided into four groups: (i) WT (ii) WT, EtOH-fed+CCl4 (iii) KO (iv) KO, EtOH-fed+CCl4. All mice were genotyped by PCR before and after experiments.
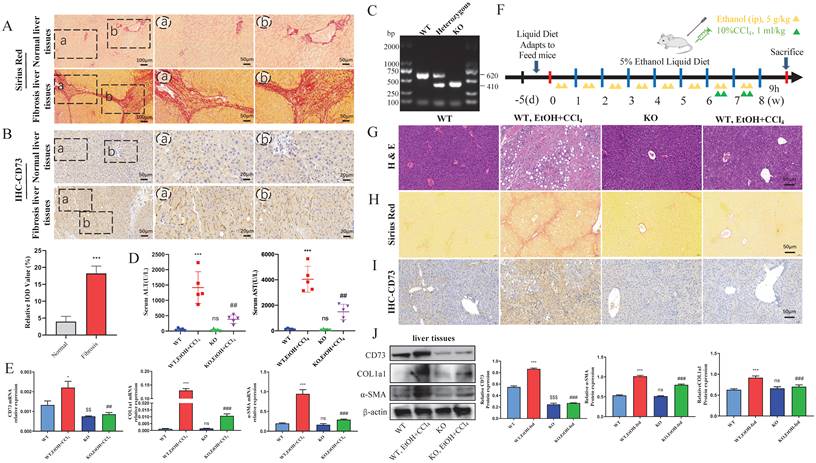
KO of CD73 protected against EtOH+ CCl4-induced liver injury and fibrosis in mice. (A) Representative pictures of Sirius Red staining of human liver tissue sections were shown (50 μm and 100 μm). (B) Representative pictures of CD73 immune staining of human liver tissue sections were shown (20 μm). (C) CD73 deficiency was confirmed by assessing genomic DNA. (D) Serum ALT and AST levels were measured. The mRNA (E) and protein (J) levels of CD73, α-SMA and COL1a1 in liver tissues were measured by Western blot and RT-qPCR. (F) Establishment of an alcohol-related liver fibrosis model. Representative pictures of H&E (G) and Sirius Red staining (H) of liver tissue sections were shown (50 μm). (I) Representative pictures of CD73 immune staining were shown (50 μm). *P < 0.05, ***P < 0.001 vs. the WT group. $$P < 0.01, $$$P < 0.001 vs. the WT group. ##P < 0.01, ###P < 0.001 vs. the WT, EtOH-fed+CCl4 group.
Primary HSCs Isolation
Hepatic stellate cells (HSCs) were isolated by in situ collagenase perfusion of the liver. Briefly, mice were anesthetized, a 24-G catheter was put through mouse the portal vein and the inferior vena cava were cut. Then the liver was perfused with PB until the liver was free of blood. Replace the PB with the freshly prepared enzyme solution, and clamp the inferior vena cava with hemostatic forceps. After the liver was completely digested, removed it and placed it into a glass dish containing 1% BSA. The cells were liberated by tearing and shaking of the liver with forceps. Cells suspension was centrifuged at 4 °C, 50 g, 2 min. The supernatant was collected and centrifuged at 4 °C, 760 g for 10 min. The supernatant was discarded, and the pellets were resuspended in 4 ml DMEM, and the previous step was repeated. The pellet was resuspended with 2 ml DMEM for use. The cell suspension was subsequently mixed with Nycodenz (Sigma, GER) solution to give a final density between 1.04 to 1.06 g/ml by adding DMEM. Nycodenz mixture was covered with 1ml Hank's fluid (Gibco, United States) and centrifuged at 20 °C, 1350 g for 18 min. After the centrifugation, the cells at the interface were transferred to a new 15 ml tube, then an appropriate amount of DMEM was added, centrifuged at 1350 g for 5 min, the pellet was resuspended in 3 ml DMEM, and inoculated into culture bottles.
Liver histology and immunohistochemistry
Paraffin-embedded mouse liver sections were prepared by a routine procedure including fixation, dehydration, waxing, and embedding. The fixed sections were 4 μm thick and then stained with hematoxylin and eosin (H&E) staining, Masson staining and Sirius Red staining. Immunohistochemical staining was performed according to the manufacturer's instructions. The antibodies specific for CD73 (proteintech, 12231-1-AP), CD39 (proteintech, 14211-1-AP), and AURKA (Wanleibio, WL03733), α-SMA (Bioss, bs-10196R) were incubated overnight at 4 °C, and the secondary antibodies were incubated for 1 hour at room temperature. Then staining was observed with 3,3-diaminobenzidine tetrahydrochloride (DAB) staining. Slides were visualized using a microscope (Olympus IX83, Japan).
Immunofluorescent staining
The sections were permeated with 1 % Triton X-100 for 15 min. In total, 5% BSA was used for tissue blocking. The frozen liver tissue sections were incubated with rabbit polyclonal primary antibodies for CD73 (proteintech, 12231-1-AP)/ CD39 (proteintech, 14211-1-AP) mouse monoclonal primary antibodies for α-SMA (Bioss, bsm-33187M)/ F4/80 (Santa Cruz Biotechnology, SC-377009)/ CK19 (Santa Cruz Biotechnology, SC-376126) overnight at 4 °C, the cell sections were incubated with rabbit polyclonal primary antibodies for AURKA (Wanleibio, WL03733) mouse monoclonal primary antibodies for CD73 (Invitrogen, PA5-81614), and then incubated with a secondary antibodies for 2 h. The stained sections were visualized and captured using a microscope (Olympus IX83, Japan).
ALT/AST/Adenosine activity
The contents of ALT and AST in serum were measured by automatic biochemical analyzer. Take 10 μl of serum and put it into a 1.5 ml EP tube with 90 μl of PBS. The EP tube, R1 and R2 reagents were put into an automatic biochemical analyzer to detect the content of ALT and AST. Serum adenosine content was detected according to the Adenosine Assay Kit (Abcam, ab211094).
Western blot
The protein lysates from liver tissues and cultured cells were prepared following standard protocols, and Western blot analysis was performed as described previously [17]. Primary antibodies used in this study include β-actin, α-SMA, COL1a1, CD39, CD73, c-Myc, Cyclin D1, Bax, Bcl-2, cleaved caspase 3, AURKA, p-AURKA, p53, p21 and p16. Signals were detected using a chemiluminescent (ECL) system (Bio-Rad, USA) and the results were analyzed using ImageJ software (National Institutes of Health, USA).
Total RNA isolation and quantitative real-time PCR
Total RNA from liver tissues and cultured cells was extracted using TRIzol (Invitrogen, United States) following the manufacturer's instructions. RNA was quantified by a Nanodrop 2000 (Thermo Scientific, USA). The mRNA levels of GAPDH, α-SMA, COL1a1, CD39, CD73 and AURKA were determined by RT-qPCR. The primer sequences were listed in Table 1.
RT-qPCR primers
| Gene | Forward | Reverse |
|---|---|---|
| Rat | ||
| β-actin | GAGCGCAAGTACTCTGTGTG | CCTGCTTGCTGATCCACATC |
| CD73 | GGCAGATGCTCTTCACAAGG | CCTTCCAGAAGGACCCTGTT |
| CD39 | TTCCTGGTGAGCCTCTCTTG | ATGGCTGAGACGGTTTCTGA |
| COL1a1 | ACCTCAGGGTATTGCTGGAC | GACCAGGGAAGCCTCTTTCT |
| α-SMA | GAGGGATCCTGACCCTGAAG | CCACGCGAAGCTCGTTATAG |
| AURKA | CCGAAACGAGTCTTGGTGAC | CTTGAGCACTGGCTTCTGAC |
| Mouse | ||
| GAPDH | AGGTCGGTGTGAACGGATTTG | TGTAGACCATGTAGTTGAGGTCA |
| CD73 | CTGAGCGCTCTACTACCACA | AACAGCACGTTGGGTTCTTC |
| CD39 | GTGTATGTGTGGGTCTGTGC | CCAGCTTGGAAAGACTGACG |
| COL1a1 | TCCCTGGAATGAAGGGACAC | CTCTCCCTTAGGACCAGCAG |
| α-SMA | ACCCAGCACCATGAAGATCA | TCTGCTGGAAGGTAGACAGC |
| AURKA | CTGGATGCTGCAAACGGATAG | CGCTGGGAGTTAGAAGGACAC |
| Human | ||
| β-actin | CGCCGCCAGCTCACCATG | CACGATGGAGGGGAAGACGG |
| CD73 | ACAACCTGAGACACACGGAT | TAACTGGGCACTCGACACTT |
| COL1a1 | TCTAGACATGTTCAGCTTTGTGGAC | TCTGTACGCAGGTGATTGGTG |
| α-SMA | ACGTGGAGCTGTACCAGAAA | GCAGTGTGTTATCCCTGCTG |
Cell culture and treatment
Rat HSC-T6 cells line was obtained from the Type Culture Collection of the Chinese Academy of Sciences (Shanghai, China). The human HSC line (LX‐2) was obtained from Xiang Ya Central Experiment Laboratory (China). HSC-T6 cells and LX‐2 cells were cultured in DMEM (HyClone, USA) supplemented with 10% fetal bovine serum (FBS, Biological Industries, Israel). Cells were incubated at 37 °C with 5% CO2. HSC-T6 cells were activated by 200 μM acetaldehyde. LX‐2 cells were activated by 600 μM acetaldehyde.
Flow cytometry
To detect apoptosis of HSC-T6 cells, the Annexin-V-FITC/PI Apoptosis Detection Kit (Best bio, China) was used according to the manufacturer's standard protocol. Cells were transferred to a flow tube and detected by Flow cytometry (Beckman Coulter, USA).
CCK-8 Analysis
The HSC-T6 cells were collected at the exponential phase and seeded into a 96-well plate (the edge wells were filled with sterile PBS). After attachment, HSC-T6 cells were treated with different concentrations of MLN8237 (0, 1.25, 2.5, 5, 10, 25, 50, 100, 200 nM) and CHX (0, 10, 25, 50, 100, 200, 400, 600 μM) for 48 h. Then, 10 μl CCK-8 (Bioss, China) was added for 1 h. The value of absorbance (A) was examined at the wavelength of 490 nm.
Proteomic analysis
Briefly, HSC-T6 cells transfected with pEX3-NC-CD73 and pEX3-CD73 plasmid were collected and lysed with protein lysate according to the manufacturer's instructions. LC-MS/MS data was collected using the latest generation Orbitrap mass spectrometer (Q-Exacitve HF) after protein Trypsin digestion. The data were analyzed using the Proteome Discoverer software platform. The uniprot-taxonomy 10114 (rattus+ norvegicus) fasta database was used.
Cell transfection
To down-regulate or up-regulate the expression of CD39, CD73 and p53, CD39-siRNA/pEX-3-CD39, CD73-siRNA/pEX-3-CD73, p53-siRNA/pEX-3-p53 and corresponding control RNA were used (purchased from Hanbio and Gene Pharma). The siRNA sequences were listed in Table 2. Briefly, siRNA or plasmid was transferred into cells cultured in Opti-MEM using LipoFiterTM3 after 24 h of cell culture. After 6 h, cells were cultured in DMEM containing 10% BI and treated with acetaldehyde for 48 h and consequently harvested for analysis with Western blotting, RT-qPCR and other experiments.
siRNA sequences
| Gene | Sense (5'→3') | Antisense (5'→3') |
|---|---|---|
| Rat | ||
| CD73 | GGUUGAGUUUGAUGAUAAA | UUUAUCAUCAAACUCAACC |
| CD39 | GGUUGUGAAUGUAAGCGAA | UUCGCUUACAUUCACAACC |
| p53 | GUACUCAAUUUCCCUCAAUTT | AUUGAGGGAAAUUGAGUACTT |
| Scrambled siRNA | UUCUCCGAACGUGUCACGU | ACGUGACACGUUCGGAGAA |
| Human | ||
| CD73 | CAGUUGAAGGUCGGAUCAATT | UUGAUCCGACCUUCAACUGTT |
| p53 | CCACCAUCCACUACAACUATT | UAGUUGUAGUGGAUGGUGGTT |
Co-immunoprecipitation assay
Cells were lysed in an ice bath with lysis buffer (Beyotime Biotechnology, China) for 30 min, and centrifuged at 3000 rpm for 15 min at 4 °C to obtain the supernatant. Cell lysates were incubated with the anti-CD73 antibodies for 2 h. Then protein A/G agarose beads (Bioworld, U.S.A) were added and the mixtures allowed incubating at 4 °C with gentle rocking overnight. Beads were washed with an appropriate amount of lysis buffer and eluted. The immune complexes were then subjected to Western blot for determination of AURKA (Wanleibio, WL03733) protein expression.
HSCs senescence analysis
The senescence-associated β-galactosidase (SA-β-Gal) staining kit (Beyotime, Shanghai, China) was used to detect cellular senescence. Briefly, treated cells were washed with PBS, then 1 ml of staining fixative was added and fixed for 15 minutes. After that 1 ml of staining working solution was added and cells were incubated overnight at 37 °C, then observed cells under ordinary light microscope.
Molecular docking analysis
Based on the crystal structure of CD73 and AURKA, the target proteins, CD73 and AURKA were docked using ZDOCK to find the phosphorylation site of AURKA bound to CD73. The crystal structure of CD73 and AURKA were obtained from the Protein Data Bank (PDB). The docking studies were performed using AUTODOCK 4.1 software. All docking calculations were done using a Lamarckian genetic algorithm.
Statistical analysis
All statistical analyses were performed using GraphPad Prism 7. Results are expressed as mean ± SD from multiple experiments. Student's t-test or one-way analysis of variance (LSD) were used for statistical significance test. The differences were considered statistically significant at p < 0.05.
Results
Upregulation of CD39-CD73-adenosine axis and fibrotic indicators in EtOH+CCl4 feeding mice and acetaldehyde-induced HSC-T6 cells
To confirm the expression of the CD39-CD73-adenosine axis in ALF, we established an in vivo model. As shown in Supplementary Fig. 1A, the livers of mice in the EtOH-fed+CCl4 group presented with fibrotic lesions and evident hepatomegaly. In serum of EtOH-fed+CCl4 mice, ALT and AST levels were significantly higher than in the controls (Supplementary Fig. 1B). H&E staining showed that the livers of EtOH-fed+CCl4 mice exhibited excessive inflammatory cell infiltration and hepatocyte necrosis (Supplementary Fig. 1C). The degree of fibrosis in mouse livers from different groups was evaluated using Masson staining and IHC-α-SMA. As shown in Supplementary Fig. 1D and E, EtOH +CCl4 enhanced collagen fiber deposition and α-SMA accumulation. These results indicated that the model was successfully established. To evaluate the liver-resident cells that expressed CD73/CD39, we performed double immunofluorescence staining with specific markers of HSCs (α-SMA), hepatocytes (CK19), and macrophages (F4/80). The results showed that CD39 was expressed in all three cell types, but the difference was most pronounced in HSC (Supplementary Fig. 1H, I and J). CD73 was most highly expressed in HSCs, and double immunofluorescence staining showed that the CD73-positive area and the α-SMA-positive area in the EtOH-fed+CCl4 group highly overlapped (Supplementary Fig. 1K). The expression of CD73 was lower in hepatocytes and macrophages, and the difference between the pair-fed and EtOH-fed+CCl4 groups was not evident (Supplementary Fig. 1L and M). Therefore, we selected HSCs as our next study subjects. Furthermore, adenosine levels were higher in the EtOH-fed+CCl4 group than in the pair-fed group (Supplementary Fig. 1F). The protein levels of COL1a1, α-SMA, CD39 and CD73were dramatically elevated in primary HSCs isolated from fibrotic livers relative to those in the pair-fed group (Supplementary Fig. 1G). Taken together, these data indicate that CD39 and CD73 are expressed in HSCs and are elevated in the EtOH+CCl4-induced mouse model.
Western blotting and immunofluorescence were used to determine the expression of CD39 and CD73 in acetaldehyde-treated HSC-T6 cells. As shown in Supplementary Fig. 2A, the expression of α-SMA and COL1a1 was highest when the acetaldehyde concentration was 200 μM. As shown in Supplementary Fig. 2B, α-SMA and COL1a1 exhibited their highest protein expression levels when the acetaldehyde stimulation time was 48 h. In conclusion, we chose acetaldehyde (200 μM) and 48 h for further studies. Western blot results showed that the expression of α-SMA and COL1a1 in HSC-T6 cells increased after stimulation with acetaldehyde, and the expression of CD39 and CD73 was also significantly increased. Furthermore, the immunofluorescence results of α-SMA, CD39, and CD73 were consistent with those of the western blot analysis (Supplementary Fig. 2C, D, E and F).
Dynamic changes of CD39-CD73-adenosine axis in the ALF process
To explore the dynamic changes in the CD39-CD73-adenosine axis in the process of ALF, we detected the expression of CD39 and CD73 at 1, 2, 4, 6, and 8 weeks. H&E staining showed that from the second week, the EtOH-fed+CCl4 group had increased fat vacuoles and disordered hepatic cords, and the damage was aggravated with time (Supplementary Fig. 3A). Masson staining and Sirius Red staining results showed that mild fibrosis appeared in the liver tissue at 6 weeks, and fibrosis was clear at 8 weeks (Supplementary Fig. 3B and C). This phenomenon was also demonstrated by the expression of COL1a1 and α-SMA in the primary stellate cells and liver tissues (Supplementary Fig. 3D, E, and F). Concurrently, we observed that the expression of CD39 and CD73 increased in the EtOH-fed+CCl4 group compared with the pair-fed group from the second week and increased in a time-dependent manner (Supplementary Fig. 3D, E, and F).
Silencing CD39 and CD73 separately or together attenuated fibrosis induced by acetaldehyde in HSC-T6 cells
Our previous studies have shown that silencing of CD39 or CD73 can alleviate ALF [18, 19]. In this study, we aimed to further confirm whether CD39 or CD73 plays the dominant role in ALF. First, the transfection efficiency of CD39-siRNA/CD73-siRNA and pEX3-CD39/pEX3-CD73 was examined by determining CD39 and CD73 protein expression in HSC-T6 cells. As shown in Supplementary Fig. 4A, B, C, and D, when CD39-siRNA/CD73-siRNA was transfected into acetaldehyde- stimulated HSC-T6 cells, the protein expression of CD39/CD73 was significantly decreased. In contrast, when pEX3-CD39/pEX3-CD73 was transfected into acetaldehyde-stimulated HSC-T6 cells, the expression of CD39/CD73 was significantly increased. Taken together, these data indicated that transfection of CD39-siRNA/CD73-siRNA and pEX3-CD39/pEX3-CD73 was successful in HSC-T6 cells. We then silenced CD39 and CD73 separately or together to compare the alleviating effects of CD39 and CD73 on ALF by observing the expression of COL1a1 and α-SMA. The results of protein and mRNA analyses showed that silencing CD39 or CD73 alone could downregulate the elevation of COL1a1 and α-SMA induced by acetaldehyde, and silencing CD73 could significantly reduce the expression of COL1a1 and α-SMA. Furthermore, we found that co-silencing of CD39 and CD73 significantly reduced the expression of COL1a1 and α-SMA, especially when compared to the CD39-siRNA group (Supplementary Fig. 4E and G). In contrast, the overexpression of CD39 and/or CD73 promoted acetaldehyde-induced fibrosis. Interestingly, the expression of COL1a1 and α-SMA was not significantly increased in the pEX3-CD39+pEX3-CD73 group compared to that in the pEX3-CD39 group (Supplementary Fig. 4F and H). These findings indicate that silencing CD73 alone had a better effect on inhibiting the increased expression of COL1a1 and α-SMA induced by acetaldehyde.
Silencing CD39 and CD73 separately or together facilitated apoptosis of HSC-T6 cells
Subsequently, we compared the effects of CD39 and CD73 on HSC apoptosis. Flow cytometry analyses showed that silencing CD39 or CD73 alone could increase the percentage of apoptotic HSC-T6 cells; the effect of silencing CD73 was more evident, and silencing CD39 further enhanced the apoptosis-promoting effect of CD73 (Supplementary Fig. 5A). The protein expression level of cleaved caspase-3 and the ratio of Bax/Bcl-2 were consistent with the results of apoptosis analysis (Supplementary Fig. 5B). In addition, the expression of cell cycle-related proteins (c-Myc and cyclinD1) also confirmed that silencing CD73 or CD39 alone induced cell cycle arrest in acetaldehyde-stimulated HSC-T6 cells. However, c-Myc and cyclinD1 were not significantly different in the CD73-siRNA+CD39-siRNA group compared to the CD39-siRNA group (Supplementary Fig. 5C). These results suggested that CD73 has a more pronounced effect on HSC apoptosis and proliferation. In contrast, flow cytometry and western blotting results showed that overexpression of CD39 or CD73 can inhibit HSC apoptosis and promote HSC proliferation. The effect of CD73 overexpression alone was more pronounced. However, compared to the pEX3-NC-CD39 group, the pEX3-NC-CD39+ pEX3-NC-CD73 group had no evident influence on the protein expression of cleaved caspase-3, c-Myc and cyclinD1 and the ratio of Bax/Bcl-2 (Supplementary Fig. 5D, E and F). Taken together, these data indicate that CD73 has a more evident effect on reducing the expression of COL1a1 and α-SMA induced by acetaldehyde, promoting the apoptosis of activated HSC, and inhibiting the proliferation of HSC. In this study, we explored the mechanism of action of CD73 in ALF.
KO of CD73 protected against EtOH+ CCl4-induced liver injury and fibrosis in mice
First, we detected fibrosis in the liver tissue of patients with a history of alcohol consumption using Sirius Red staining (Fig. 1A). As shown in Fig. 1B, the CD73 immunostaining signal was increased in liver tissues from liver fibrosis patients with a history of alcohol consumption compared to the normal liver tissues. To further confirm the function of CD73 in vivo, CD73 KO mice were used. All mice were genotyped using PCR (Fig. 1C). The absence of CD73 was verified using immunohistochemistry, western blotting, and RT-qPCR (Fig.1E, I and J). H&E and Sirius Red staining showed that CD73 deficiency attenuated EtOH+ CCl4-induced liver injury and fibrosis while decreasing serum ALT and AST concentrations (Fig. 1D, G and H). In addition, western blotting and RT-qPCR revealed that the absence of CD73 reduced the expression of α-SMA and COL1a1 (Fig. 1E and J). These results further support an important role for CD73.
CD73 regulated the p53 signaling pathway
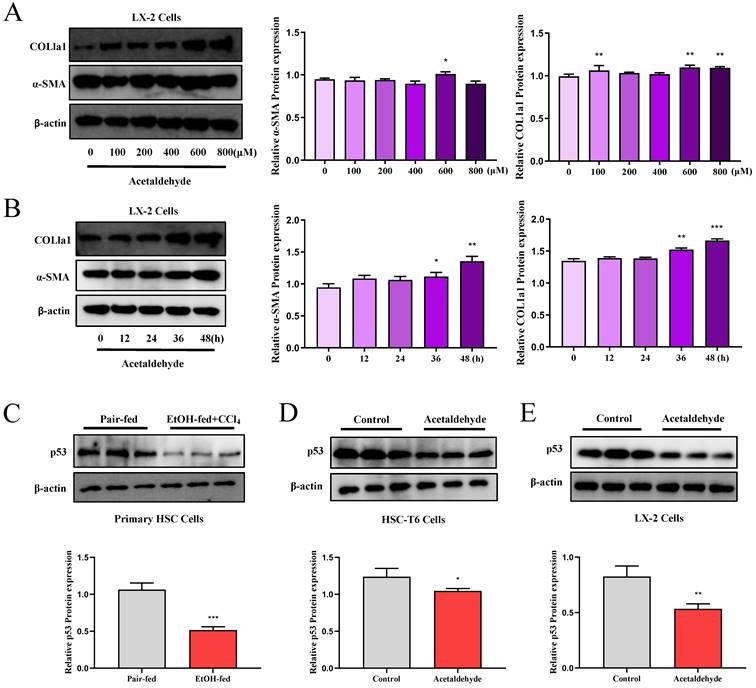
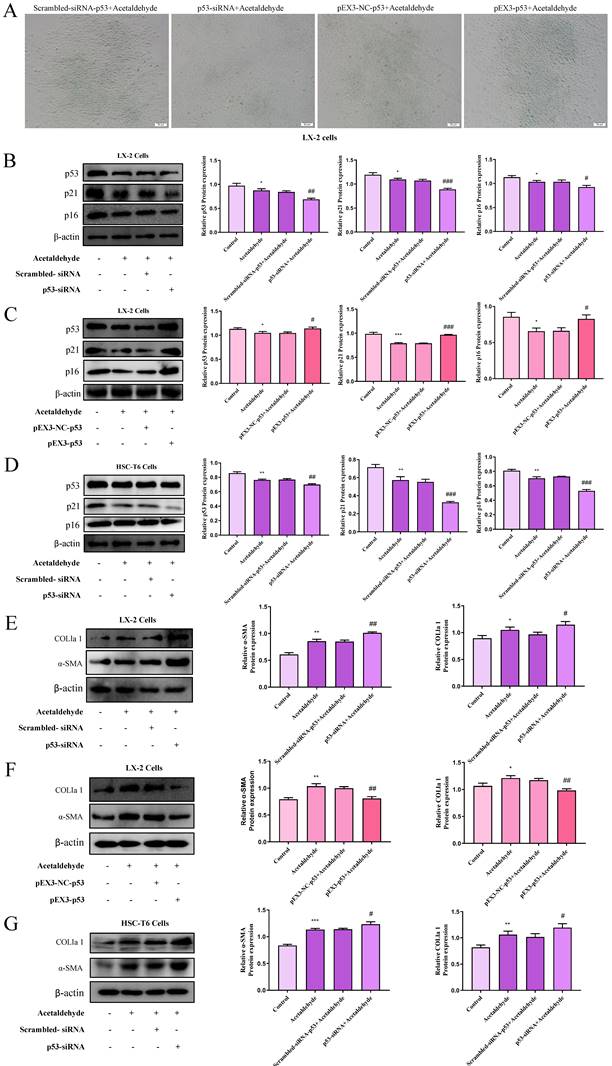
We performed a proteomics assay using HSC-T6 cells (pEX3-NC vs. pEX3-CD73). Kyoto Encyclopedia of Genes and Genomes (KEGG) enrichment analysis revealed that CD73 is associated with the p53 signaling pathway, which is highly associated with cell senescence [20] (Supplementary Fig. 6). First, p53 expression in primary stellate cells was detected by western blotting. The results illustrated that the expression of p53 was significantly reduced in EtOH-fed+CCl4 mice compared to that in pair-fed mice (Fig. 2C). Similarly, p53 expression in LX-2 and HSC-T6 cells was tested using western blotting (Fig. 2D and E). We determined acetaldehyde- stimulating conditions for LX-2 cells by examining the expression of α-SMA and COL1a1 at different time periods and concentrations in advance (Fig. 2A and B). To determine the role of the p53 signaling pathway in ALF, we altered p53 expression in acetaldehyde-stimulated LX-2 cells and HSC-T6 cells by transfecting p53 overexpression plasmids or p53 siRNA. Cellular senescence was assessed using senescence-associated beta-galactosidase (SA-β-gal) activity and senescence markers p21 and p16. As shown in Figure 3B, D, E, and G, inhibition of p53 significantly decreased p21 and p16 protein expression and increased α-SMA and COL1a1 protein expression. Furthermore, as shown in Figure 3A, p53 inhibition resulted in a significant decrease in SA-β-gal activity. These results showed that silencing of p53 could inhibit senescence in HSC-T6 and LX-2 cells and promote acetaldehyde- stimulated α-SMA and COL1a1 upregulation. However, overexpression of p53 in LX-2 cells exerted the opposite effect (Fig. 3C and F).
p53 expression was elevated in EtOH-fed+CCl4 mice and in acetaldehyde-stimulated HSC-T6 and LX-2 cells. Western blot analysis of α-SMA and COL1a1 protein expression at different time periods (A) and varying concentrations (B). *P < 0.05, **P < 0.01, ***P < 0.001 vs. the 0 μM/ 0h group. The protein levels of p53 in Primary HSC cells (C), HSC-T6 cells (D) and LX-2 cells (E). *P < 0.05, ***P < 0.001 vs. the pair-fed/ control group.
The p53 signaling pathway regulated activation and senescence of hepatic stellate cells. (A) p53‐induced senescence as indicated by SA‐β‐Gal activities. Representative images of SA‐β‐Gal staining are presented. (B, D, E and G) Western blot analysis of p53, p21, p16, α-SMA and COL1a1 in HSC-T6 and LX-2 cells transfected with p53-siRNA. *P < 0.05, **P < 0.01, ***P < 0.001 vs. the control group. #P < 0.05, ##P < 0.01, ###P < 0.001 vs. the scrambled- siRNA-p53+Acetaldehyde group. (C and F) Western blot analysis of p53, p21, p16, α-SMA and COL1a1 in LX-2 cells transfected with pEX3-p53. *P < 0.05, **P < 0.01, ***P < 0.001 vs. the control group. #P < 0.05, ##P < 0.01, ###P < 0.001 vs. the pEX3-NC-p53+Acetaldehyde group.
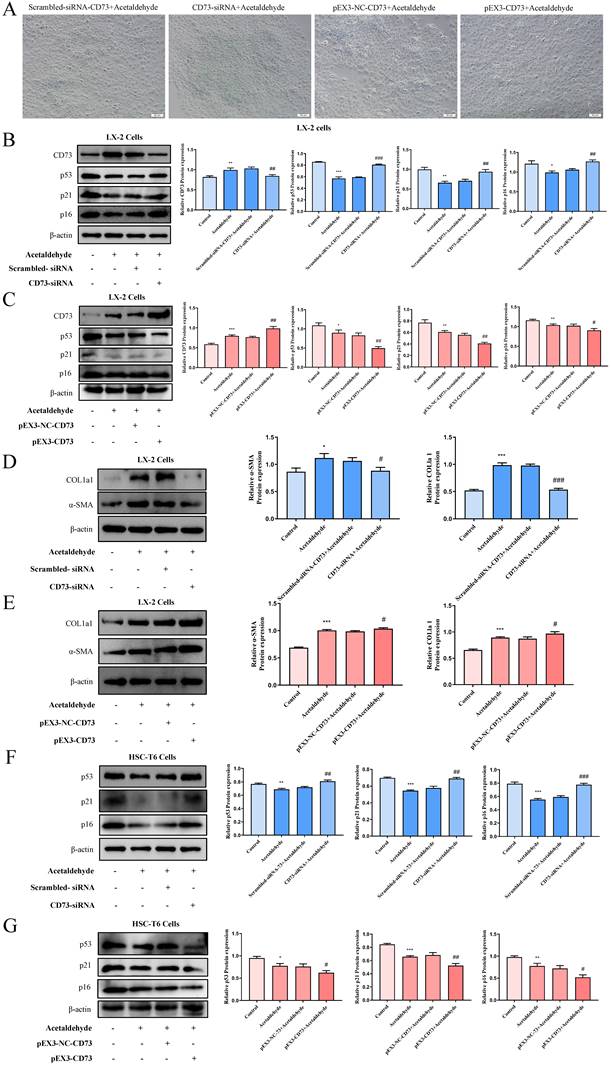
To investigate the regulatory effect of CD73 on the p53 signaling pathway, siRNA-CD73 and pEX3-CD73 were used. Silencing of CD73 increased the protein levels of p53, p21, and p16, while promoting SA-β-gal activity (Fig. 4A, B and F). In addition, the expression of α-SMA and COL1a1 decreased (Fig. 4D and Supplementary Fig. 4E). Conversely, overexpression of CD73 in HSC-T6 and LX-2 cells resulted in a decreased proportion of cellular senescence and increased expression of fibrotic factors (Fig. 4A, C, E, G and Supplementary Fig. 4F). Mechanistically, CD73 regulates hepatic stellate cell senescence via the p53 signaling pathway.
CD73 regulated the p53 signaling pathway. (A) Knockdown of CD73 increased the number of SA‐β‐Gal‐positive cells in activated LX‐2 cells. Representative images of SA‐β‐Gal staining are presented. (B, D and F) Western blot analysis of p53, p21, p16, α-SMA and COL1a1 in HSC-T6 and LX-2 cells transfected with CD73-siRNA. *P < 0.05, **P < 0.01, ***P < 0.001 vs. the control group. #P < 0.05, ##P < 0.01, ###P < 0.001 vs. the scrambled- siRNA-CD73+Acetaldehyde group. (C, E and G) Western blot analysis of p53, p21, p16, α-SMA and COL1a1 in HSC-T6 and LX-2 cells transfected with pEX3-CD73. *P < 0.05, **P < 0.01, ***P < 0.001 vs. the control group. #P < 0.05, ##P < 0.01 vs. the pEX3-NC-CD73+Acetaldehyde group.
AURKA was upregulated in liver tissue from patients with a history of alcohol consumption and acetaldehyde-stimulated HSC-T6 and LX-2 cells
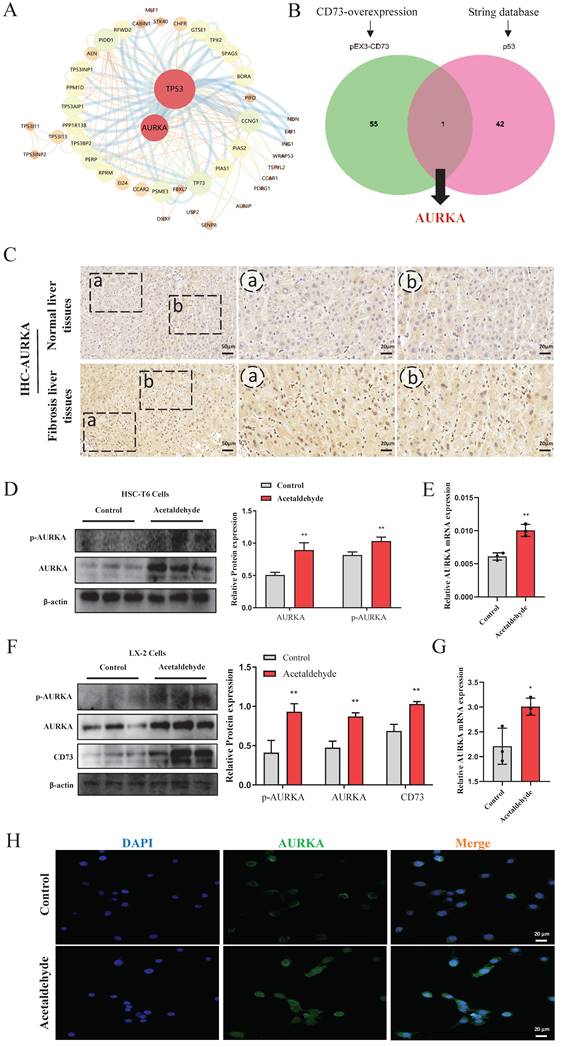
To further investigate the mechanism of CD73 in regulating hepatic stellate cell senescence, we compared the proteomic results of CD73 overexpression with the predicted p53 interacting proteins using the STRING database (Fig. 5A). Proteomic sequencing showed that 56 proteins were regulated after CD73 overexpression. The overlap between the proteomic and STRING databases was Aurora kinase A (AURKA) (Fig. 5B). AURKA is a cell cycle-regulated kinase that plays an important role in hepatocellular carcinoma; however, the role of CD73 in ALF is not known [21]. To explore the role of AURKA in ALF, we detected the protein expression of AURKA in patients with liver fibrosis and a history of alcohol consumption, and in HSC-T6 and LX-2 cells stimulated by acetaldehyde. We observed significant changes in AURKA expression in patients with liver fibrosis and a history of alcohol consumption (Fig. 5C). Similarly, the expression of AURKA in acetaldehyde- stimulated HSC-T6 and LX-2 cells showed a tendency to increase compared with the control group (Fig. 5D, E, F and G). We found that the expression of phosphorylated AURKA increased significantly (Fig. 5D and F). In addition, immunofluorescence results revealed that AURKA expression was increased following acetaldehyde stimulation and the nuclear expression levels of AURKA were increased (Fig. 5H).
Expression of AURKA was up-regulated in liver fibrosis patients with a history of alcohol consumption and acetaldehyde-stimulated HSC-T6 and LX-2 cells. (A) The proteins interacted with p53 were predicted by STRING database. (B) The overlap between proteomic and STRING was AURKA. (C) Representative pictures of AURKA immune staining were shown (20 μm and 50 μm). (D) Western blot analysis of AURKA and p-AURKA in acetaldehyde-stimulated HSC-T6 cells. (E) RT-qPCR analysis of AURKA in acetaldehyde-stimulated HSC-T6 cells. (F) Western blot analysis of CD73, AURKA and p-AURKA in acetaldehyde-stimulated LX-2 cells. (G) RT-qPCR analysis of AURKA in acetaldehyde-stimulated LX-2 cells. (H) Immunofluorescent staining of AURKA in acetaldehyde-stimulated LX-2 cells (20 μm). *P < 0.05, **P < 0.01 vs. the control group.
AURKA inhibition attenuated high levels of α-SMA and COL1a1 induced by acetaldehyde and promoted cellular senescence
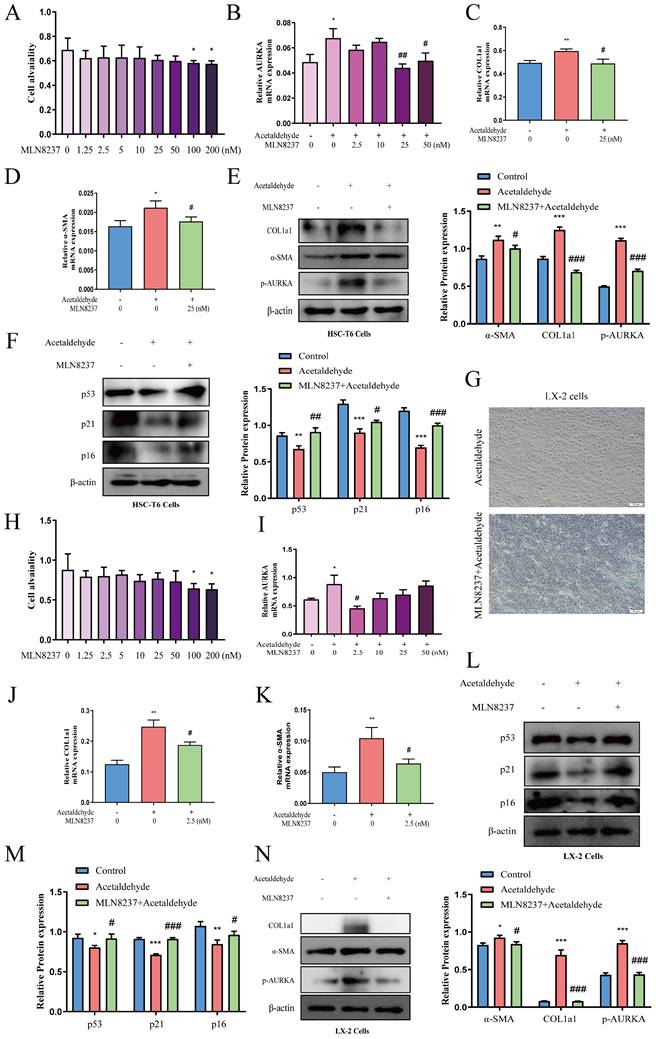
MLN8237, a selective AURKA inhibitor, was added to HSC-T6 and LX-2 cells to further explore the effect of AURKA on HSC activation and senescence. We first evaluated the effect of exposure to different concentrations of MLN8237 (1.25, 2.5, 5, 10, 25, 50, 100, and 200 nM) on cell viability using a CCK-8 assay. The results showed that MLN8237 concentrations higher than 100 nM significantly reduced the viability of HSC-T6 cells (Fig. 6A). Furthermore, the results of RT-qPCR showed that 25 nM MLN8237 was the concentration that had the best inhibitory effect on AURKA (Fig. 6B). In LX-2 cells, we used the same method to select 2.5 nM MLN8237 as the concentration used in the following experiments (Fig. 6H and I). The results of RT-qPCR and western blot analysis revealed that the inhibition of AURKA decreased the expression of p-AURKA, α-SMA, and COL1a1, and significantly increased the expression of p53, p21, and p16 compared with the acetaldehyde group (Fig. 6C-F, J-N). SA-β-Gal staining also showed that cellular senescence increased after MLN8237 treatment in LX-2 cells (Fig. 6G). These results suggest that AURKA inhibition attenuates acetaldehyde-stimulated fibrosis by promoting hepatic stellate cell senescence.
AURKA inhibition attenuated high levels of α-SMA and COL1a1 induced by acetaldehyde and promoted cellular senescence. (A and H) Effect of different concentrations of MLN8237 on HSC-T6 and LX-2 cells viability by CCK-8 assay. *P < 0.05 vs. the 0 nM group. (B and I) RT-qPCR analysis of AURKA in acetaldehyde-stimulated HSC-T6 and LX-2 cells treated with MLN8237. *P < 0.05 vs. the 0 nM group. #P < 0.05, ##P < 0.01 vs. the acetaldehyde group. RT-qPCR analysis of α-SMA (D and K) and COL1a1 (C and J) in acetaldehyde-stimulated HSC-T6 and LX-2 cells treated with MLN8237. (E, F, L, M and N) Western blot analysis of p53, p21, p16, α-SMA and COL1a1 in acetaldehyde-stimulated HSC-T6 and LX-2 cells treated with MLN8237. *P < 0.05, **P < 0.01, ***P < 0.001 vs. the control group. #P < 0.05, ##P < 0.01, ###P < 0.001 vs. the acetaldehyde group. (G) Inhibition of AURKA increased the number of SA‐β‐Gal‐positive cells in activated LX‐2 cells. Representative images of SA‐β‐Gal staining are presented.
CD73 regulated the activation and senescence of HSC-T6 and LX-2 cells via modulating ubiquitination of AURKA
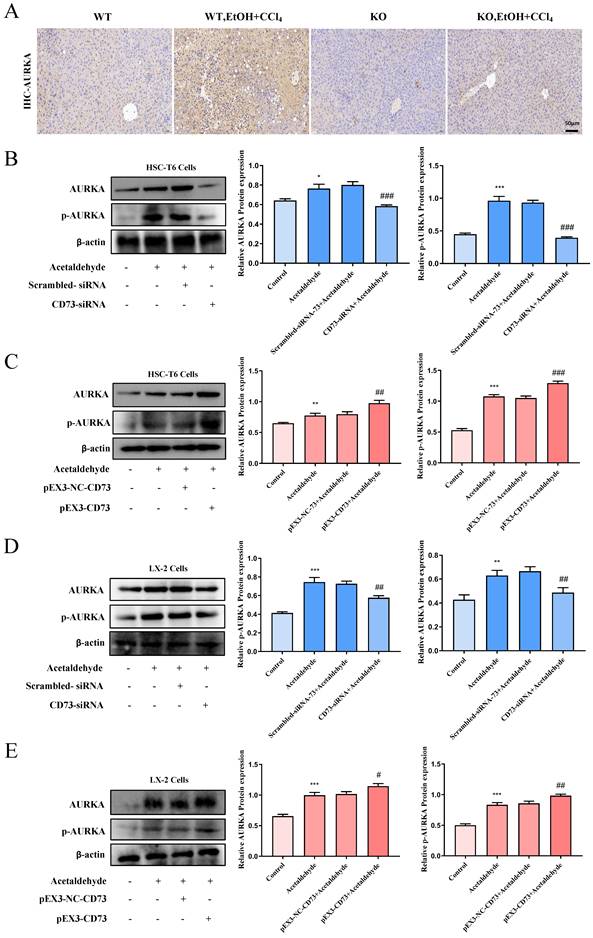
To determine whether CD73 has a regulatory effect on AURKA, we examined the phosphorylation level and the total expression level of AURKA after knockdown or overexpression of CD73 in HSC-T6 and LX-2 cells and observed that AURKA and p-AURKA protein levels significantly changed with CD73 expression (Fig. 7B, C, D and E). Analysis of immunohistochemical changes in mouse livers confirmed these results (Fig. 7A). Based on the CD73 model, we docked the target protein AURKA using ZDock. According to the ZDock score, ZRank score, and ClusterSize, 13 stable and conventional binding sites between CD73 and AURKA docking were found (Fig. 8B). Immunoprecipitation and double immunofluorescence staining were used to detect interactions between CD73 and AURKA. Immunofluorescence staining showed the co-localization of CD73 and AURKA in HSC-T6 cells (Fig. 8A). Co-immunoprecipitation analysis validated the interaction between CD73 and AURKA (Fig. 8C).
CD73 regulated AURKA positively. (A) Representative pictures of AURKA immune staining were shown (50 μm). (B and D) Western blot analysis of AURKA and p-AURKA in HSC-T6 and LX-2 cells transfected with CD73-siRNA. *P < 0.05, **P < 0.01, ***P < 0.001 vs. the control group. ##P < 0.01, ###P < 0.001 vs. the scrambled- siRNA-CD73+Acetaldehyde group. (C and E) Western blot analysis of AURKA and p-AURKA in HSC-T6 and LX-2 cells transfected with pEX3-CD73. **P < 0.01, ***P < 0.001 vs. the control group. #P < 0.05, ##P < 0.01, ###P < 0.001 vs. the pEX3-NC-CD73+Acetaldehyde group.
CD73 increased the stability of AURKA via the inhibition of its ubiquitin/ proteasome-dependent degradation. (A) Double immunofluorescence staining of CD73 (red) and AURKA (green) (5 μm). (B) Molecular docking analysis of molecular interactions between CD73 and AURKA. (C) Co-IP of CD73 and AURKA in HSC-T6 cells. The protein (D) and mRNA (E) levels of CD73 and AURKA in HSC-T6 cells transfected with pEX3-CD73 were measured by Western blot and RT-qPCR. **P < 0.01, ***P < 0.001 vs. the pEX3-NC-CD73 group. (F) Western blot analysis of AURKA in cells treated with CHX. **P < 0.01, ***P < 0.001 vs. the 0 μg/ml group. (G) HSC-T6 cells were treated by CHX with or without pEX3-CD73 for 0-9 h. **P < 0.01 vs. the CHX (6 h) or CHX (9 h). Western blot analysis of AURKA in HSC-T6 cells treated with ALLN (H), CQ (I) and MG132 (J). *P < 0.05 vs. the control group. (K) Western blot analysis of AURKA in HSC-T6 cells treated with MG132 and CD73-siRNA. *P < 0.05, **P < 0.01 vs. the scrambled-siRNA-CD73 group. &&&P < 0.001 vs. the CD73-siRNA group. (L) Impact of CD73 overexpression on AURKA ubiquitination in HSC-T6 cells.
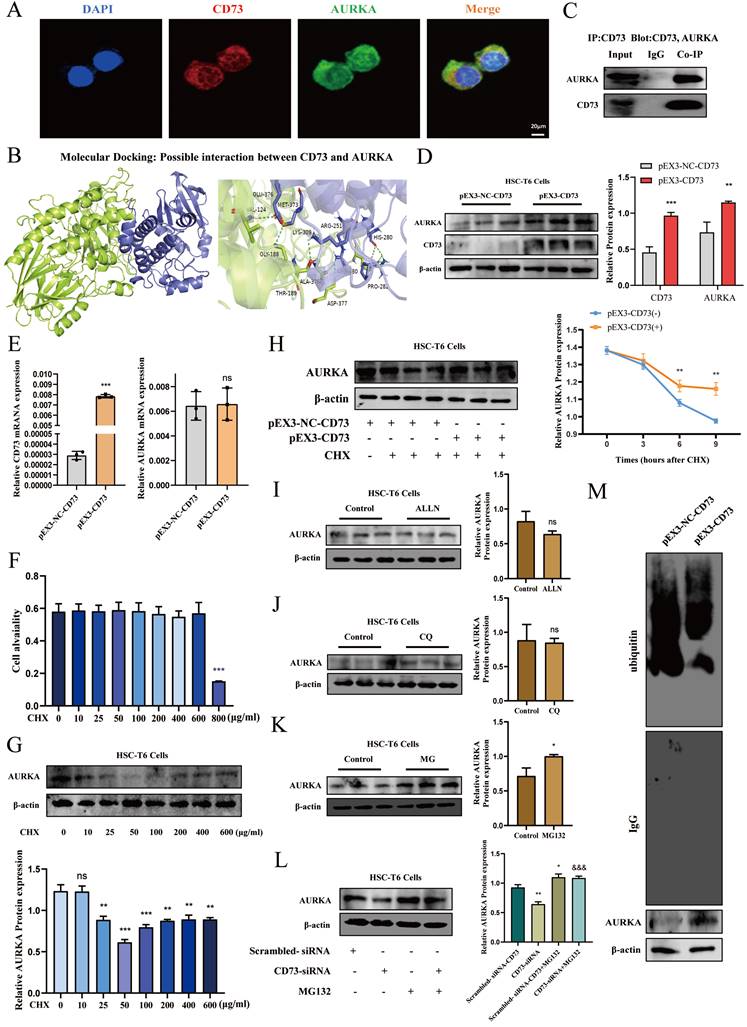
To explore the mechanism underlying the association between CD73 and AURKA, we examined whether the overexpression of CD73 affected AURKA expression and observed that pEX3-CD73 had no significant effect on AURKA mRNA levels (Fig. 8E). However, the overexpression of CD73 increased AURKA protein levels (Fig. 8D). These results suggested that CD73 may affect AURKA protein degradation. First, western blotting was used to determine the concentration of CHX (a protein synthesis inhibitor) in HSC-T6 cells (Fig. 8F). Moreover, following treatment with CHX, CD73 overexpression increased the half-life of the AURKA protein in HSC-T6 cells (Fig. 8G).
The major protein degradation pathways include the ubiquitin-proteasome system (UPS), autophagy-lysosomal pathway (ALP), and Ca2+-activated proteases (calpain) [22-24]. Chloroquine (CQ, 50 μM), N-[N-(N-Acetyl-L-leucyl)L-leucyl]-L-norleucine (ALLN, 5 μM), and MG-132 (1 μM) were used to inhibit lysosomes, Ca2+-activated protease calpain, and proteasomes, respectively. The western blot results indicated that the expression of AURKA was increased in HSC-T6 cells treated with MG132, but not with CQ and ALLN, indicating that the ubiquitin-proteasome pathway mediates the degradation of AURKA (Fig. 8H, I and J). Furthermore, as shown in Fig. 8K, the degradation of AURKA in cells silencing CD73 was blocked by MG132. The results showed that the ubiquitination levels of AURKA were significantly decreased in CD73-overexpressing cells, whereas the ubiquitination levels of AURKA increased in cells that underwent CD73 knockdown (Fig. 8L). Collectively, these results indicated that CD73 increased the stability of AURKA by inhibiting its ubiquitin/proteasome-dependent degradation.
Discussion
About 3 million people in the Western World die of alcohol-related diseases every year, the most common of which is ALD. Although there are some drugs for the treatment of ALD on the market, the research is still immature, and the treatment is only limited to abstaining from alcohol [25]. To date, there are no direct antifibrotic therapies approved for liver fibrosis, and there is a lack of research on the treatment of ALF. One of the main reasons is the difficulty in finding animal models that mimic the human disease process. Simply using alcohol to induce liver fibrosis in mice can only slightly increase the early markers of liver fibrosis, which cannot well represent the formation of ALF [26]. Although the use of CCl4 alone can induce significant liver fibrosis, it is not consistent with the etiology of human chronic liver disease [27]. Therefore, in this experiment, the combination of alcohol and CCl4 was used to establish a mouse model to achieve a higher similarity with the human disease [28].
The CD39-CD73-adenosine signaling pathway has emerged as a potential therapeutic target for translational medicine and has received more and more attention, especially in cancer immunotherapy [29-31]. Recent studies have demonstrated that CD73 has been identified as a specific immunotherapy target that improves antitumor immune responses to immune checkpoint therapy in glioblastoma [32]. CD73 also plays an important role in the progression and metastasis of hepatocellular carcinoma [33]. The use of CD39 inhibitors has also been put into clinical trials [34]. Adenosine, as an important product of ATP hydrolysis by CD39 and CD73 in the body, participates in the regulation of many physiological and pathological processes in the body by activating adenosine receptors [35]. The two sides of purinergic signaling has been reported in Nature [36]. Therefore, we observed the expression of CD39 and CD73 during the formation of alcohol-related liver fibrosis. The results showed that the expression of CD39 and CD73 increased in the EtOH-fed+CCl4 group from the second week. Interestingly, inhibition of CD39 or CD73 aggravated inflammation [37, 38]. Based on the previous experimental results, we believe that the increase of CD39 and CD73 in early-fibrotic-stage was a body's self-protection to liver inflammation. This is consistent with the conclusion confirmed in other studies that although adenosine has a certain anti-inflammatory effect in the short term, the long-term effect can promote the occurrence of fibrosis [39]. In future studies we will further explore the specific mechanism of the CD39-CD73-adenosine axis in ALI and ALF. Furthermore, we compared the effects of CD39 and CD73 on the activation and proliferation of HSCs. Western blot, RT-qPCR and flow cytometry results showed that inhibiting CD73 alone can more significantly inhibit the activation and proliferation of HSCs. As a result, we believe that CD73, rather than CD39, was a more critical role in ALF.
The senescence of activated HSCs is an important step in limiting the fibrogenic response to tissue damage. After stopping proliferate, the levels of extracellular matrix-degrading enzymes were increased, while the expression of matrix components was decreased in HSCs [40]. The results of proteomic sequencing in HSCs showed that overexpression of CD73 has an impact on the p53 signaling pathway. Multiple lines of evidence indicate that p53 is activated in response to cellular stress, to regulate apoptosis or cell cycle, thereby affecting the aging process [41-43]. Studies have shown that the deletion of p53 and the senescence of HSCs contribute to alleviation of CCl4-induced liver fibrosis [44, 45]. And a recent study demonstrated that adenosine/A2B signaling links muscle and brown adipose tissue (BAT) and has both anti-ageing and anti-obesity potential, suggesting that the purine signaling pathway is related to cellular aging [46]. In our study, overexpression of p53 induced HSCs senescence with an increase of SA-beta-gal activity, increased expression of p21 and p16, and increased acetaldehyde-induced fibrosis. Furthermore, knockdown of CD73 leads to cellular senescence of HSCs as evidenced by increased SA-beta-gal activity and p21 and p16 protein levels, the protein levels of α-SMA and COL1a1 were also decreased. These results demonstrate that CD73 can regulate fibrosis by regulating cellular senescence.
The regulatory mechanism of CD73 on cellular senescence in ALF was further explored. We found an intersection between the proteomic results of overexpression of CD73 and the results of proteins interacting with p53, that is AURKA. AURKA, a cell cycle-regulated kinase, is an important regulator of mitotic progression and plays an important role in regulating spindle assembly, chromosome segregation, and cytokinesis [47]. Activation of AURKA has been shown to have an important role in a broad range of cancers, and its inhibitors have been subjected to clinical trials as monotherapies or in combination with classic chemotherapy or other targeted therapies [48]. Recent studies have shown that inhibition of AURKA can reduce renal fibrosis in patients with chronic kidney disease [49]. However, the role of AURKA in ALF is still lacking research. Studies have shown that AURKA can participate in the regulation of p53 downstream signaling through multiple pathways, affecting growth arrest and apoptosis pathways [50]. MLN8237 can promote cellular senescence and attenuates acetaldehyde-induced fibrosis. As far as we know, this is the first investigation about AURKA in fibrosis progression in vitro. We will further investigate the role and mechanism of AURKA in ALF in future studies. Molecular docking data suggested CD73 might bind with AURKA, which was confirmed by Co-IP and immunofluorescence double staining. Meanwhile, we found CD73 stabilized AURKA by inhibiting its ubiquitination and degradation, which is consistent with the reported AURKA degradation pathway [51].
Conclusions
In conclusion, the current study provides the evidence that overexpression of CD73 inhibits the degradation of AURKA by increasing its interaction with AURKA, thereby inhibiting cellular senescence and aggravating ALF. Therefore, targeting CD39-CD73-adenosine axis may be a promising strategy for the treatment of ALD.
Supplementary Material
Supplementary figures.
Acknowledgements
This study was supported by the National Natural Science Foundation of China (No. 81970518).
Author contributions
Xiongwen Lv, Zhenni Liu and Baoming Wu designed this study and wrote the manuscript. Xueqi Liu, Xue Wu, Junnan Cai, Xiaodong Sheng and Mengda Zhang participated in WB and Q-PCR experiments. Junrui Xu provided human liver tissues. Jiyu Du, Guoqing Xia, Hong Zhu and Tao Xu performed data analysis. All authors approved the manuscript.
Competing Interests
The authors have declared that no competing interest exists.
References
1. Pda A, Ctr B, Aksm C. Epidemiology of Alcohol Consumption and Societal Burden of Alcoholism and Alcoholic Liver Disease - ScienceDirect. Clin Liver Dis. 2019;23(1):39-50
2. GBD 2020 Alcohol Collaborators. Population-level risks of alcohol consumption by amount, geography, age, sex, and year: a systematic analysis for the Global Burden of Disease Study 2020. Lancet. 2022;400(10347):185-235
3. Peacock A, Leung J, Larney S. et al. Global statistics on alcohol, tobacco and illicit drug use: 2017 status report. Addiction. 2018;113(10):1905-26
4. Wen-Jun Wang, Peng et al. Growing burden of alcoholic liver disease in China: A review. World J Gastroentero. 2019;25:12
5. Singal AK, Mathurin P. Diagnosis and Treatment of Alcohol-Associated Liver Disease: A Review. JAMA: the journal of the American Medical Association. 2021;326(2):165-76
6. Singh S, Osna NA, Kharbanda KK. Treatment options for alcoholic and non-alcoholic fatty liver disease: A review. World J Gastroentero. 2017;23(36):6549-70
7. Seitz HK, Bataller R, Cortez-Pinto H. et al. Alcoholic liver disease. Nat Rev Dis Primers. 2018;4:16
8. Louvet A, Mathurin P. Alcoholic liver disease: mechanisms of injury and targeted treatment. Nat Rev Gastro Hepat. 2015;12(4):231-42
9. Gao B, Bataller R. Alcoholic Liver Disease: Pathogenesis and New Therapeutic Targets. Gastroenterology (New York, N.Y. 1943). 2011;141(5):1572-85
10. Higashi T, Friedman SL, Hoshida Y. Hepatic stellate cells as key target in liver fibrosis. Adv Drug Deliver Rev. 2017;121:27-42
11. Puche JE, Saiman Y, Friedman SL. Hepatic stellate cells and liver fibrosis.Compr Physiol. 2013; 3 (4): 1473-92
12. Verkhratsky A, Burnstock G. Biology of purinergic signalling: its ancient evolutionary roots, its omnipresence and its multiple functional significance. Bioessays. 2014;36(7):697-705
13. Lisa A, Giuliani, Clara A. et al. Extracellular nucleotides and nucleosides as signalling molecules. Immuno Lett. 2018:16-24
14. Fernández P, Perez-Aso M, Smith G. et al. Extracellular Generation of Adenosine by the Ectonucleotidases CD39 and CD73 Promotes Dermal Fibrosis. Am J Pathol. 2013;183(6):1740-46
15. Peng ZW, Rothweiler S, Wei G. et al. The ectonucleotidase ENTPD1/CD39 limits biliary injury and fibrosis in mouse models of sclerosing cholangitis. Hepatology Communications. 2017 1
16. Yang S, Lei Z, Mingzhe Y. et al. TRPV4 Channel Inhibits TGF-β1-Induced Proliferation of Hepatic Stellate Cells. Plos One. 2014;9(7):e101179
17. Liu ZN, Jia WQ, Jiang T. et al. Regulation of CD39 expression in ATP-P2Y2R-mediated alcoholic liver steatosis and inflammation. Int Immunopharmacol. 2019;77:105915
18. Shuai C, Xia GQ, Yuan F. et al. CD39-mediated ATP-adenosine signalling promotes hepatic stellate cell activation and alcoholic liver disease. Eur J Pharmacol. 2021: 174198.
19. Jia WQ, Zhou TC, Dai JW. et al. CD73 regulates hepatic stellate cells activation and proliferation through Wnt/β-catenin signaling pathway. Eur J Pharmacol. 2020;890:173667
20. Rufini A, Tucci P, Celardo I. et al. Senescence and aging: the critical roles of p53. Oncogene. 2013;32(43):5129-43
21. Li X, Xu W, Kang W. et al. Genomic analysis of liver cancer unveils novel driver genes and distinct prognostic features. Theranostics. 2018;8(6):1740-51
22. Aaron Ciechanover. Intracellular protein degradation: From a vague idea thru the lysosome and the ubiquitin-proteasome system and onto human diseases and drug targeting. Best practice & research. Clinical haematology. 2017;30(4):341-55
23. Pan T, Seiji K, Le W. et al. The role of autophagy-lysosome pathway in neurodegeneration associated with Parkinson's disease. Brain A Journal of Neurology. 2008;131(8):1969-78
24. Eskelinen EL, Saftig P. Autophagy: a lysosomal degradation pathway with a central role in health and disease. Biochimica Et Biophysica Acta Molecular Cell Research. 2009;1793(4):664-73
25. Testino G, Leone S, Fagoonee S. et al. Alcoholic liver fibrosis: detection and treatment. Minerva Med. 2018;109(6):457-71
26. Gao B, Xu MJ, Bertola A. et al. Animal Models of Alcoholic Liver Disease: Pathogenesis and Clinical Relevance. Gene Expression - The Journal of Liver Research. 2017;17(3):173-86
27. Tsuchida T, Lee YA, Fujiwara N. et al. A simple diet- and chemical-induced murine NASH model with rapid progression of steatohepatitis, fibrosis and liver cancer. J Hepatol. 2018;69(2):385-95
28. Brol MJ, Rsch F, Schierwagen R. et al. Combination of CCL4 with alcoholic and metabolic injuries mimics human liver fibrosis. AJP Gastrointestinal and Liver Physiology. 2019;317(1):G182-94
29. Kazemi MH, Raoufi S, Hojjat-Farsangi M. et al. Adenosine and adenosine receptors in the immunopathogenesis and treatment of cancer. J Cell Physiol. 2018;233:2032-57
30. Ghasem Ghalamfarsa, Mohammad et al. CD73 as a potential opportunity for cancer immunotherapy. Expert Opin Ther Tar. 2018;23:127-42
31. Leone RD, Emens LA. Targeting adenosine for cancer immunotherapy. J Immunother Cancer. 2018;6(1):57
32. Goswami S, Walle T, Cornish AE. et al. Immune profiling of human tumors identifies CD73 as a combinatorial target in glioblastoma. Nat Med. 2020;26(1):39-46
33. Ma X, Shen M, Hu B. et al. CD73 promotes hepatocellular carcinoma progression and metastasis via activating PI3K/AKT signaling by inducing Rap1-mediated membrane localization of P110β and predicts poor prognosis. J Hematol Oncol. 2019;12(1):37
34. Moesta AK, Li X, Smyth MJ. Targeting CD39 in cancer. Nature reviews. Immunology. 2020;20(12):739-55
35. Faas MM, Sáez T, Vos PD. Extracellular ATP and adenosine: The Yin and Yang in immune responses? Mol Aspects Med. 2017;55:9
36. Idzko M, Ferrari D, Eltzschig HK. Nucleotide signalling during inflammation. Nature. 2014;509(7500):310
37. Liu Z, Wu X, Fang Q. et al. CD73 Attenuates Alcohol-Induced Liver Injury and Inflammation via Blocking TLR4/MyD88/NF-κB Signaling Pathway. Journal of Inflammation Research. 2022;15:53-70
38. Liu Z, Jia W, Jiang T. et al. Regulation of CD39 expression in ATP-P2Y2R-mediated alcoholic liver steatosis and inflammation. Int Immunopharmacol. 2019;77:105915
39. Davide Ferrari, Roberto Gambari. et al. Purinergic signaling in scarring. Faseb J. 2016;30:3-12
40. Krizhanovsky V, Yon M, Dickins RA. et al. Senescence of Activated Stellate Cells Limits Liver Fibrosis. Cell. 2008;134(4):657-67
41. Biol N. Cellular senescence: when bad things happen to good cells. Nat Rev Mol Cell Biol. 2007;8:729-40
42. He L, He X, Lowe SW. et al. microRNAs join the p53 network-another piece in the tumour-suppression puzzle. Nat Rev Cancer. 2007;7(11):819-22
43. Tyner SD, Venkatachalam S, Choi J. et al. p53 mutant mice that display early ageing-associated phenotypes. Nature. 2002;415(6867):45
44. Kong X, Feng D, Wang H. et al. Interleukin-22 induces hepatic stellate cell senescence and restricts liver fibrosis in mice. Hepatology. 2012;56(3):1150-59
45. Yang J, Lu Y, Yang P. et al. MicroRNA-145 induces the senescence of activated hepatic stellate cells through the activation of p53 pathway by ZEB2. J Cell Physiol. 2019;234:7587-99
46. Gnad T, Navarro G, Lahesmaa M. et al. Adenosine/A2B Receptor Signaling Ameliorates the Effects of Aging and Counteracts Obesity - ScienceDirect. Cell Metab. 2020;32:56-70
47. Wu C, Junfang L, Ju YE. et al. Targeting AURKA-CDC25C axis to induce synthetic lethality in ARID1A-deficient colorectal cancer cells. Nat Commun. 2018;9(1):3212
48. Du R, Huang C, Liu K. et al. Targeting AURKA in Cancer: molecular mechanisms and opportunities for Cancer therapy. Mol Cancer. 2021;20(1):15
49. Mja B, Mi B, Shuang X. et al. Blocking AURKA with MK-5108 attenuates renal fibrosis in chronic kidney disease. Biochimica et Biophysica Acta (BBA) - Molecular Basis of Disease. 2021;1867:166227
50. Kaori S, Warapen T, Kai K. et al. Functional Significance of Aurora Kinases-p53 Protein Family Interactions in Cancer. Front Oncol. 2016;6:247
51. Zhang C, Qu L, Lian S. et al. PRL-3 Promotes Ubiquitination and Degradation of AURKA and Colorectal Cancer Progression via Dephosphorylation of FZR1 [Journal Article; Research Support, Non-U.S. Gov't]. Cancer Res. 2019;79(5):928-40 eng
Author contact
![]() Corresponding author: Professor Xiongwen Lv, School of Pharmacy, Anhui Medical University, 81 Mei Shan Road, Hefei, Anhui Province,230032, China. E-mail: lyuxwedu.cn; xiongwen_lv2019com.
Corresponding author: Professor Xiongwen Lv, School of Pharmacy, Anhui Medical University, 81 Mei Shan Road, Hefei, Anhui Province,230032, China. E-mail: lyuxwedu.cn; xiongwen_lv2019com.