Impact Factor ISSN: 1449-2288
- Issue 12; 2026
- Issue 11; 2026
- Issue 10; 2026
- Issue 9; 2026
- Issue 8; 2026
- Volume 22; 2026
- Past Issues
- Advance Articles
- Editorial Board
- Cover Images
- Index & Coverage
- Cover Suggestion
- Special Issues
Introduction
Materials and Methods
Results
Discussion
Supplementary Material
Acknowledgements
References

 Global reach, higher impact
Int J Biol Sci 2023; 19(13):4103-4122. doi:10.7150/ijbs.85724 This issue Cite
Research Paper
Squalene epoxidase/SQLE is a candidate target for treatment of colorectal cancers with p53 mutation and elevated c-MYC expression
Yuyun Du1,*, Matjaz Rokavec1,*, Heiko Hermeking1,2,3 ![]()
1. Experimental and Molecular Pathology, Institute of Pathology, Medical Faculty, Ludwig-Maximilians-Universität München, D-80337 Munich, Germany.
2. German Cancer Consortium (DKTK), Partner site Munich, D-80336 Munich, Germany.
3. German Cancer Research Center (DKFZ), D-69120 Heidelberg, Germany.
*: these authors contributed equally to this work
Received 2023-4-29; Accepted 2023-7-30; Published 2023-8-6
Abstract

Elevated expression of c-MYC and inactivation of p53 represent two of the most common alterations in colorectal cancer (CRC). However, c-MYC and defective p53 are difficult to target therapeutically. Therefore, effectors downstream of both c-MYC and p53 may represent attractive, alternative targets for cancer treatment. In a bioinformatics screen we identified Squalene epoxidase/SQLE as a candidate therapeutic target that appeared to be especially relevant for cell survival in CRCs, which display elevated c-MYC expression and loss of p53 function. SQLE is a rate-limiting enzyme in the cholesterol synthesis. Here, we show that p53 supresses SQLE expression, cholesterol levels, and cell viability via the induction of miR-205, which directly targets SQLE. Furthermore, c-MYC induced SQLE expression directly and via its target gene AP4. The transcription factor AP4/TFAP4 directly induced SQLE expression and cholesterol levels, whereas inactivation of AP4 resulted in decreased SQLE expression and caused resistance to Terbinafine, an inhibitor of SQLE. Inhibition of SQLE decreased viability of CRC cells. This effect was enhanced in CRCs cells with p53 inactivation and/or enhanced c-MYC/AP4 expression. Altogether, our results demonstrate that SQLE represents a vulnerability for CRCs with p53 inactivation and elevated c-MYC activity.
Keywords: SQLE/Squalene epoxidase, cholesterol synthesis, p53, miR-205, c-MYC, AP4, TFAP4, colorectal cancer, Terbinafine, therapy
Introduction
Colorectal cancer (CRC) is the third most commonly diagnosed malignancy and the second leading cause of cancer mortality, responsible for about 900.000 deaths world-wide annually [1]. The 5-year survival rate of CRC patients is ~64% but drops to ~12% for metastatic CRC [2]. Treatment consists of surgery, combined with radio-, chemo- and targeted therapy for advanced CRCs. Targeted therapy targets factors specifically altered in cancer cells or the tumor microenvironment to selectively impede tumor growth and spread while limiting damage to healthy cells [3]. In contrast to other cancer types, such as breast cancer, where therapies targeting the estrogen receptor with Tamoxifen or the HER2-receptor with Herceptin are used in standard care, targeted therapy so far only resulted in marginal improvement of CRC patient survival. A reason for this may be that the appropriate targets for CRC have not been identified yet. Today, therapies targeting EGFR, BRAF, KRAS, HER2, NTRK and VEGF, as well as the immune-checkpoint inhibitors have been approved for treatment of a subset of metastatic CRC [4, 5]. Therefore, the identification of novel, innovative targets for CRC treatment is of high relevance. Two of the most common alterations in CRC are the elevated/deregulated expression of c-MYC by mutations in the Wnt/APC/β-catenin pathway and inactivating mutations in p53 [6]. Therefore, the combination of both events represents a vulnerability specific for the majority of CRC cancers.
The oncogenic transcription factor c-MYC is a central driver in many human cancers, including CRC [7]. The c-MYC gene represents a nodal point of many signaling pathways and is therefore ubiquitously up-regulated in cancer cells without having to be itself altered or mutated [6]. In cancer cells, c-MYC drives the transition to proliferative and invasive adenocarcinomas that display a highly inflammatory, angiogenic and immune-suppressed stroma [8, 9]. High c-MYC protein levels not only drive tumor initiation and progression, but are also essential for tumor maintenance, making c-MYC a highly attractive target for anti-cancer therapy [10]. Permanent activation of Wnt signaling is one of the key events in CRC and is in most cases driven by the loss of APC [11]. The c-MYC promoter is a direct target of the Wnt/β-catenin/Tcf4 signaling in CRC cells and is therefore consistently activated after mutation of APC or β-catenin [12]. Deletion of c-MYC prevented the phenotypes of perturbed differentiation, migration, proliferation and apoptosis, which occur upon inactivation of APC, indicating that c-MYC represents a critical mediator of the early stages of neoplasia following APC loss [13]. This suggests that inhibition of c-MYC may be an efficient therapeutic strategy for treating or preventing CRC. However, c-MYC does not represent an easily druggable protein, since it lacks enzymatic activity or any deep pocket, which could be targeted by small molecule inhibitors [14]. Therefore, the inhibition of c-MYC regulators, co-factors, or factors down-stream of c-MYC that are required for the oncogenic functions of c-MYC is an attractive, alternative approach for the treatment of c-MYC-driven tumors.
The p53 protein mainly functions as a transcription factor that activates target genes, which mediate tumor suppression by inducing cell cycle arrest, cell death and senescence, as well as by suppressing glycolysis, EMT and numerous other processes relevant for tumor formation and progression [15]. P53 is activated by diverse forms of cellular stress, which have in common that they lead to DNA damage: e.g. telomere attrition and oncogene-induced replication stress. The p53 gene is the most frequently mutated gene in human cancer. In CRC, the mutation frequency of p53 is about 60% [6] and almost 80% in metastatic CRCs [16]. Since p53 is a tumor suppressor, that is commonly inactivated/lost in tumors, it is hard to target therapeutically. An attractive, alternative approach for the treatment of tumors that harbor p53 mutations is to target factors or processes that are induced/activated/de-repressed upon p53 inactivation. Such factors/processes might represent vulnerabilities specific for cancer cells with p53 inactivation.
In a bioinformatics screen we identified squalene epoxidase (SQLE) as a potential therapeutic target for CRCs with elevated c-MYC activity and inactivation of p53. SQLE is a rate-limiting enzyme in the synthesis of cholesterol [17]. Tumor cell proliferation is highly dependent on sterol biosynthesis, and oncogenic processes altering this pathway likely represent a mechanism of metabolic adaptation, supporting rapid proliferation and survival of cancer cells [18]. Here we show that c-MYC induces SQLE expression not only directly but to a large extent via the AP4 transcription factor. Furthermore, we identified miR-205 as a mediator of the repression of SQLE by p53. Finally, we show that pharmacological inhibition of SQLE suppresses CRC cell viability, which is more pronounced in p53-deficient CRC cells with high c-MYC expression, suggesting that SQLE represents a vulnerability of CRCs with p53 inactivation and elevated c-MYC activity.
Materials and Methods
Cell culture, treatments and transfections
Cells were maintained in McCoy' 5A medium (Invitrogen, Carlsbad, CA, USA) supplemented with 10% fetal bovine serum (FBS) (Invitrogen) including 100 units/ml penicillin and 0.1 mg/ml streptomycin. All cells were cultivated in a 5% CO2 humidified incubator at 37°C. HCT116, RKO, and SW48 p53-/- and p53+/+ cells were a gift from Bert Vogelstein (Johns Hopkins Medical School, Baltimore, Maryland, USA) [19]. Human intestinal fibroblasts (CCD-18co) were obtained from ATCC (Wesel, Germany). The generation of AP4-deficient DLD1 and SW480 cells has been previously described [20]. Doxycycline (DOX; Sigma, St Louis, MO) was dissolved in water (100 mg/mL stock solution) and applied at a final concentration of 100 ng/ml. To maintain cell pools harboring pRTR vectors [20], a final concentration of 8 μg/ml puromycin was used and added newly with fresh medium every two days. Nutlin-3a (Sigma) treatment was performed at a final concentration of 10 μM for 48 hours. The SQLE inhibitors Terbinafine hydrochloride (T8826) was purchased from Sigma-Aldrich and dissolved in DMSO at a stock concentration of 50 mM and stored at -20°C. Cholesterol (Sigma-Aldrich, #C3045) was dissolved in CHCl3 (stock concentration 10 mM) and the working concentration was 20 μg/ml. pRTR vectors were transfected with Lipofectamine® LTX & PLUS™ Reagent (Invitrogen). Generation of cell pools harboring pRTR vectors and containing over 80% of fluorescent marker protein-expressing cells was performed as described before [20] and included selection with Puromycin. MiRNA mimics, siRNAs and negative controls were transfected with Lipofectamine RNAiMAX Transfection Reagent (Invitrogen) according to manufacturer's instructions. FlexiTube siRNAs (consisting of a pool of 4 different siRNAs) targeting SQLE and c-MYC), control siRNAs, miR-205-5p mimics, antagomirs and controls were obtained from Qiagen (Hilden, Germany). Sequences are given in Supplemental Table 1.
Western blot analysis
After lysis with RIPA lysis buffer (50 mM Tris/HCl pH 8.0, 250 mM NaCl, 1% NP40, 0.5% [w/v] sodium deoxycholate, 0.1% SDS), that contained protease inhibitors as well as PhosSTOP Phosphatase Inhibitor Cocktail Tablets (Roche), cell lysates were subjected to sonication for a 5-second period at the 20 kHz frequency and 20-minute centrifugation at 13,000 rpm and 4°C. Protein-containing supernatants were harvested for quantification with Pierce™ BCA Protein Assay Kit (Thermo Fisher Scientific). 30 μg protein aliquots were separated by 10% sodium dodecyl sulfate (SDS) polyacrylamide gel electrophoresis and transferred on Immobilon PVDF membranes (Millipore, Burlington, MA, USA) according to standard protocols (Bio-Rad Laboratories, Hercules, CA). For immunodetection membranes were incubated with antibodies listed in Supplemental Table 2. Signals from horse-radish-peroxidase (HRP)-coupled secondary antibodies were generated by enhanced chemiluminescence (Millipore) and recorded with a LI-COR Odyssey FC imaging system (Bad Homburg, Germany).
Cell viability
1500 cells were seeded per well into 96-well plates in triplicates. Cell viability was determined using the Cell Counting Kit-8 (CCK-8, Dojindo) or CellTiter-Glo kits (Promega) according to manufacturer's instructions. Absorbance at 450 nm was determined using a Varioscan system (Thermo Fisher).
Real‑time impedance measurements
Impedance measurements (Xcelligence RTCA DP, Roche) were performed to analyze cell proliferation. Cells (2 x 10³/well) were inoculated into 48-well microtiter plates (EPlate Cardio 96, Agilent, Santa Clara, CA, USA). Treatments were applied in triplicates and cell impedance was then recorded at 60-minute intervals for 200 hours using a X-celligence system (Roche) and analysed with RTCA software (Roche). Finally, a Neubauer chamber was used for counting cell at the endpoint to validate impedance measurements.
RNA extraction and quantitative real‑time polymerase chain reaction (qPCR) assay
Total RNA was isolated using the High Pure RNA Isolation Kit (Roche) according to manufacturer's instructions. cDNA was prepared using 500 ng RNA and the Verso cDNA synthesis kit (Thermo Fisher Scientific, Waltham, MA). qPCR was conducted on a LightCycler 480 (Roche) system with Fast SYBR Green Master Mix (Applied Biosystems, Foster City, CA). GAPDH or β-actin was used as the internal reference for normalizing gene expression by the ΔΔCt approach [21]. Results are represented as fold change after treatment or transfection relative to control. Each assay was carried out in triplicates. The sequences of oligonucleotides used as qPCR primers are listed in Supplemental Table 3.
3'-UTR reporter generation
An online miRNA prediction tool (Targetscan) was utilized to identify miR-205 binding sites in the 3'-UTR of SQLE mRNA. The full length 3'-UTR of human SQLE mRNA was amplified by PCR amplified from cDNA collected from SW48 cells. After inserting the PCR product in the pGL3-control-MCS vector it was validated by sequencing. For modification of the miR-205-5p seed-matching sequence (SMS) within the SQLE 3′-UTR we used the Mut Express® MultiS Fast Mutagenesis Kit V2 (Vazyme, China) according to manufacturer's instructions. The sequences of oligonucleotides used for cloning and mutagenesis are listed in Supplemental Table 4.
Dual luciferase assay
H1299 cells (3 × 10⁴/well) were seed into 12-well plates. After 24 hours cells were transfected with specific pGL3 firefly luciferase reporter plasmids (100 ng), Renilla plasmid (20 ng, normalization control) and miR-205-5p mimic (25 nM, 339173, Qiagen) or negative control (NC) for 48 hours using HiPerFect Transfection Reagent (Qiagen). Afterwards, the Dual Luciferase Reporter assay kit (Promega) was employed to analyze luciferase activities using Orion II Microplate Luminometer (Berthold, Germany) and the Simplicity software package.
Cholesterol content analysis
Cholesterol levels were detected in 106 cells using a Cholesterol/Cholesterol Ester Quantification kit (ab65359, Abcam) according to manufacturer's instructions. The assay was carried out in triplicates.
Chromatin immunoprecipitation assay
Chromatin immunoprecipitation (ChIP) was performed in SW480 cells using the iDeal ChIP-qPCR kit (Diagenode, Belgium) according to manufacturer's instruction. Antibodies and sequences of qChIP primers are provided in Supplemental Table 2 and 5, respectively.
Bioinformatics analysis of public datasets
Cancer cell dependency datasets and characteristics for CRC cell lines were retrieved from the Cancer Dependency Map (DepMap; https://depmap.org/portal/). c-MYC- and p53-regulated genes were identified based on datasets from the NCBI Gene Expression Omnibus (GEO). The regulation of the expression of these genes was assessed using gene expression profiling datasets of cell lines/tissues with ectopic expression or knockdown (KD) of c-MYC or treatment with p53-inducing compounds. Expression and clinical data of the TCGA colon adenocarcinoma (COAD) and rectal adenocarcinoma (READ) cohorts was obtained from the MD Anderson standardized data browser (http://bioinformatics.mdanderson.org/TCGA/databrowser/). The RNA-Seq by Expectation-Maximization (RSEM) normalized expression values from the Illumina RNASeqV2 (genes) datasets were used. Expression and clinical data of other CRC patient datasets was downloaded from NCBI GEO (www.ncbi.nlm.nih.gov/geo). Differential expression between tumors and adjacent normal colon tissue was calculated by paired t-test. Differential expression between tumors of different stages was calculated using 1-way ANOVA with a post-test for linear trend from stage 1 to stage 4. The statistics for survival analysis was calculated by log-rank test. For binary classification of cases (high/low expression), the Survminer R-package (https://CRAN.R-project.org/package=survminer) was used to determine optimal cutoff values. The CMS and CRIS classification of public datasets was obtained from Guiney et al [22] and Isella et al [23].
Statistical analysis
Correlations were determined using the Pearson correlation coefficient and two-tailed p-value provided by GraphPad prism 7.0. Correlations with p-values less than 0.05 were considered significant. The statistical differences between two groups were calculated using a Student's t test (two-tailed; unpaired). One-way analysis of variance (ANOVA) with the Tukey multiple comparison post-test was used to compare more than 2 groups. The results are represented as the mean ± SD. All statistical analyses were performed with the GraphPad Prism software 7.0. p-values of less than 0.05 were considered significant and indicated by asterisks (*, p< 0.05; **, p < 0.01; ***, p < 0.0001 or ****, p < 0.00001).
Results
Identification of therapeutic targets in p53 mutant CRCs with elevated c-MYC expression
To identify vulnerabilities of CRCs with mutant p53 and elevated c-MYC expression we performed a comprehensive bioinformatics analysis of multiple, large patient- and cell-line derived datasets (Figure 1A). First, we analyzed CRC cell line data from the Cancer Dependency Map (DepMap) to identify genes, that show co-dependencies with c-MYC and display stronger dependencies in p53 mutant CRC cell lines when compared to p53 wt cells. For each gene, we calculated the correlation coefficient between the dependency on the gene and the dependency on c-MYC across CRC cell lines. The goal was to identify positively correlated genes, which would indicate that cell lines with high dependency on c-MYC also show high dependency on the gene of interest. Furthermore, we calculated the difference in dependency for each gene in p53 wt vs. p53 mutant CRC cell lines. The integration of the c-MYC- and p53-specific differential dependencies revealed a significant positive correlation between the global c-MYC- and p53-mutant-related gene dependencies (Figure 1B). Therefore, our results suggest that genes that exert co-dependencies with c-MYC show higher dependencies in p53 mutated CRC cell lines, and vice versa. This screen identified 116 genes that show a significant co-dependency with c-MYC and a significant higher dependency in p53 mutated CRC cell lines (Rokavec et al., manuscript in preparation). SQLE was among the genes whose dependency in CRC cell lines showed the most significant positive correlation with the dependency on c-MYC, indicating that cell lines that are highly dependent on c-MYC also show high dependency on SQLE (Figure 1C). Furthermore, p53 mutant CRC cell lines showed a significantly higher dependency on SQLE than p53 wt cells (Figure 1D).
Bioinformatics identification of therapeutic targets in CRCs with mutant p53 and high c-MYC expression. (A) Schematic representation of the bioinformatics screen. (B) Correlation of c-MYC- and p53-related dependencies in CRC cell lines. Lower dependency scores correspond to higher dependency. SQLE is marked in red. See results for detailed explanation. (C) Correlation between SQLE and c-MYC dependencies in CRC cell lines. (D) SQLE dependency in p53 wt and mutant CRC cell lines. (E) Correlation of c-MYC and p53 GEO expression scores in cell lines. SQLE is marked in red. See results for detailed explanation. (F) Fold changes in SQLE expression in GEO datasets representing studies with c-MYC ectopic expression or knockdown in the indicated cell lines. (G) Fold changes in SQLE expression in GEO datasets representing studies with p53 activation in indicated cell lines. (H) Correlation of c-MYC expression and p53 wt/mut scores in primary CRCs. SQLE is marked in red. See text for detailed explanation. (I) Correlation between SQLE and MYC mRNA expression in CRCs from the indicated cohorts. (J) SQLE expression in p53 mutant vs p53 wt primary tumors from indicated CRC patient cohorts.
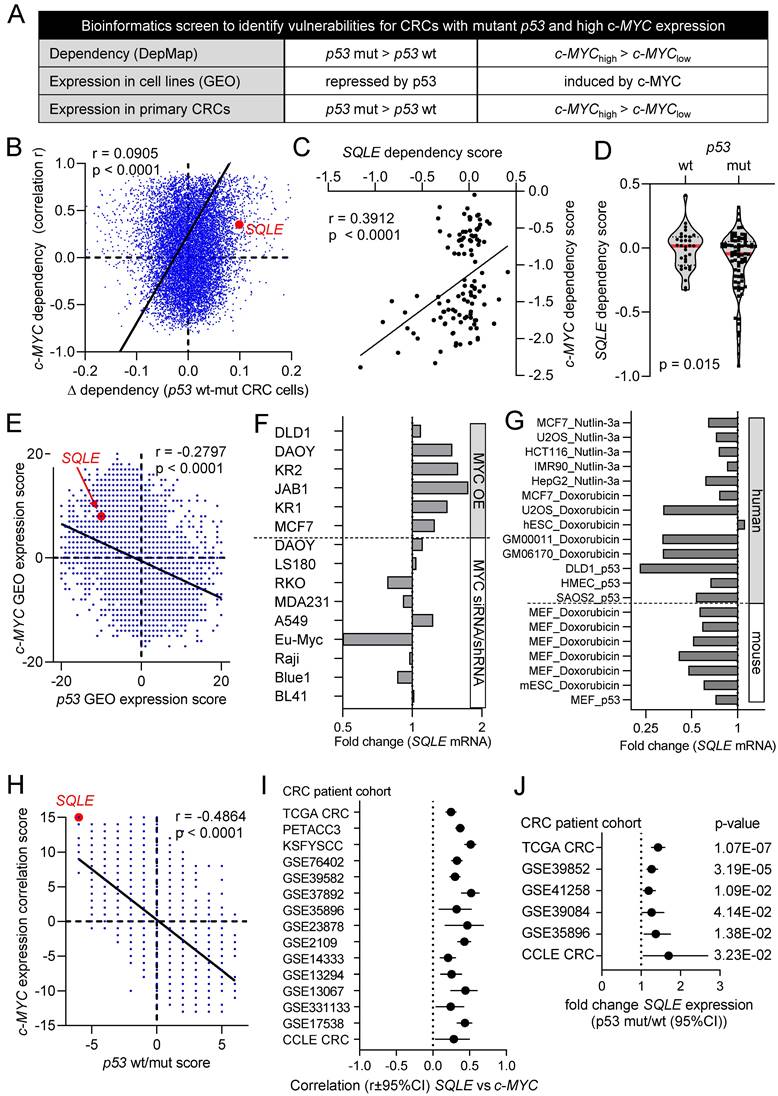
Next, we performed a meta-analysis of twenty public Gene Expression Omnibus (GEO) datasets representing studies of ectopic expression or knockdown/knockout of c-MYC in cell lines or mice to identify genes that are regulated by c-MYC. For each study a score of +1 was assigned to genes that were significantly induced after ectopic expression of c-MYC or repressed after c-MYC knockdown, whereas a score of -1 was assigned to genes that were repressed after ectopic c-MYC or induced after c-MYC knockdown. Scores for each gene in every study were summed up to obtain a c-MYC GEO expression score.
This score indicates the number of studies in which a gene was induced or repressed by c-MYC. Thus, the size of the score indicates the consistency of the regulation by c-MYC. To identify genes that are regulated by p53, we utilized the data from a similar meta-analysis of twenty GEO datasets representing studies with p53 activation in cell lines [24] and thereby obtained a p53 GEO expression score. Interestingly, the integration of c-MYC and p53 GEO expression scores revealed a significant inverse correlation between the global gene regulation exerted by c-MYC and p53, indicating that many genes that are induced by c-MYC are repressed by p53 and vice versa (Figure 1E). SQLE mRNA was induced after ectopic expression of c-MYC and down-regulated after repression of c-MYC in the majority of GEO studies (Figure 1F). Furthermore, SQLE mRNA was suppressed after activation of p53 in the majority of GEO studies with human and mouse cell lines (Figure 1G).
Finally, we performed a similar meta-analysis in primary CRCs. For each gene we calculated the correlation coefficient between its expression and the expression of c-MYC in primary tumors from 15 CRC patient cohorts. For each cohort, genes that showed a significant positive or negative correlation with c-MYC were assigned with a score of +1 and -1, respectively. Scores for each gene in every cohort were summed up to obtain a c-MYC expression correlation score, which indicates the number of studies in which a gene was significantly positively or negatively correlated with the expression of c-MYC. To determine p53-regulated genes in CRCs, we identified genes that were differentially expressed between p53 wt and mutant primary tumors from six CRC patient cohorts. Scores were assigned to genes indicating the number of cohorts in which the expression of a gene is higher in p53 wt tumors (positive score) or higher in p53 mutant tumors (negative score). Similar to GEO expression scores from cell lines, also c-MYC- and p53-scores from primary tumors showed a strong inverse correlation, suggesting that genes that positively correlate with the expression of c-MYC are higher expressed in p53 mutant tumors and those lower in c-MYC low tumors are low in p53 wt tumors (Figure 1H). The expression of SQLE mRNA showed a strong and consistent positive correlation with c-MYC mRNA expression in all 15 cohorts of primary CRCs and CRC cell lines (Figure 1I). Furthermore, expression of SQLE mRNA was consistently higher in tumors with mutant p53 in all six cohorts of primary CRCs and CRC cell lines (Figure 1J).
Association of SQLE expression with clinico-pathological parameters
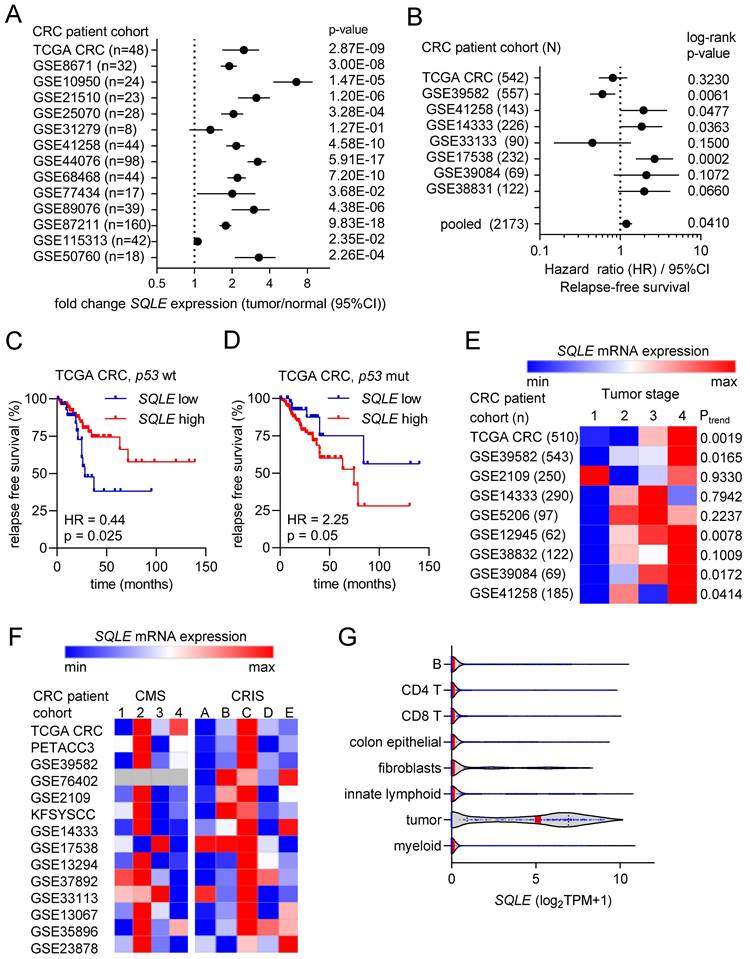
Next, we analyzed the association of SQLE mRNA expression with clinico-pathological parameters in publicly available CRC patient cohorts. SQLE mRNA expression was strongly and consistently elevated in colorectal tumors compared to adjacent normal tissue in 13 out of 14 patient cohorts (Figure 2A). Furthermore, high expression of SQLE was significantly associated with poor survival in an analysis of 8 pooled CRC patient cohorts (Figure 2B). Interestingly, stratification of patients according to the p53 mutational status of CRCs revealed that in CRCs with wt p53 high SQLE expression was associated with good survival (Figure 2C), whereas in CRCs with mutant p53 high SQLE expression was associated with poor patient survival (Figure 2D). Moreover, SQLE expression progressively increased from stage 1 to stage 4 primary tumors in 5 out of 9 CRC patient cohorts (Figure 2E). Next, we analyzed SQLE expression in different cancer molecular subtypes (CMS) [22] and colorectal cancer intrinsic subtypes (CRIS) [23]. SQLE mRNA levels were highest in CMS2 and in CRIS C/D, which are molecular sub-types of CRC characterized by high Wnt/c-MYC activity and intestinal stem cell gene expression (Figure 2F). Finally, analysis of single cell RNA-Seq data from primary CRCs [25] showed that SQLE mRNA is predominantly expressed in tumor cells when compared to normal colon epithelial and stromal cells (Figure 2G), suggesting that therapeutic targeting of SQLE may have weak effects in non-tumor cells.
Associations of SQLE expression with clinical and pathological characteristics in CRC. (A) Forest plot showing fold changes in SQLE expression between colorectal tumors and matched adjacent normal colonic mucosa in patient cohorts. Dots represent fold changes and horizontal lines show 95% CI. Significance was determined using paired t-test. (B) Forest plot showing hazard ratios for relapse free survival by comparing patients with high versus low expression of SQLE in CRC patient cohorts. Dots represent hazard ratios and horizontal lines show 95% CI. P-values were calculated using the log-rank method. (C and D) Kaplan-Meier analysis of RFS according to the SQLE expression in TCGA p53 wt (C) and p53 mutant (D) CRC cohorts. (E) Associations of SQLE expression with tumor stage. Significance was determined using one-way ANOVA with a post-test for linear trend from stage 1 to stage 4. (F) SQLE expression in different cancer molecular subtypes (CMS) [19] and colorectal cancer intrinsic subtypes (CRIS). (G) Expression of SQLE mRNA in the indicated cell types present within colon tumors (data from single cell RNA-Seq (GSE81861)).
Suppression of SQLE decreases viability of CRC cells
To determine whether a therapeutic inhibition of SQLE may reduce CRC cell viability and proliferation, we suppressed SQLE using a pool of SQLE-specific siRNAs (Figure 3A). Knockdown of SQLE decreased cell viability in seven CRC cell lines (Figure 3B). The silencing of SQLE resulted in a similar suppression of cell viability as silencing of c-MYC in all cell lines (Figures 3B and 3C). This confirmed our previous, bioinformatics-based observation (Figure 1C), which indicated that cell lines, which are highly dependent on c-MYC also show a high dependency on SQLE.
Suppression of SQLE results in decreased viability of CRC cells. (A) Western blot analysis of indicated proteins in SW480 and SW620 cells after transfection of indicated siRNAs for 48 hours. (B) 48 hours after transfection with siRNAs cells were transferred into new 96-well plates (5000 cells/well) and transfected again with siRNAs. After 5 days cell viability was analyzed with CellTiter GLO. (C) Correlation between the fold changes in cell viability between cells transfected with SQLE siRNA and c-MYC siRNA. Color coding as in panel B. (D) and (E) Left panels: Cell proliferation was determined by impedance measurement after transfection with siRNAs. Right panels: Cell numbers were determined using a Neubauer chamber at the last time point. (F-H) Cell viability analysis after inhibition of SQLE with the increasing concentration of Terbinafine for 96 hours in three pairs of syngeneic p53-proficient and p53-deficient CRC cell lines. (I and J) Cell viability analyzes of human intestinal fibroblasts transfected with indicated siRNAs (I) or treatment with Terbinafine for 96 hours (J). (K and L). Cell proliferation of human intestinal fibroblasts determined by impedance measurement after transfection with siRNAs or treatment with Terbinafine (L). In panels A, F- J, the mean ± SD (n = 3) is provided. *: p < 0.05, **: p < 0.01, ***: p < 0.001.
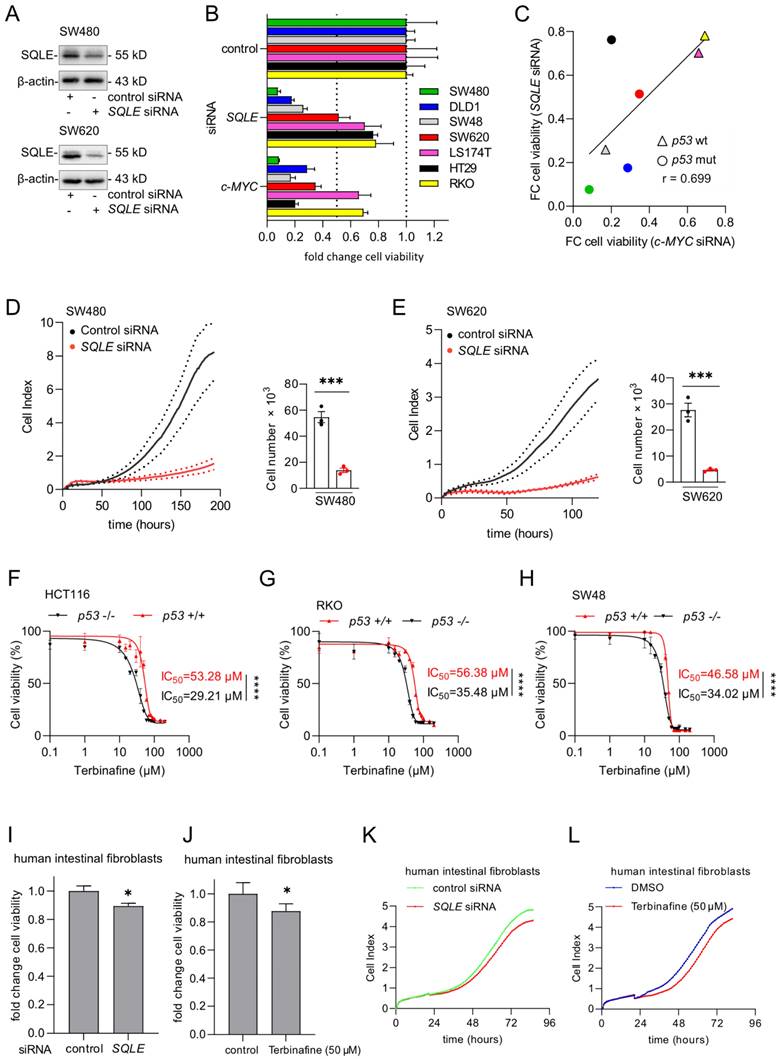
The suppression of SQLE in SW480 and SW620 CRC cells resulted in a strong decrease of proliferation as determined by measuring cellular impedance and cell number evaluation at the end-point (Figures 3D and 3E). Next, we used the SQLE-inhibitor Terbinafine to treat three pairs of syngeneic p53-proficient and p53-deficient CRC cell lines. Analysis of cell viability showed that p53-deficient cells were more sensitive to the Terbinafine than p53-proficient cells (Figure 3F-H), which is consistent with the bioinformatics analysis of DepMap data showing that p53-mutant CRC cell lines display a higher dependency on SQLE than p53 wt cells (Figure 1D). In the absence of Terbinafine, p53-deficient HCT116, RKO, and SW48 cells showed an increased cell viability when compared to their p53-proficient counterparts (Supplemental Figure 1A-C). Finally, knockdown of SQLE by siRNA or inhibition of SQLE by Terbinafine resulted in an only minor suppression of cell viability and impedance/proliferation of normal human intestinal fibroblasts (Figure 3I-L and Supplementary Figures 2A, B), indicating that the inhibition of SQLE may have minor effects on non-tumor cells and therefore presumably exhibit less side-effects on the organismal level.
p53 represses SQLE expression and cholesterol synthesis
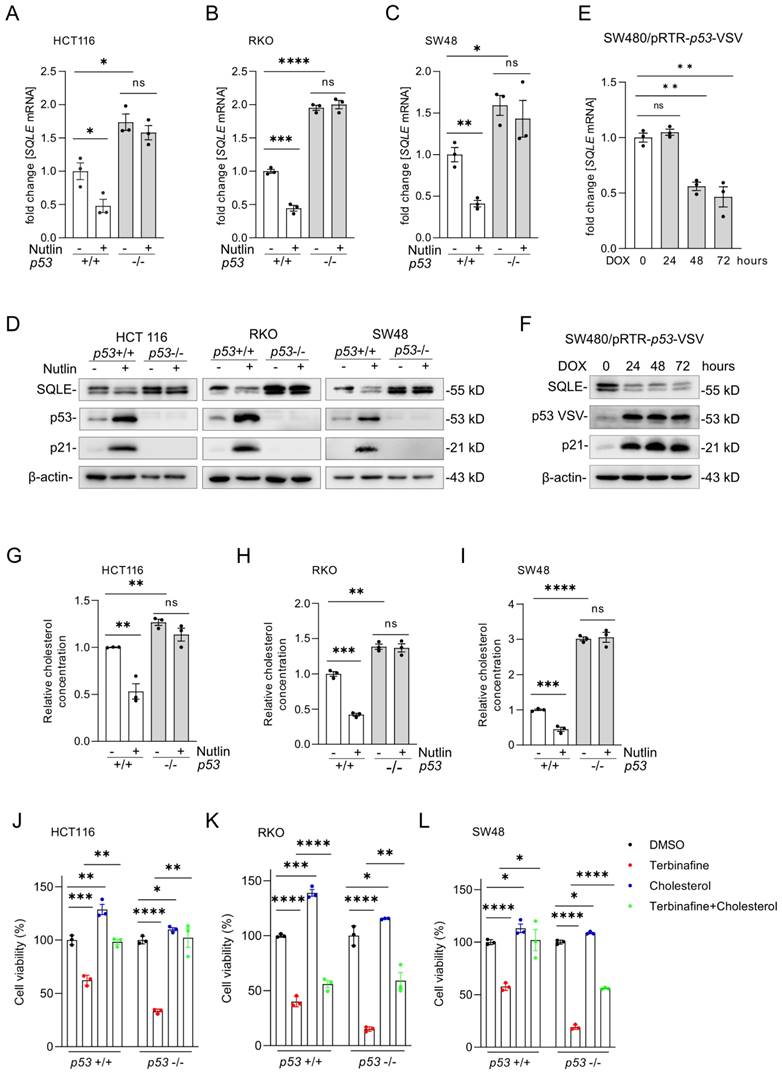
Our bioinformatics results from public datasets had suggested that SQLE is repressed by p53 (Figure 1G). For experimental validation, we treated the syngeneic pairs of p53 wt and p53 knockout HCT116, RKO and SW48 CRC cell lines with the p53-activator Nutlin-3a, a small-molecule compound antagonizing the inhibitory interaction of MDM2 with p53 [26]. After activation of p53 by Nutlin-3a, SQLE mRNA (Figures 4A-C) and protein expression (Figure 4D) was significantly repressed in p53 wt cells, but not in p53 knockout cells. Of note, SQLE expression was higher in untreated p53 knockout cells when compared to p53 wt cells. Furthermore, we analyzed the expression of SQLE in SW480 cells with DOX-inducible ectopic expression of wt p53, which we had previously established [27]. After DOX treatment the mRNA and protein expression of SQLE was repressed (Figure 4E and F). Next, we examined relative cholesterol levels after p53 activation. After treatment with Nutlin-3a, cholesterol levels were significantly repressed in p53 wt cells, but not in p53 knockout cells (Figures 4G-I). Moreover, p53 knockout cells showed increased cholesterol levels when compared with p53 wt cells. Next, we treated p53 wt and p53 knockout HCT116, RKO, and SW48 cells with the SQLE inhibitor Terbinafine and/or cholesterol. Cholesterol substitution completely rescued cell viability in Terbinafine treated p53-proficient and p53-deficient HCT116 cells (Figure 4J). In RKO the rescue was partial irrespective of the p53 status (Figure 4K) and in SW48 the rescue was complete in p53-proficient and partial in p53-deficient cells (Figure 4L). Altogether, our results show that expression of SQLE and cholesterol levels are suppressed by p53. Furthermore, the resulting decrease in cholesterol results in decreased viability of CRC cells.
p53 activation represses SQLE expression and cholesterol synthesis. (A-C) qPCR analysis of SQLE expression after activation of p53 by Nutlin-3a (10 µM) for 48 hours. (D) Western blot analysis of SQLE, p53 and p21 expression after Nutlin-3a treatment. (E-F) qPCR and Western blot analysis in SW480 cells after induction of ectopic wt p53 by DOX for the indicated periods. (G-I) Cholesterol levels in the indicated cells after activation of p53 via Nutlin-3a. (J-L) Cell viability of indicated cells after treatment with Terbinafine and/or Cholesterol. In panels of A-C, E, G-L, the mean ± SD (n=3) is provided. *p < 0.05, **p < 0.01, and ***p < 0.001.
SQLE is a miR-205 target
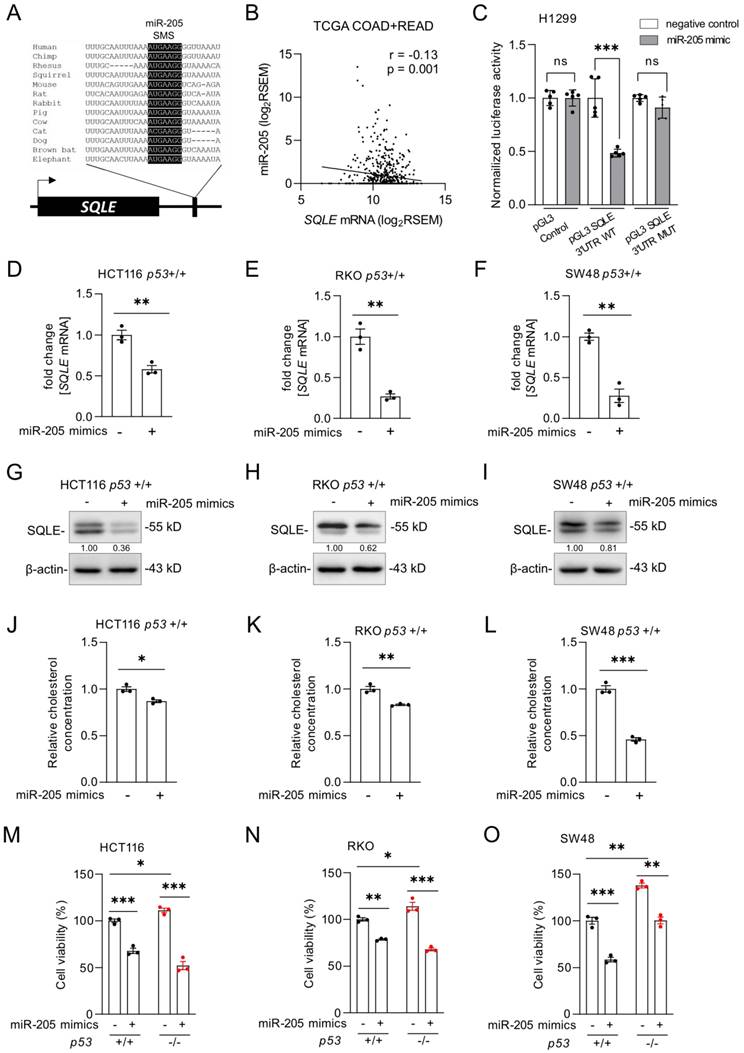
p53 does not repress its target genes directly, but indirectly via microRNAs (miRNA) or the DREAM complex [28]. According to a meta-analysis, SQLE is not a target of the DREAM complex [29]. MiRNAs induced by p53 have been previously shown to participate in the regulation of cell proliferation and apoptosis by suppressing the expression of important oncogenes [30]. We identified a conserved sequence in the 3'-UTR of the SQLE mRNA that matches the seed region of miR-205, which is a p53-inducible miRNA [31] (Figure 5A). Therefore, p53 might suppress SQLE via the induction of miR-205. The expression of SQLE and miR-205 expression showed a significant negative correlation in the TGCA dataset of primary CRC tumors (r =-0.13, p=0.001; Figure 5B). Dual luciferase assays confirmed that ectopic miR-205 directly suppresses the SQLE 3'-UTR mediated enhancement of translation, which was abolished by mutations of the miR-205 binding site (Figure 5C). Since luciferase reporter assays may have limited physiological relevance, we also determined the effect of ectopic miR-205 on endogenous SQLE. After transfection of miR-205 mimics, which are synthetic RNAs that simulate naturally occurring mature miR-205, SQLE mRNA levels were significantly decreased in HCT116, RKO, and SW48 cells (Figure 5D-F). Also, SQLE protein was decreased (Figure 5G-I). Consistently, ectopic miR-205 also suppressed cholesterol levels (Figure 5J-L) and cell viability (Figure 5M-O) in HCT116, RKO, and SW48 cells.
SQLE represents a target of miR-205. (A) Schematic representation of the SQLE 3'-UTR indicating the miR-205 seed-matching sequence (SMS; highlighted in black) and its phylogenetic conservation. (B) Correlation between SQLE and miR-205 expression in TGCA colon adenocarcinomas (COAD) and rectum adenocarcinomas (READ). (C) Dual-luciferase assay was conducted 48 hours after transfection of H1299 cells with miR-205 mimics and human SQLE wt or mutant 3'-UTR reporters. Data resents the mean ± SD of five replicates. (D-F) qPCR analysis of SQLE expression after transfection of miR-205 mimics four 48 hours. (G-I) Western blot analysis after transfection of miR-205 mimics for 48 hours. (J-L) Relative cholesterol concentration after transfection of miR-205 mimics for 72 hours. (M-O) Cell viability after transfection of miR-205 mimics for 72 hours. In panel D-F and J-O the mean ± SD (n = 3) is provided. *: p < 0.05, **: p < 0.01, ***: p < 0.001, ****: p < 0.0001.
p53 represses SQLE expression and cholesterol levels via the induction of miR-205
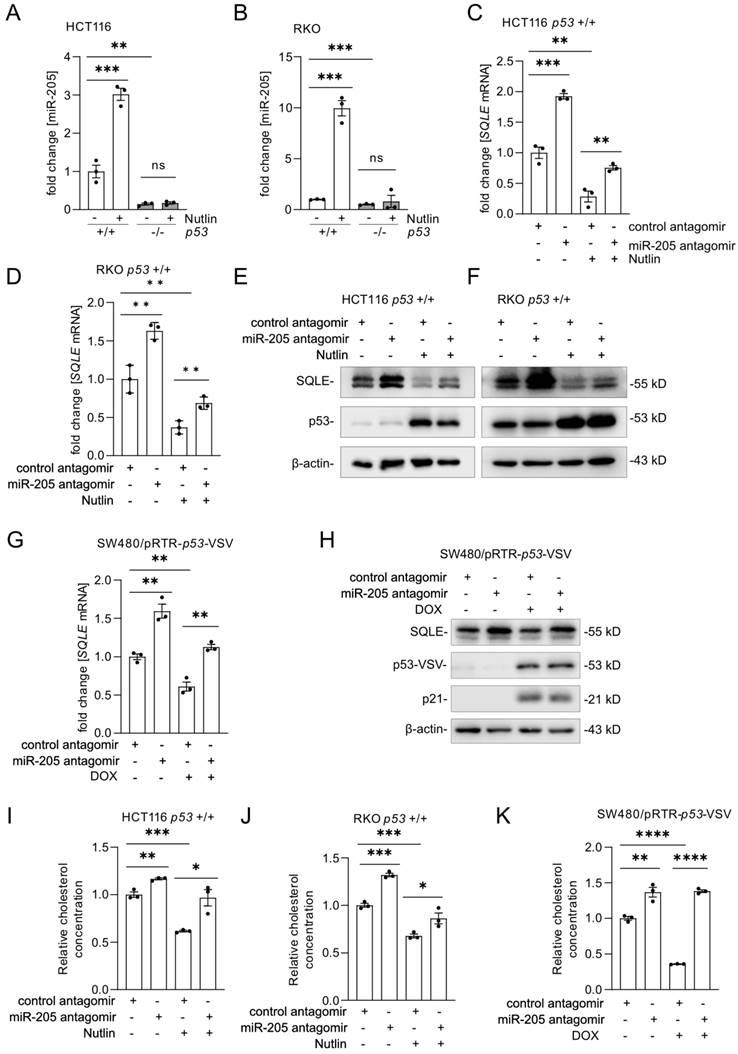
To verify that miR-205 expression is induced in a p53-dependent manner in CRC cell lines, we treated three pairs of syngeneic p53-proficient and p53-deficient CRC cell lines with Nutlin-3a.
After activation of p53 by Nutlin-3a, miR-205 expression was significantly induced in p53 wt cells, but not in p53 knockout cells (Figure 6A-B and Supplemental Figure 3A). Next, miR-205 was inhibited with antagomirs. Expression of SQLE mRNA and protein was up-regulated after miR-205 inhibition (Figure 6C-F and Supplemental Figure 3B-C). Importantly, the suppression of SQLE mRNA and protein by p53 could be reverted by miR-205 antagomirs (Figure 6 C-F and Supplemental Figure 3B-C). Similarly, the inhibition of miR-205 with antagomirs reverted the down-regulation of SQLE mRNA and protein by ectopic expression of wt p53 in SW480/pRTR-p53-VSV cells (Figure 6G-H). In agreement with its effect on SQLE expression, inhibition of miR-205 completely abolished the decrease in cholesterol levels after p53 activation in HCT116 and RKO cells as well as after expression of ectopic p53 in SW480/pRTR-p53-VSV cells (Figure 6I-K). Altogether, our results show that the suppression of SQLE expression and cholesterol levels by p53 is mediated by the induction of miR-205.
SQLE is indirectly repressed by p53 via miR-205. (A-B) qPCR analysis of SQLE mRNA expression after the activation of p53 by Nutlin-3a. (C-D) qPCR analysis of SQLE expression transfection of miR-205 antagomirs for 60 hours and Nutlin-3a treatment for 48 hours. (E-F) Western blot analysis of SQLE expression after transfection of miR-205 antagomir for 60 hours and Nutlin-3a treatment for 48 hours. (G-H) qPCR (G) and Western blot (H) analysis of SQLE mRNA and protein expression after transfection of miR-205 antagomir for 60 hours and activation of ectopic wt p53 expression by treatment with DOX for 48 hours. (I-J) Relative cholesterol concentration in cells treated as in (C). (K) Relative cholesterol concentration in indicated cells treated as in (G). In panel A-D, G and I-K the mean ± SD (n = 3) is provided. *: p < 0.05, **: p < 0.01, ***: p < 0.001, ****: p < 0.0001.
SQLE expression is induced by c-MYC
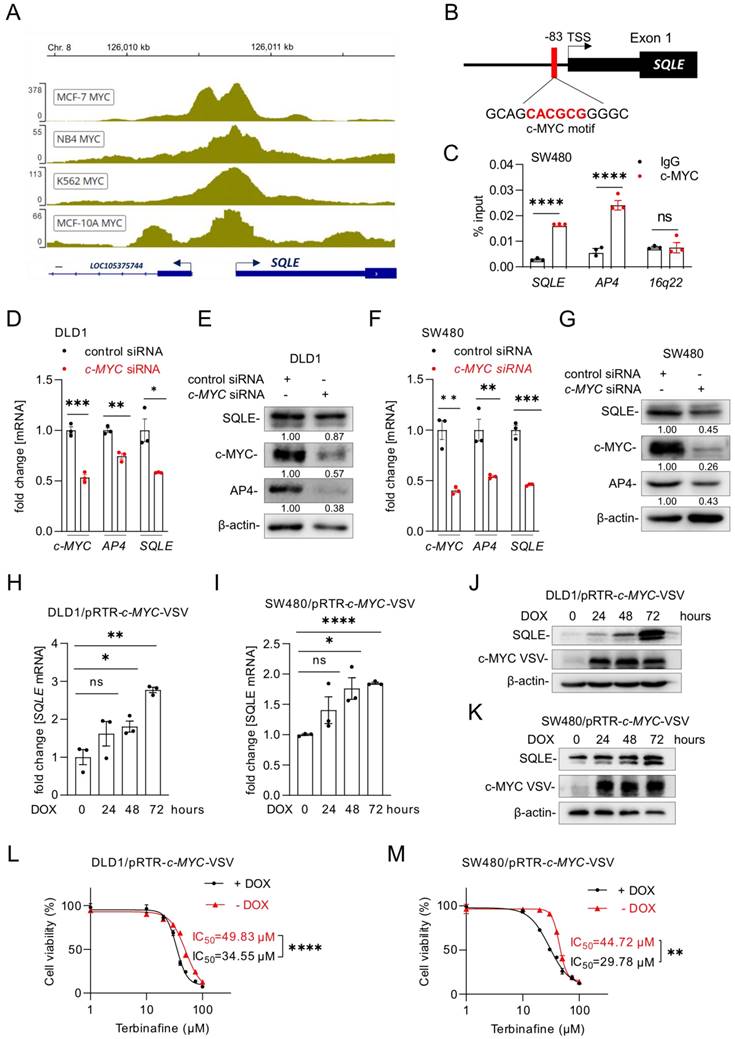
Our analysis of the Encode ChIP-Seq data from multiple cell lines showed that c-MYC binds to the promoter region of SQLE near the transcription start site (TSS) (Figure 7A). Furthermore, we identified a putative c-MYC binding site in the SQLE promoter region (Figure 7B). A qChIP assay confirmed enhanced c-MYC occupancy at this binding site within the SQLE promoter in SW480 cells (Figure 7C). As mentioned above, our analysis of public datasets suggested that the expression of SQLE is induced by c-MYC (Figure 1F). To validate this regulation, we suppressed c-MYC in DLD1, SW480, and SW620 cells with a pool of c-MYC-specific siRNAs. SQLE and AP4, a known c-MYC target [32], mRNA and protein levels decreased after silencing of c-MYC (Figure 7D-G, Supplemental Figure 4A-B). Conversely, ectopic expression of c-MYC induced SQLE mRNA and protein expression in DLD1 and SW480 cells (Figure 7H-K). Next, we used the SQLE-inhibitor Terbinafine and measured cell viability after ectopic c-MYC expression. While Terbinafine reduced the viability of DLD1 and SW480 cells, ectopic c-MYC expression further increased the sensitivity of these cells to Terbinafine (Figure 7L and M). Therefore, c-MYC up-regulates SQLE expression and increases the sensitivity towards SQLE inhibitors in CRC cells.
Characterization of SQLE as a c-MYC target. (A) c-MYC ChIP-Seq signal at the SQLE promoter in the indicated cell lines. Numbers on the y-axis indicate ChIP-Seq reads. (B) Schematic representation of the SQLE promoter region indicating the c-MYC binding site. (C) qChIP analysis of c-MYC occupancy at the human SQLE genomic region in SW480 cells. AP4 and 16q22 served as positive and negative controls, respectively. (D) qPCR and (E) Western blot analysis after transfection of DLD1 cells with the indicated siRNAs. (F) qPCR and (G) Western blot analysis after transfection of SW480 cells with siRNAs. (H-I) SQLE mRNA levels in DLD1 (H) and SW480 (I) cells after c-MYC induction by DOX for the indicated periods. (J-K) SQLE protein levels in DLD1 (J) and SW480 (K) cells after c-MYC induction by DOX for the indicated periods. (L-M) Cell viability analysis after inhibition of SQLE with the increasing concentration of the SQLE-inhibitor Terbinafine for 96 hours in DLD1 (L) and SW480 (M) cells with or without DOX treatment. In panel C, D, F, H, I, L and M the mean ± SD (n = 3) is provided. *: p < 0.05, **: p < 0.01, ***: p < 0.001, ****: p < 0.0001. TSS: Transcription start site.
Regulation of SQLE expression by AP4
Analysis of Encode ChIP-Seq datasets showed that the c-MYC-inducible transcription factor AP4 also binds to the SQLE regulatory region (Figure 8A). Moreover, we identified a putative AP4 binding motif in the SQLE promoter region (Figure 8B). A qChIP assay confirmed enhanced AP4 occupancy at this binding site within the SQLE promoter in SW480 cells (Figure 8C). Activation of a conditional AP4 allele by DOX induced SQLE mRNA and protein levels in DLD1 and SW480 cells (Figure 8D-G). Furthermore, AP4-deficient cells showed a decrease in SQLE mRNA and protein expression (Figure 8H-K). Taken together, these results demonstrate that SQLE is directly induced by AP4.
SQLE is directly induced by AP4. (A) AP4 ChIP-seq signal at the SQLE promoter in the indicated cell lines. Numbers on the y-axis indicate ChIP-Seq reads. (B) Schematic representation of the SQLE promoter region indicating a predicted AP4 binding site. (C) qChIP analysis of AP4 occupancy at the human SQLE promoter region in SW480 cells. SNAIL and 16q22 served as positive and negative controls, respectively. (D-G) qPCR (D, F) and Western blot (E, G) analysis of SQLE expression after AP4 induction by DOX for the indicated periods in (D,E) DLD1 and (F,G) SW480 cells. (H-K) qPCR (J) and Western blot (K) analysis in AP4-proficient and AP4-deficient (H,I) DLD-1 and (J,K) SW480 cells. (L) Correlation between SQLE and AP4 dependencies in CRC cell lines (data from the cancer dependency map). (M-N) Cell viability analysis after inhibition of SQLE with the increasing concentration of Terbinafine for 96 hours in AP4-proficient and AP4-deficient cells DLD1 (M) and SW480 (N) cells. (O-P) Cell viability analysis after treatment with Terbinafine for 96 hours in DLD1 (O) and SW480 (P) cells with or without DOX-induced, ectopic AP4 expression. (Q-R) Relative cholesterol concentration in DLD1 (Q) and SW480 (R) cells with or without DOX induced, ectopic AP4 expression for 72 hours. In panel D, F, H, J and M-R the mean ± SD (n = 3) is provided. *: p < 0.05, **: p < 0.01, ***: p < 0.001, ****: p < 0.0001. TSS: Transcription start site.
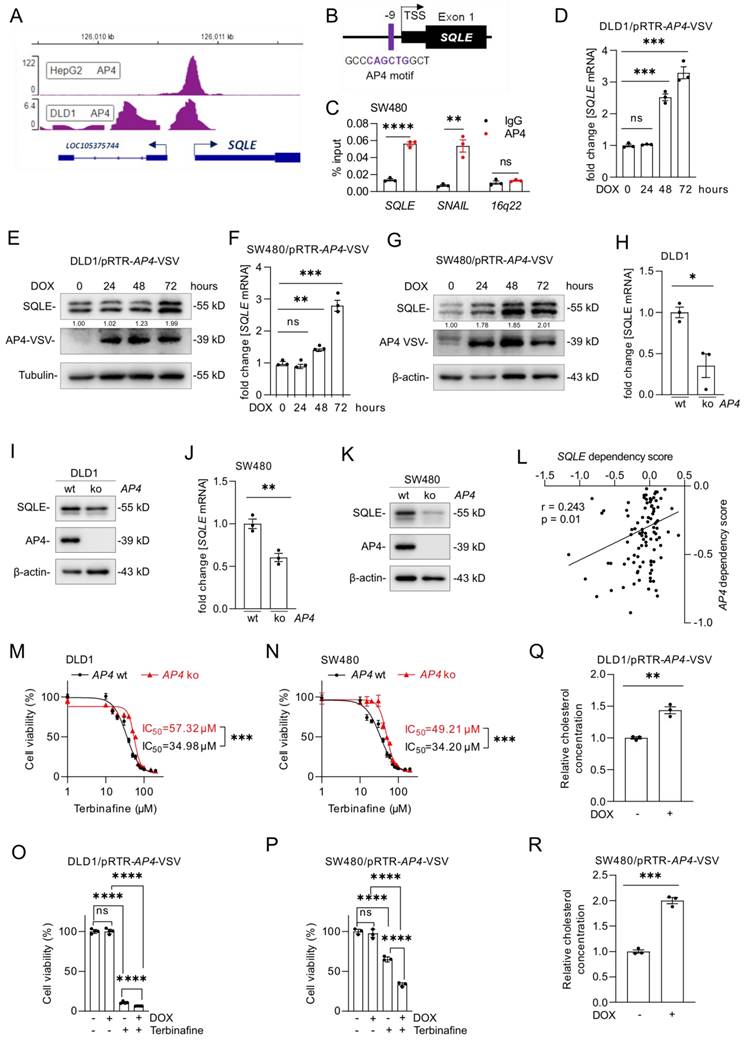
Notably, analysis of DepMap data from CRC cell lines showed a positive association between dependencies on AP4 and SQLE (r=0.243) (Figure 8L). Therefore, we determined whether the AP4 status influences the sensitivity of DLD1 and SW480 cells to Terbinafine. Indeed, AP4-proficient CRC cells were more sensitive to the suppression of SQLE when compared to AP4-deficient cells (Figure 8M and N), which were described before [20]. Next, we analyzed the viability of DLD1 and SW480 cells with inducible AP4 expression after Terbinafine treatment. Ectopic AP4 further reduced cell viability when combined with Terbinafine treatment, suggesting that AP4 sensitizes CRC cells to inhibition of cholesterol synthesis (Figure 8O and P). Finally, we determined that ectopic AP4 expression for 72 hours increased the levels of cholesterol (Figure 8Q and R). In summary, activation of AP4 induces SQLE expression and increases cholesterol levels, which ultimately sensitizes CRC cells to Terbinafine.
Role of AP4 in the induction of SQLE expression by c-MYC
To analyze whether the induction of SQLE by c-MYC is mediated by AP4, we ectopically expressed c-MYC in AP4-proficient and AP4-deficient DLD1 and SW480 cells. AP4-deficiency largely prevented the induction of SQLE mRNA and protein expression after ectopic c-MYC. (Figure 9A-D). Consistent with these results, ectopic c-MYC increased cholesterol levels, which was attenuated in AP4-deficient CRC cells (Figure 9E and F). In addition, AP4-deficient cells showed significantly decreased levels of cholesterol levels. Ectopic c-MYC sensitized CRC cells to Terbinafine. However, this effect was less pronounced in AP4-deficient cells (Figure 9G and H). These results demonstrate that AP4 mediates the induction of SQLE by c-MYC. The resulting increase in cholesterol may explain the increased sensitivity of CRC cells with activated c-MYC to treatment with Terbinafine.
Role of AP4 in the induction of SQLE by c-MYC. (A-B) qPCR analysis of SQLE expression after c-MYC induction by DOX for the indicated periods in AP4-proficient and AP4-deficient DLD1 (A) and SW480 (B) cells. (C-D) Western blot analysis of SQLE protein expression after c-MYC induction by DOX for indicated periods in AP4-proficient and AP4-deficient DLD1 (C) and SW480 (D) cells. (E-F) Analysis of relative cholesterol concentration in AP4-proficient and AP4-deficient DLD1 (E) and SW480 (F) cells after c-MYC induction by DOX for 72 hours. (G-H) Cell viability analysis in AP4-proficient and AP4-deficient DLD1 (G) and SW480 (H) cells after c-MYC induction by DOX for 72 hours. In panel A, B and E-H the mean ± SD (n = 3) is provided. *: p < 0.05, **: p < 0.01, ***: p < 0.001, ****: p < 0.0001.

Discussion
Here, we showed that c-MYC induces the expression of SQLE and thereby promotes cholesterol synthesis in CRC cells. Our results show that c-MYC induces SQLE expression largely indirectly via inducing its target gene AP4 in CRC cell lines. AP4 is a member of the basic helix-loop-helix leucine zipper (bHLH-LZ) transcription factor family [33]. We have previously shown that AP4 promotes stemness, EMT, migration, and invasion of CRC cells [34]. c-MYC directly up-regulates AP4, which represses p21, to promote a proliferative, progenitor-like state [35, 36]. Here we showed, that AP4 activation is sufficient to induce SQLE levels and promotes cholesterol synthesis. Taken together, these results imply that c-MYC and AP4 promote cholesterol synthesis and cancer cell proliferation through the induction of SQLE. The elevated cholesterol levels in p53-deficient CRC cells with high c-MYC expression presumably increase their dependency on cholesterol, which could explain the increased sensitivity of these cells to SQLE inhibition.
In this study, we identified SQLE as a vulnerability for CRCs with p53 inactivation and elevated c-MYC expression. SQLE is key rate-limiting enzyme in the first oxygenation step in the cholesterol synthesis pathway [37]. Cholesterol metabolism is required for cancer cell proliferation as cholesterol represents an essential membrane constituent that participates in various biological processes [38]. As a component of cell membranes, cholesterol activates the oncogenic Hedgehog pathway by directly binding the Smoothened receptors [39, 40], which are closely related to cell differentiation and proliferation [41]. Cholesterol is also an important component of lipid rafts, special small lipid domains within the cell membrane which serve as platforms for cellular signal transduction and oncogenic signaling pathways [42]. Hence, cholesterol metabolism plays a crucial role in cancer cell proliferation. In addition, Costa et al. showed that cholesterol depletion suppresses the migration and invasion of melanoma cells [43]. Elevated expression of SQLE has been associated with poor prognosis in CRC [44, 45], breast [46, 47], lung [48], and prostate cancer [49]. Our results show that high SQLE expression is associated with poor prognosis particularly in patients with CRCs that harbor mutant p53.
c-MYC has been shown to activate the mevalonate/cholesterol pathway in cooperation with the E-box-binding B-HLH-LZ transcription factor SREBP1 to promote tumorigenesis in renal, hepatocellular, and leukemic mouse models [50]. Moreover, SREBP-2 induces c-MYC expression by directly interacting with an SREBP-2-binding element in the 5'-flanking c-MYC promoter region [51]. c-MYC expression is associated with increased in- and reduced e-flux of cholesterol in lung cancer [52]. Therefore, multiple connections between c-MYC and cholesterol may play a role in cancer.
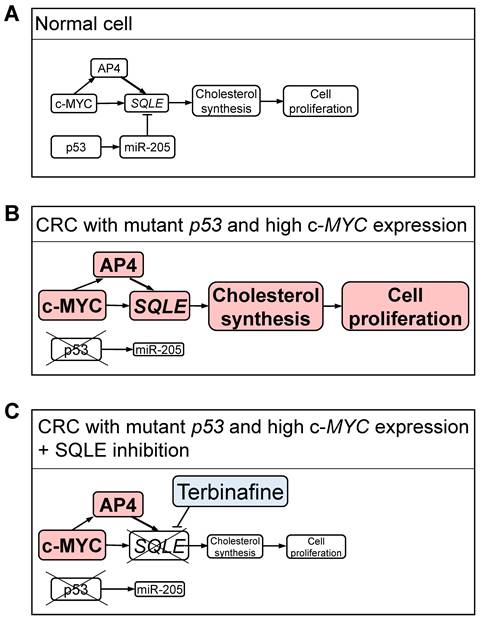
Here, we showed that p53 represses SQLE expression via inducing miR-205. Consistently, the loss of p53 resulted in elevated levels of cholesterol in three different CRC cell lines. Sun et al. proposed that p53 directly represses the expression of SQLE via binding to the first intron of the SQLE gene [53]. However, our results imply that the repression of SQLE by p53 is mainly mediated by miR-205. While this study was ongoing others reported that SQLE represents a target of miR-205 [54], which is a p53-inducible microRNA [31]. However, these authors did not determine whether p53 represses SQLE via inducing miR-205, as shown here by us. Our findings are consistent with the notion that p53-mediated transcriptional repression is mediated by indirect mechanisms, such as induction of microRNA encoding genes or activation of the repressive DREAM complex via the induction of p21 [55]. Noteworthy, a recent meta-analysis of p53-regulated genes indicated that SQLE is not a target of the DREAM complex [29]. As we show here, the induction of miR-205 by p53 mediates the repression of SQLE by p53 to a large extent. Down-regulation of miR-205 has been observed in the majority of metastatic CRCs and is of predictive value for CRC metastasis [56]. Down-regulation of miR-205 has also been observed in prostate, breast and liver cancers and is associated to tumorigenesis, cell proliferation, migration, invasion, and motility/metastasis [57-59]. The regulatory connections between p53, c-MYC and SQLE provide a plausible explanation as to why SQLE represents a vulnerability in cancers with mutant p53 and high c-MYC activity (Figure 10). Accordingly, inhibition of SQLE by Terbinafine particularly reduced viability in CRC cells with p53 inactivation, high c-MYC expression and AP4-proficiency. Interestingly, Terbinafine was shown to induce cell cycle arrest and apoptosis in tumor cells, and inhibits angiogenesis by suppressing endothelial cell proliferation [60, 61]. Since Terbinafine has been approved for antifungal therapy and has an excellent safety profile it may be quickly adapted for cancer therapeutic purposes [60, 62]. Here, inhibition of SQLE effectively decreased viability in cultured CRC cells. However, CRC cells were cultured in medium supplemented with fetal bovine serum (FBS), which has a very low cholesterol concentration (0.09 mM at 10% FBS) [63]. In humans, the concentration of cholesterol, which is produced in the liver, is much higher in plasma (5 mM) [63]. Therefore, inhibition of SQLE might have a weaker effect in vivo. Yet, systemic inhibition of SQLE would also suppress cholesterol production in the liver. Noteworthy, treatment of mice with the SQLE inhibitor Terbinafine significantly inhibited the growth of hepatocellular cancer and CRC cells in xenograft models [45, 64], suggesting that the inhibition of SQLE may be a promising strategy for cancer treatment. However, when cholesterol synthesis is pharmaceutically inhibited, dietary cholesterol might represent the majority of blood cholesterol. Therefore, the effect of dietary cholesterol on therapies based on inhibition of SQLE should be determined in the future. In conclusion, we show that SQLE is up-regulated in CRCs with p53 inactivation and elevated c-MYC/AP4 expression as it is directly and/or indirectly regulated by these factors. SQLE may therefore serve as a potential therapeutic target for treatment of CRCs with p53 inactivation and elevated c-MYC/AP4 expression in the future.
Regulation and therapeutic inhibition of SQLE in CRC cells. (A) In normal cells, wt p53 and low expression of c-MYC maintain low levels of SQLE and cholesterol resulting in controlled cell proliferation. (B) In CRC cells p53 mutation, the resulting decrease in miR-205, and high c-MYC expression lead to an increase in SQLE expression and elevated cholesterol levels, which results in increased cell proliferation. (C) Inhibition of SQLE results in low cholesterol levels and decreased proliferation in CRC cells. A-C: Different levels of activity and/or expression are indicated by varying sizes of letters and rectangles.
Supplementary Material
Supplementary figures and tables.
Acknowledgements
We thank Jinjiang Chou for providing CRC cell lines harboring inducible pRTR vectors and/or AP4 deletions, which were described before [20]. We also thank Ursula Götz for technical assistance.
Funding
This study was funded by a German Cancer Consortium/DKTK project grant to HH. YD is a recipient of a fellowship of the Oversea Study Program of Guangzhou Elite Project (GEP).
Author contributions
HH supervised the study. YD, MR, and HH designed experiments. YD and MR performed experiments and analyzed results. MR performed bioinformatics analyses. YD, MR and HH wrote the manuscript. All authors have read and approved the final manuscript.
Competing Interests
The authors have declared that no competing interest exists.
References
1. Bray F, Ferlay J, Soerjomataram I, Siegel RL, Torre LA, Jemal A. Global cancer statistics 2018: GLOBOCAN estimates of incidence and mortality worldwide for 36 cancers in 185 countries. CA Cancer J Clin. 2018;68:394-424
2. Siegel RL, Miller KD, Fedewa SA, Ahnen DJ, Meester RGS, Barzi A. et al. Colorectal cancer statistics, 2017. CA Cancer J Clin. 2017;67:177-93
3. Ohhara Y, Fukuda N, Takeuchi S, Honma R, Shimizu Y, Kinoshita I. et al. Role of targeted therapy in metastatic colorectal cancer. World J Gastrointest Oncol. 2016;8:642-55
4. Leowattana W, Leowattana P, Leowattana T. Systemic treatment for metastatic colorectal cancer. World J Gastroenterol. 2023;29:1569-88
5. Xie YH, Chen YX, Fang JY. Comprehensive review of targeted therapy for colorectal cancer. Signal Transduct Target Ther. 2020;5:22
6. Cancer Genome Atlas N. Comprehensive molecular characterization of human colon and rectal cancer. Nature. 2012;487:330-7
7. Dang CV. MYC on the path to cancer. Cell. 2012;149:22-35
8. Kortlever RM, Sodir NM, Wilson CH, Burkhart DL, Pellegrinet L, Brown Swigart L. et al. Myc Cooperates with Ras by Programming Inflammation and Immune Suppression. Cell. 2017;171:1301-15 e14
9. Sodir NM, Kortlever RM, Barthet VJA, Campos T, Pellegrinet L, Kupczak S. et al. MYC Instructs and Maintains Pancreatic Adenocarcinoma Phenotype. Cancer Discov. 2020;10:588-607
10. Gabay M, Li Y, Felsher DW. MYC activation is a hallmark of cancer initiation and maintenance. Cold Spring Harb Perspect Med. 2014 4
11. Zhan T, Rindtorff N, Boutros M. Wnt signaling in cancer. Oncogene. 2017;36:1461-73
12. He TC, Sparks AB, Rago C, Hermeking H, Zawel L, da Costa LT. et al. Identification of c-MYC as a target of the APC pathway. Science. 1998;281:1509-12
13. Sansom OJ, Meniel VS, Muncan V, Phesse TJ, Wilkins JA, Reed KR. et al. Myc deletion rescues Apc deficiency in the small intestine. Nature. 2007;446:676-9
14. Hartl M. The Quest for Targets Executing MYC-Dependent Cell Transformation. Front Oncol. 2016;6:132
15. Kastenhuber ER, Lowe SW. Putting p53 in Context. Cell. 2017;170:1062-78
16. Yaeger R, Chatila WK, Lipsyc MD, Hechtman JF, Cercek A, Sanchez-Vega F. et al. Clinical Sequencing Defines the Genomic Landscape of Metastatic Colorectal Cancer. Cancer Cell. 2018;33:125-36 e3
17. Chua NK, Coates HW, Brown AJ. Squalene monooxygenase: a journey to the heart of cholesterol synthesis. Prog Lipid Res. 2020;79:101033
18. Cirmena G, Franceschelli P, Isnaldi E, Ferrando L, De Mariano M, Ballestrero A. et al. Squalene epoxidase as a promising metabolic target in cancer treatment. Cancer Lett. 2018;425:13-20
19. Bunz F, Hwang PM, Torrance C, Waldman T, Zhang Y, Dillehay L. et al. Disruption of p53 in human cancer cells alters the responses to therapeutic agents. J Clin Invest. 1999;104:263-9
20. Chou J, Kaller M, Jaeckel S, Rokavec M, Hermeking H. AP4 suppresses DNA damage, chromosomal instability and senescence via inducing MDC1/Mediator of DNA damage Checkpoint 1 and repressing MIR22HG/miR-22-3p. Mol Cancer. 2022;21:120
21. Livak KJ, Schmittgen TD. Analysis of relative gene expression data using real-time quantitative PCR and the 2(-Delta Delta C(T)) Method. Methods. 2001;25:402-8
22. Guinney J, Dienstmann R, Wang X, de Reynies A, Schlicker A, Soneson C. et al. The consensus molecular subtypes of colorectal cancer. Nat Med. 2015;21:1350-6
23. Isella C, Brundu F, Bellomo SE, Galimi F, Zanella E, Porporato R. et al. Selective analysis of cancer-cell intrinsic transcriptional traits defines novel clinically relevant subtypes of colorectal cancer. Nat Commun. 2017;8:15107
24. Fischer M. Census and evaluation of p53 target genes. Oncogene. 2017;36:3943-56
25. Zhang L, Li Z, Skrzypczynska KM, Fang Q, Zhang W, O'Brien SA. et al. Single-Cell Analyses Inform Mechanisms of Myeloid-Targeted Therapies in Colon Cancer. Cell. 2020;181:442-59 e29
26. Vassilev LT, Vu BT, Graves B, Carvajal D, Podlaski F, Filipovic Z. et al. In vivo activation of the p53 pathway by small-molecule antagonists of MDM2. Science. 2004;303:844-8
27. Hünten S, Kaller M, Drepper F, Oeljeklaus S, Bonfert T, Erhard F. et al. p53-Regulated Networks of Protein, mRNA, miRNA, and lncRNA Expression Revealed by Integrated Pulsed Stable Isotope Labeling With Amino Acids in Cell Culture (pSILAC) and Next Generation Sequencing (NGS) Analyses. Mol Cell Proteomics. 2015;14:2609-29
28. Engeland K. Cell cycle regulation: p53-p21-RB signaling. Cell Death Differ. 2022;29:946-60
29. Fischer M, Grossmann P, Padi M, DeCaprio JA. Integration of TP53, DREAM, MMB-FOXM1 and RB-E2F target gene analyses identifies cell cycle gene regulatory networks. Nucleic Acids Res. 2016;44:6070-86
30. Hermeking H. MicroRNAs in the p53 network: micromanagement of tumour suppression. Nat Rev Cancer. 2012;12:613-26
31. Piovan C, Palmieri D, Di Leva G, Braccioli L, Casalini P, Nuovo G. et al. Oncosuppressive role of p53-induced miR-205 in triple negative breast cancer. Mol Oncol. 2012;6:458-72
32. Wong MM, Joyson SM, Hermeking H, Chiu SK. Transcription Factor AP4 Mediates Cell Fate Decisions: To Divide, Age, or Die. Cancers (Basel). 2021 13
33. Mermod N, Williams TJ, Tjian R. Enhancer binding factors AP-4 and AP-1 act in concert to activate SV40 late transcription in vitro. Nature. 1988;332:557-61
34. Jackstadt R, Röh S, Neumann J, Jung P, Hoffmann R, Horst D. et al. AP4 is a mediator of epithelial-mesenchymal transition and metastasis in colorectal cancer. J Exp Med. 2013;210:1331-50
35. Jung P, Menssen A, Mayr D, Hermeking H. AP4 encodes a c-MYC-inducible repressor of p21. Proc Natl Acad Sci U S A. 2008;105:15046-51
36. Ge Z, Zhang B, Bu X, Wang Y, Xiang L, Tan J. Molecular mechanism of activating protein-4 regulated growth of hepatocellular carcinoma. Tumour Biol. 2014;35:12441-7
37. Gill S, Stevenson J, Kristiana I, Brown AJ. Cholesterol-dependent degradation of squalene monooxygenase, a control point in cholesterol synthesis beyond HMG-CoA reductase. Cell Metab. 2011;13:260-73
38. Huang B, Song BL, Xu C. Cholesterol metabolism in cancer: mechanisms and therapeutic opportunities. Nat Metab. 2020;2:132-41
39. Huang P, Nedelcu D, Watanabe M, Jao C, Kim Y, Liu J. et al. Cellular Cholesterol Directly Activates Smoothened in Hedgehog Signaling. Cell. 2016;166:1176-87.e14
40. Luchetti G, Sircar R, Kong JH, Nachtergaele S, Sagner A, Byrne EF. et al. Cholesterol activates the G-protein coupled receptor Smoothened to promote Hedgehog signaling. Elife. 2016 5
41. Hooper JE, Scott MP. Communicating with Hedgehogs. Nat Rev Mol Cell Biol. 2005;6:306-17
42. Greenlee JD, Subramanian T, Liu K, King MR. Rafting Down the Metastatic Cascade: The Role of Lipid Rafts in Cancer Metastasis, Cell Death, and Clinical Outcomes. Cancer Res. 2021;81:5-17
43. Costa GA, de Souza SB, da Silva Teixeira LR, Okorokov LA, Arnholdt ACV, Okorokova-Façanha AL. et al. Tumor cell cholesterol depletion and V-ATPase inhibition as an inhibitory mechanism to prevent cell migration and invasiveness in melanoma. Biochim Biophys Acta Gen Subj. 2018;1862:684-91
44. Kim JH, Kim CN, Kang DW. Squalene Epoxidase Correlates E-Cadherin Expression and Overall Survival in Colorectal Cancer Patients: The Impact on Prognosis and Correlation to Clinicopathologic Features. J Clin Med. 2019 8
45. Li C, Wang Y, Liu D, Wong CC, Coker OO, Zhang X. et al. Squalene epoxidase drives cancer cell proliferation and promotes gut dysbiosis to accelerate colorectal carcinogenesis. Gut. 2022;71:2253-65
46. Helms MW, Kemming D, Pospisil H, Vogt U, Buerger H, Korsching E. et al. Squalene epoxidase, located on chromosome 8q24.1, is upregulated in 8q+ breast cancer and indicates poor clinical outcome in stage I and II disease. Br J Cancer. 2008;99:774-80
47. Brown DN, Caffa I, Cirmena G, Piras D, Garuti A, Gallo M. et al. Squalene epoxidase is a bona fide oncogene by amplification with clinical relevance in breast cancer. Sci Rep. 2016;6:19435
48. Ge H, Zhao Y, Shi X, Tan Z, Chi X, He M. et al. Squalene epoxidase promotes the proliferation and metastasis of lung squamous cell carcinoma cells though extracellular signal-regulated kinase signaling. Thorac Cancer. 2019;10:428-36
49. Stopsack KH, Gerke TA, Andren O, Andersson SO, Giovannucci EL, Mucci LA. et al. Cholesterol uptake and regulation in high-grade and lethal prostate cancers. Carcinogenesis. 2017;38:806-11
50. Gouw AM, Margulis K, Liu NS, Raman SJ, Mancuso A, Toal GG. et al. The MYC Oncogene Cooperates with Sterol-Regulated Element-Binding Protein to Regulate Lipogenesis Essential for Neoplastic Growth. Cell Metab. 2019;30:556-72 e5
51. Li X, Wu JB, Li Q, Shigemura K, Chung LW, Huang WC. SREBP-2 promotes stem cell-like properties and metastasis by transcriptional activation of c-Myc in prostate cancer. Oncotarget. 2016;7:12869-84
52. Hall Z, Wilson CH, Burkhart DL, Ashmore T, Evan GI, Griffin JL. Myc linked to dysregulation of cholesterol transport and storage in nonsmall cell lung cancer. J Lipid Res. 2020;61:1390-9
53. Sun H, Li L, Li W, Yang F, Zhang Z, Liu Z. et al. p53 transcriptionally regulates SQLE to repress cholesterol synthesis and tumor growth. EMBO Rep. 2021;22:e52537
54. Kalogirou C, Linxweiler J, Schmucker P, Snaebjornsson MT, Schmitz W, Wach S. et al. MiR-205-driven downregulation of cholesterol biosynthesis through SQLE-inhibition identifies therapeutic vulnerability in aggressive prostate cancer. Nat Commun. 2021;12:5066
55. Fischer M, Steiner L, Engeland K. The transcription factor p53: not a repressor, solely an activator. Cell Cycle. 2014;13:3037-58
56. Orang AV, Safaralizadeh R, Hosseinpour Feizi MA, Somi MH. Diagnostic and prognostic value of miR-205 in colorectal cancer. Asian Pac J Cancer Prev. 2014;15:4033-7
57. Hagman Z, Haflidadóttir BS, Ceder JA, Larne O, Bjartell A, Lilja H. et al. miR-205 negatively regulates the androgen receptor and is associated with adverse outcome of prostate cancer patients. Br J Cancer. 2013;108:1668-76
58. Wang Z, Liao H, Deng Z, Yang P, Du N, Zhanng Y. et al. miRNA-205 affects infiltration and metastasis of breast cancer. Biochem Biophys Res Commun. 2013;441:139-43
59. Zhang T, Zhang J, Cui M, Liu F, You X, Du Y. et al. Hepatitis B virus X protein inhibits tumor suppressor miR-205 through inducing hypermethylation of miR-205 promoter to enhance carcinogenesis. Neoplasia. 2013;15:1282-91
60. Lee WS, Chen RJ, Wang YJ, Tseng H, Jeng JH, Lin SY. et al. In vitro and in vivo studies of the anticancer action of terbinafine in human cancer cell lines: G0/G1 p53-associated cell cycle arrest. Int J Cancer. 2003;106:125-37
61. Ho PY, Liang YC, Ho YS, Chen CT, Lee WS. Inhibition of human vascular endothelial cells proliferation by terbinafine. Int J Cancer. 2004;111:51-9
62. Abdel-Rahman SM, Nahata MC. Oral terbinafine: a new antifungal agent. Ann Pharmacother. 1997;31:445-56
63. Else PL. The highly unnatural fatty acid profile of cells in culture. Prog Lipid Res. 2020;77:101017
64. Zhang EB, Zhang X, Wang K, Zhang F, Chen TW, Ma N. et al. Antifungal agent Terbinafine restrains tumor growth in preclinical models of hepatocellular carcinoma via AMPK-mTOR axis. Oncogene. 2021;40:5302-13
Author contact
![]() Corresponding author: Dr. Heiko Hermeking, Experimental and Molecular Pathology, Institute of Pathology, Ludwig-Maximilians-Universität München, Thalkirchner Strasse 36, D-80337 Munich, Germany; e-mail: heiko.hermekinguni-muenchen.de.
Corresponding author: Dr. Heiko Hermeking, Experimental and Molecular Pathology, Institute of Pathology, Ludwig-Maximilians-Universität München, Thalkirchner Strasse 36, D-80337 Munich, Germany; e-mail: heiko.hermekinguni-muenchen.de.