Impact Factor ISSN: 1449-2288
- Issue 12; 2026
- Issue 11; 2026
- Issue 10; 2026
- Issue 9; 2026
- Issue 8; 2026
- Volume 22; 2026
- Past Issues
- Advance Articles
- Editorial Board
- Cover Images
- Index & Coverage
- Cover Suggestion
- Special Issues
Introduction
Materials and Methods
Results
Discussion
Abbreviations
Supplementary Material
Acknowledgements
References

 Global reach, higher impact
Int J Biol Sci 2024; 20(4):1389-1409. doi:10.7150/ijbs.83774 This issue Cite
Research Paper
UPP1 enhances bladder cancer progression and gemcitabine resistance through AKT
Wenzhi Du1,2#, Sheng Tu1,3#, Wenxiu Zhang4#, Yi Zhang5,6, Wei Liu7, Kangping Xiong1,3, Fenfang Zhou8, Na Li9, Renjie Zhang1,3, Jingtian Yu1,3, Mingxing Li3, Wan Xiang10, Kaiyu Qian1,10, Gang Wang3,10, Yu Xiao3,10 ![]() , Xinghuan Wang3,11
, Xinghuan Wang3,11 ![]() , Lingao Ju1,10
, Lingao Ju1,10 ![]()
1. Hubei Key Laboratory of Urological Diseases, Laboratory of Precision Medicine, Zhongnan Hospital of Wuhan University, Wuhan, China.
2. Department of Urology, The First Affiliated Hospital of Shandong First Medical University & Shandong Provincial Qianfoshan Hospital, Shandong Medicine and Health Key Laboratory of Organ Transplantation and Nephrosis, Shandong Institute of Nephrology, Jinan, Shandong, China.
3. Department of Urology, Zhongnan Hospital of Wuhan University, Wuhan, China.
4. Department of Pediatrics, Maternal and Child Health Care Hospital of Shandong Province, Jinan, China.
5. Euler Technology, ZGC Life Sciences Park, Beijing, China.
6. Center for Quantitative Biology, School of Life Sciences, Peking University, Beijing, China.
7. Department of Urology, Aerospace Center Hospital, Peking University Aerospace School of Clinical Medicine, Beijing, China.
8. Department of Radiology, Zhongnan Hospital of Wuhan University, Wuhan, China.
9. State Key Laboratory of Ophthalmology, Zhongshan Ophthalmic Center, SunYat-sen University, Guangzhou, China.
10. Department of Biological Repositories, Human Genetic Resources Preservation Center of Hubei Province, Zhongnan Hospital of Wuhan University, Wuhan, China.
11. Medical Research Institute, Frontier Science Center of Immunology and Metabolism, TaiKang Center for Life and Medical Sciences, Wuhan University, Wuhan, China.
# These authors contributed equally to this work.
Received 2023-2-23; Accepted 2024-1-19; Published 2024-1-27
Abstract

UPP1, a crucial pyrimidine metabolism-related enzyme, catalyzes the reversible phosphorylation of uridine to uracil and ribose-1-phosphate. However, the effects of UPP1 in bladder cancer (BLCA) have not been elucidated. AKT, which is activated mainly through dual phosphorylation (Thr308 and Ser473), promotes tumorigenesis by phosphorylating downstream substrates. This study demonstrated that UPP1 promotes BLCA cell proliferation, migration, invasion, and gemcitabine resistance by activating the AKT signaling pathway in vitro and in vivo. Additionally, UPP1 promoted AKT activation by facilitating the binding of AKT to PDK1 and PDK2 and the recruitment of phosphatidylinositol 3,4,5-triphosphate to AKT. Moreover, the beneficial effects of UPP1 on BLCA tumorigenesis were mitigated upon UPP1 mutation with Arg94 or MK2206 treatment (AKT-specific inhibitor). AKT overexpression or SC79 (AKT-specific activator) treatment restored tumor malignancy and drug resistance. Thus, this study revealed that UPP1 is a crucial oncogene and a potential therapeutic target for BLCA and that UPP1 activates the AKT signaling pathway and enhances tumorigenesis and drug resistance to gemcitabine.
Keywords: UPP1, AKT, gemcitabine, metastasis, bladder cancer.
Introduction
According to GLOBOCAN epidemiological data from 2020, there were 573,000 newly diagnosed bladder cancer (BLCA) cases and 213,000 deaths related to BLCA worldwide, which poses a severe threat to human health [1]. Based on the depth of muscle invasion, BLCA can be mainly classified into non-muscle-invasive BLCA (NMIBC) and muscle-invasive BLCA (MIBC) [2]. MIBC accounts for almost 70% of organ-confined BLCA [3], while 15%-20% of NMIBC tumors are transformed into MIBC, which is associated with an increased mortality rate [4]. Approximately 50% of patients with MIBC develop metastasis before undergoing radical surgery [5]. The major limiting factor for BLCA treatment is the high recurrence rate [6]. The main treatment options for BLCA include transurethral resection of bladder tumors, laparoscopic radical cystectomy, and adjuvant chemotherapy (e.g., gemcitabine) [7, 8]. However, these therapeutic strategies have not markedly improved the overall survival (OS) rate of patients with BLCA [9]. Researchers have identified the genes and pathways that drive the pathogenesis of urothelial carcinoma through genome-wide expression and sequencing studies. More than one molecular subclass of urothelial carcinoma has been identified, spanning traditional rank and stage categories [10]. The molecular mechanisms underlying BLCA tumorigenesis must be elucidated to identify novel targeted therapies and enhance BLCA patients' quality of life and prognosis [11].
AKT, a serine/threonine kinase, mediates several signal transduction pathways [12]. Additionally, AKT regulates downstream proteins that adjust cell proliferation, migration, and apoptosis, including FOXO1 and GSK3β. The expression of AKT is dysregulated in various malignancies [13]. AKT activity is upregulated in BLCA, promoting tumor cell proliferation and inducing metabolic alterations [14]. Various upstream growth signals activate AKT. Two critical activating sites have been identified in AKT (Thr308 and Ser473) [15]. Activated phosphoinositide 3-kinase (PI3K) is reported to promote phosphatidylinositol 3,4,5-triphosphate (PIP3) generation and help AKT activation in the cell membrane [16]. Phosphatase and tensin homolog (PTEN) antagonizes PI3K by dephosphorylating PIP3 to generate phosphatidylinositol 4,5-bisphosphate (PIP2), inhibiting AKT activation [17]. AKT binds to PIP3 through its pleiotropic substrate protein homology (PH) domain, promoting the translocation of AKT to the cell membrane where its Thr308 site is phosphorylated by PDK1 [18] and its Ser473 site is phosphorylated by PDK2 [19], leading to classic activation. Various clinical trials have reported that suppression of the AKT signaling pathway is associated with tumor regression [20]. The Food and Drug Administration approved several inhibitors of the AKT signaling pathway based on their efficacy and safety in clinical trials [21]. Thus, treatments that target AKT can be integrated into cancer prevention and management.
Tumor development is critically dependent on pyrimidine metabolism. Several drugs targeting key pyrimidine metabolism-related enzymes have been applied in clinical practice [22, 23]. Uridine phosphorylase, a crucial enzyme for maintaining uridine homeostasis and salvaging pyrimidines, catalyzes the reversible phosphorylation of uridine to uracil and ribose-1-phosphate [24]. Previous studies have identified UPP1 and UPP2 as two types of uridine phosphorylases. The distribution and expression of UPP1 are higher than those of UPP2 [25]. UPP1 expression is associated with the outcome of different types of malignancies [26, 27]. However, it remains unclear whether UPP1 contributes to BLCA tumorigenesis.
This study demonstrated that UPP1 was upregulated in human BLCA tissues and elucidated the consequences of UPP1 upregulation in different BLCA cell lines in vitro and in vivo. Additionally, UPP1 was demonstrated to interact with the C-terminus of AKT and upregulate the activity of AKT. UPP1 stimulates cell proliferation, migration, invasion, and gemcitabine resistance and inhibits apoptosis and reactive oxygen species (ROS) generation in BLCA through the AKT signaling pathway. In contrast, the UPP1 mutant UPP1-R94A did not interact with AKT. The functional role of UPP1 in human BLCA pathogenesis demonstrated in this study provides novel ideas for diagnosing and treating BLCA.
Materials and Methods
Cell culture and reagents
SV-HUC-1 (human uroepithelial cells), HEK-293T (human embryonic kidney cells), UM-UC-3, J82, SCaBER, 5637, T24, and RT4 (human BLCA cell lines) were supplied by the Cell Bank of Chinese Academy of Science (Shanghai, China) with authentication. According to the recommended cell culture protocols, Roswell Park Memorial Institute-1640 medium, minimal essential medium, Dulbecco's modified Eagle's medium, and McCoy's 5A medium (Gibco, USA) were used to culture the above cell lines with 10% fetal bovine serum (FBS) and 1% penicillin-streptomycin solution (Gibco, USA). Cells were cultured at 5% CO2 and 37℃. Supplementary Table S1 contains the catalog numbers and commercial sources of the antibodies utilized in this research. The AKT-specific inhibitor MK2206 (S1078, Selleck), the AKT-specific activator SC79 (HY-18749, MedChemExpress), and gemcitabine (S1149, Selleck) were obtained from the indicated commercial sources.
Short-interfering RNAs (siRNAs) and plasmid construction and transfection
Shanghai GenePharma Co., Ltd. provided the siRNAs against UPP1 (siUPP1). Supplementary Table S2 contains the listings of siUPP1 sequences. The UPP1 overexpression plasmid (Cat. #EX-Q0192-M35) was purchased from OmicsLinkTM. The plasmid encoding UPP1-R94A was constructed based on wild-type (WT) UPP1 (UPP1-WT). Supplementary Table S3 contains the primer sequences for UPP1-R94A plasmid construction. All plasmids were subjected to sequencing before transfection to ensure that they were mutation-free. Lipofectamine 3000 reagent (Invitrogen, USA) was used for transfection.
RNA extraction, reverse transcription, and quantitative reverse transcription PCR (qRT-PCR)
HiPure total RNA mini kit (Cat. #R4111, Magen, China) was used to extract total RNA, following the product's instructions. The isolated RNA (1 μg) was reverse-transcribed into complementary DNA (cDNA). iQTM SYBR® Green Supermix (Bio-Rad, USA) and cDNA (500 ng) were included in 20 μL qRT-PCR reaction volume. Supplementary Table S4 contains the primer sequences for UPP1 and ACTB. The expression levels of ACTB were used to normalize those of target genes.
Methyl thiazolyl tetrazolium (MTT) assay
Pretreated cells were seeded in five repetitive 96-well plates for five days (3000 cells/well). The cells in each well were cultured in 200 μL medium with 10% FBS. After one day of incubation, the cells of the first 96-well plate were incubated with 20 μL of MTT (Sigma) for four hours. After discarding the supernatant, the cells were solubilized in 150 μL of dimethyl sulfoxide (DMSO). The spectrophotometer (Spectramax M5, Molecular Devices) was used to examine the reaction mixture's absorbance (570 nm). The remaining 96-well plates were individually subjected to the MTT assay at the same time each day for the next four days.
Colony formation assay
Post-transfection cells (1000 cells/well) were seeded in a 6-well plate and cultured in an incubator for approximately nine days to form visible colonies. After being treated with 4% formaldehyde, the colonies were stained with a 0.1% solution of crystal violet for 30 mins. ImageJ software was used to count colonies.
Flow cytometric analysis
Pretreated cells were washed thrice with cold phosphate-buffered saline (PBS, pH 7.4) for cell cycle analysis. Cells were then resuspended in 1× DNA staining solution, permeabilized with permeabilization solution, and stained with propidium iodide (Cat. #CCS012, Multisciences, China) in the dark at 37°C for 30 mins. To analyze the apoptosis rate, we harvested and incubated cells with the reagents of the annexin V-fluorescein isothiocyanate apoptosis analysis kit, following the manufacturer's instructions (Cat. #AO2001-02P-G, Sungene Biotech, China). To measure the intracellular ROS levels in BLCA cells, we harvested and washed post-transfection cells with cold PBS. Next, the cells were resuspended in 1 mL FBS-free medium and incubated with 10 mM 2',7'-dichlorofluorescein diacetate (a fluorescent probe) for 30 mins in the dark at 37℃ (Cat. #D6883, Sigma-Aldrich, USA). Cells were then thoroughly washed thrice to remove the unbound probe and analyzed using a flow cytometer (Cat. #FC500, CytoFLEX S, Beckman, USA). The raw data were processed using FlowJo software (v10.8.1).
Transwell assay
To perform the migration assay, we filled 24-well plates with polycarbonate transwell filters (8-μm pore size, Corning, USA). Next, 200 μL of FBS-free medium inoculated with cells (4 × 10⁴ UM-UC-3 and T24 cells; 1 × 10⁵ cells for SCaBER and 5637 cells) was added to the upper chamber. FBS-containing medium was placed in the lower chamber (600 μL). After 24 hrs of incubation, the cells were fixed with 4% paraformaldehyde and stained with 0.1% crystal violet for 30 mins. Cotton swabs were used to wipe the cells from the inner layers of the filter, and the chamber was carefully washed and dried. The migrated cells were imaged under an inverted microscope. ImageJ software was used to calculate the number of migrated cells. Matrigel was added to the chamber to perform the invasion assay, and the chamber was incubated for 1 hr at 37℃ to cover the filter. The other protocols for the invasion assay were identical to those for the migration assay.
Wound healing assay
Equivalent transfected cells were placed in a 6-well plate at optimal confluency (80-90%). After 48 hrs, when the cells reached 100% confluency, the cell monolayer was scratched with a pipette tip. The image of the monolayer at 0 hrs was captured. After being washed with PBS, the cells were cultured in FBS-free medium for 36 hrs. The image of the monolayer was captured at 36 hrs. The wound healing percentages at 0 and 36 hrs were compared (100% - (scratch area at 36 hrs/scratch area at 0 hrs)) in different groups.
Immunoblotting analysis
Cells were washed with PBS and lysed on ice for 30 mins with radioimmunoprecipitation assay lysis buffer containing protease and phosphatase inhibitors. Next, the lysate was centrifuged at 3000 rpm and 4℃ for 10 mins. The bicinchoninic acid (BCA) assay kit (Cat. #P0011, Beyotime, China) was utilized to assess the protein concentration in the supernatant. Denaturation of the samples was carried out using sodium dodecyl sulfate (SDS) buffer at 95 ℃ for 10 mins. SDS-polyacrylamide gel electrophoresis was performed on the protein samples. The gel percentage depends on the molecular weight of the proteins to be tested. The resolved proteins were transferred to a polyvinylidene fluoride membrane (0.45-μm pore size). To prevent nonspecific binding, we blocked the membrane with 5% skim milk in 1× Tris-buffered saline containing Tween-20 (20 mM Tris, 150 mM NaCl, 0.1% Tween-20, pH 7.4) for 2 hrs at room temperature (RT, 18-25 °C). Next, the indicated primary and secondary antibodies were probed onto the membrane. Immunoreactive signals were developed using chemiluminescence and imaged using a gel imager (BioSpectrum 515 Imaging System, UVP).
Co-immunoprecipitation (co-IP) analysis
A lysis buffer (150 mM NaCl, 150 mM Tris, 0.4% NP-40, pH 7.4) containing protease and phosphatase inhibitors was used to lyse cells. The lysate was incubated with 1 μL of undiluted target antibody at 4 ℃ for 4-6 hrs to ensure the binding of the target protein to the antibody. Next, protein A magnetic beads were washed thrice with lysis buffer. Each sample was incubated with 20 μL of beads at 4°C for 2 hrs to ensure effective binding between antibodies and beads. The supernatant was removed, and the beads were washed thrice with lysis buffer. The protein-antibody-bead complex was eluted with 1× SDS buffer and boiled at 100 °C for 10 mins. Immunoblotting was performed to test the expression of the indicated proteins.
Glutathione S transferase (GST) pull-down assay
His-UPP1 (Cat. #ab101152, Abcam, UK), GST-AKT (Cat. #CSB-EP001553HU, CUSABIO, China), and GST (Cat. #CSB-RP101744Ba, CUSABIO, China) fusion proteins were obtained from the indicated commercial sources. GST and GST-AKT fusion proteins (2 μg) were dissolved in buffer (150 mM NaCl, 150 mM Tris, 0.4% NP-40, pH 7.4) with protease and phosphatase inhibitors and incubated with 20 μL of washed glutathione-Sepharose beads at 4 °C for 2 hrs. The beads were washed thrice with washing buffer and incubated with 2 μg His-UPP1 fusion protein at 4 ℃ for 2 hrs. The fused protein-GST protein-bead complex was eluted with 1× SDS buffer and denatured for 10 mins at 100 °C. The expression levels of the indicated proteins in each sample were evaluated by immunoblotting analysis.
AKT kinase activity assay
The AKT enzyme activity in the cellular extract was analyzed with the AKT kinase activity kit (Cat. #ADI-EKS-400A, Enzo, USA), following the procedures of the product manual. The protein concentration in the sample was examined using the BCA protein assay kit (Cat. #P0011, Beyotime, China). The sample volume for the AKT kinase activity assay was 30 μL. The absorbance of the reaction mixture at 450 nm was measured to determine AKT kinase activity. Absorbance (450 nm)/protein mass (mg) was calculated to obtain the quantified AKT kinase activity.
PIP3 pull-down assay
The PIP3 beads (Cat. #P-B00S, Echelon Biosciences, USA) were centrifuged at 800 g and resuspended in binding buffer (150 mM NaCl, 150 mM Tris, 0.4% NP-40, pH 7.4). Subsequently, the cells were lysed with binding buffer. Each sample was incubated at 4 °C with 100 μL PIP3 beads for 3 hrs. The solution containing protein and beads underwent 4 washes with washing buffer. The bound proteins were eluted with 1× SDS loading buffer and denatured at 100 °C for 10 mins. The complex was analyzed using immunoblotting analysis.
Immunofluorescence
The transfected cells were pre-seeded on slides, fixed with 4% formaldehyde for 30 mins, and incubated with a buffer solution (2% bovine serum albumin and 0.3% Triton X-100) for 40 mins. Next, the cells were washed thrice with PBS and sequentially incubated with the primary antibodies (4 ℃, overnight), secondary antibodies (RT, 2 hrs), and 4',6-diamidino-2-phenylindole (1:1000, RT, 5 mins). The samples were sealed, air-dried, and imaged under a confocal microscope (Nikon, Japan).
Hematoxylin and eosin (H&E) staining and immunohistochemical (IHC) analysis
The paraffin sections (5 mm) of xenograft tissue samples were subjected to H&E staining. The dewaxed sections were cleared with xylene and rehydrated in an ethanol series (100%, 96%, 80%, 70%, and H2O) at the indicated time points and stained with 10% hematoxylin (Sigma-Aldrich, USA). The sample was washed and stained with a solution of 1% eosin (Sigma-Aldrich, USA) containing 0.2% glacial acetic acid. After each step, the sections were immediately cleared with xylene and dehydrated in an ethanol series (70%, 80%, 96%, and 100%). An inverted phase contrast microscope was used to image the sections. To perform IHC analysis, the tissue samples of experimental animals and tissue microarray slides were sequentially formalin-fixed, paraffin-embedded, sectioned, deparaffinized, and hydrated. Citrate buffer (pH 6.0) was used for antigen retrieval. The sections were incubated with H2O2 (0.3%) to block endogenous peroxidase activity and sequentially probed with primary and secondary antibodies. Immunoreactive signals were developed using peroxidase and 3,3'-diaminobenzidine (DAB) tetrahydrochloride reactions. Finally, the samples were incubated in DAB (5-10 mins).
Xenograft mouse model
Shanghai GenePharma Co., Ltd. provided the lentivirus packaged with short hairpin RNA against UPP1 (shUPP1) or negative control shRNA (shNC); Supplementary Table S2 lists the sequences. UM-UC-3 cells were infected with lentivirus. The recombinant cells were screened using 1 μg/mL puromycin (Sigma, USA). Wuhan BNT Bioscience Co., Ltd. provided male BALB/c nude mice aged 6 weeks. Mice were randomly assigned to different groups. To examine the function of UPP1 in BLCA cell proliferation in vivo, we randomly established two groups (n = 5) of nude mice. Mice were subcutaneously injected with shNC-transfected or shUPP1-transfected UM-UC-3 cells (1 × 10⁶ cells) diluted in 100 μL cold PBS (for each point) at two different points. The volume of the tumor was regularly determined using a vernier caliper. The tumor was allowed to grow for 25 days. The tumors were harvested via surgery from the experimental animals for subsequent experiments. To investigate metastasis in vivo, we randomly divided mice into two groups (n = 4). shNC-transfected or shUPP1-transfected UM-UC-3 cells were intravenously injected (1 × 10⁶ cells) via the tail vein. After six weeks of tumor cell growth, the fluorescence intensity of green fluorescent protein (GFP)-expressing cells was determined using Living Image software (Caliper Life Sciences). The lung tissue was excised and subjected to H&E staining. To evaluate in vivo tumor gemcitabine resistance, we randomly divided mice into four groups (n = 4) and subcutaneously injected mice with shNC-transfected or shUPP1-transfected UM-UC-3 cells (1 × 10⁶ cells). The tumor was allowed to grow for 15 days until the tumors were visible. Next, the mice were intraperitoneally administered 200 μL of DMSO or gemcitabine (50 mg/kg bodyweight) twice a week according to the experimental groupings. Group allocation was blinded during experimental result evaluation. For the xenograft mouse model of UPP1 overexpression, T24 cells were transfected with lentiviruses containing UPP1 overexpression sequences and vector sequences (LV5) provided by Shanghai GenePharma Co., Ltd. As described above, the subcutaneous tumor mouse and the experimental lung metastasis mouse models were constructed. The IVIS Spectrum living imaging system was used to calculate the fluorescence intensity of GFP-expressing cells. Radiant efficiency was calculated by (p/sec/cm2/sr)/(μW/cm2). The color scale is annotated beside each figure. The Wuhan University Institutional Animal Care and Use Committee approved all experimental protocols (approval No. ZN2022030).
Validation of diagnostic value from public databases and tissue microarrays
The Cancer Genome Atlas (TCGA)-BLCA RNA sequencing with clinical data was obtained from the TCGA database (https://portal.gdc.com). The GSE13507, GSE32894, and GSE48075 datasets were obtained from the Gene Expression Omnibus database (https://www.ncbi.nlm.nih.gov/geo/). Kaplan-Meier survival curves were generated using R (version 3.5.2) and R Bioconductor. The clinical value of UPP1 for diagnosing BLCA was demonstrated using receiver operating characteristic (ROC) curves [28]. Shanghai Outdo Biotech provided the tissue microarray (Cat. #HBlaU079Su01). The slide was scanned entirely using an Apero VERSA 8 phase contrast microscope (Leica, German). Image-Pro Plus 6.0 was used to analyze the average optical density (AOD) to represent UPP1 expression. All picture backgrounds were flattened with a max feature size of 840 (pix). Area and IOD were selected as measurements. To calibrate the optical density, we set the incident level at 255. The color segmentation was based on histogram hue-saturation-intensity (HSI) mode (H: 0-30, S: 0-254, I: 0-220). After applying the color filter, transparent white was selected, and the picture was turned to grayscale (8-bit). The target area's integral optical density (IOD) value was also automatically calculated. The AOD values are calculated as follows: AOD = IOD/area. Two pathologists checked the data accuracy.
Gene set enrichment analysis (GSEA) and gene set variation analysis (GSVA)
Based on normalized TCGA-BLCA data, the median expression level of UPP1 was chosen as the cutoff point for dividing the samples into high-expression and low-expression groups. Visualization of the analysis was performed using javaGSEA. The HALLMARK gene sets were selected as a reference, and the false discovery rate was calculated. The cutoff for determining significantly altered pathways was p < 0.05 [29]. To perform GSVA, TCGA datasets were analyzed using the R package GSVA with the method = 'ssgsea' as the parameter. Spearman correlation analysis was used to determine the correlation coefficients between genes and pathways. p < 0.05 was considered significant for differences.
Statistical analysis
Mean ± standard deviation was used to represent all data. The experiments were repeated thrice each, and data from three individual experiments were represented in all analyses. Means between the different groups were compared using two-tailed Student's t-test and one-way analysis of variance followed by Tukey's post-hoc test. Kaplan-Meier analysis was performed to estimate the OS. Survival curves were compared using log-rank tests. SPSS v. 25.0. was used to perform all statistical analyses. p < 0.05 indicates significant difference in data. Levels of statistical significance are indicated as follows: *: p < 0.05; **: p < 0.01; ***: p < 0.001; ns: not significant (p > 0.05).
Results
Prognostic value of UPP1 in BLCA
The UPP1 expression levels in healthy and BLCA tissues curated in public databases and a tissue chip were investigated (Fig. 1A). RNA sequencing and clinical data were retrieved from the TCGA-BLCA dataset. Bioinformatics analysis of unpaired samples revealed that UPP1 expression in tumor tissues was significantly higher than that in non-tumor tissues (Supplementary Fig. S1A). Furthermore, the results of paired sample analysis were consistent with those of unpaired sample analysis (Supplementary Fig. S1B). UPP1 expression in the T3 and T4 stage tumors was upregulated when compared with that in the T1 and T2 stage tumors (Supplementary Fig. S1C). Next, data were mined from the Gene Expression Profiling Interactive Analysis (GEPIA) website (http://gepia2.cancer-pku.cn), which enables visualization and interactive analysis of cancer gene expression profiles based on TCGA and Genotype-Tissue Expression databases [30]. GEPIA revealed that UPP1 expression was positively correlated with BLCA stage (Supplementary Fig. S1D).
UPP1 expression in BLCA. (A) Diagram of evidence sources of UPP1 as an essential prognostic biomarker. (B) Immunohistochemical staining of UPP1 in different stages of BLCA from the tissue microarray. (C) Relative expression in paired adjacent tissues and BLCA tissues from the tissue microarray. (D) Kaplan-Meier analysis of overall survival of samples in the tissue microarray. (E) The relative expression of UPP1 in BLCA cell lines was examined using qRT-PCR. *: p < 0.05; **: p < 0.01; ***: p < 0.001; ns: not significant (p > 0.05).
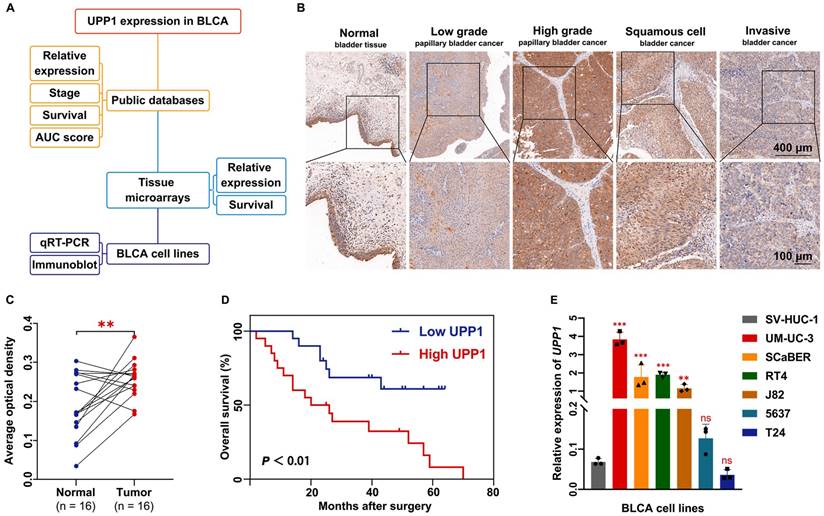
Additionally, a BLCA tissue chip was analyzed to further support the findings. The tissue chip was subjected to IHC. The AOD of each site was measured as an indirect indicator of gene expression [31, 32]. The median value of AOD was selected as the cutoff point to classify the samples into high-expression and low-expression groups. The IHC staining intensity in BLCA tissues was higher than that in non-tumor tissues (Supplementary Fig. S1E). High-grade, squamous cell, and infiltrating BLCA tissue exhibited increased IHC staining intensity (Fig. 1B). Analysis of the AODs of paired (Fig. 1C) and unpaired (Supplementary Fig. S1F) samples revealed that UPP1 expression in tumor tissues was higher than that in non-tumor tissues. To examine the clinical value of UPP1, ROC curves based on TCGA data were analyzed to evaluate the ability of UPP1 to differentiate between non-tumor and malignant tissues. The area under the curve value of UPP1 was 0.706 (Supplementary Fig. S1G), indicating good diagnostic accuracy.
Furthermore, data from the tissue microarray (Fig. 1D) and GSE13507 dataset (Supplementary Fig. S1H) were subjected to Kaplan-Meier survival analysis. The survival curve of the GSE13507 dataset was generated using the PrognoScan database (http://dna00.bio.kyutech.ac.jp/PrognoScan/index.html). UPP1 upregulation was associated with poor prognosis. Additionally, UPP1 expression was not correlated with other basic clinical parameters (gender and age) (Supplementary Table S5).
UPP1 expression is positively correlated with BLCA cell proliferation, metastasis, and invasion in vitro and in vivo
The expression levels of UPP1 in multiple BLCA cell lines were examined at the transcriptional and translational levels. The expression of UPP1 in UM-UC-3, SCaBER, RT4, and J82 cell lines was higher than that in SV-HUC-1 but was not significantly different in 5637 and T24 cell lines (Fig. 1E). The UPP1 protein levels in UM-UC-3, SCaBER, RT4, and J82 cell lines were higher than those in SV-HUC-1 but were lower in 5637 and T24 cell lines (Supplementary Fig. S1I). The knockdown efficiency and specificity of the three siRNAs were verified using qRT-PCR (Supplementary Fig. S2A-B) and immunoblotting analyses (Supplementary Fig. S2D). All three siRNA sequences were included in subsequent studies. The UPP1 overexpression plasmid was used to transfect cells. The overexpression efficiency of the plasmid was examined using qRT-PCR (Supplementary Fig. S2C) and immunoblotting analyses (Supplementary Fig. S2D).
MTT assay results showed that the proliferation rate of UPP1 knockdown BLCA cells was significantly lower than that of control cells (Fig. 2A and Supplementary Fig. S2E). Additionally, the viability of UPP1-overexpressing BLCA cells was higher than that of control cells (Supplementary Fig. S2F-G). The colony formation assay results revealed that the size and number of colonies formed by UPP1 knockdown BLCA cells were lower than those formed by control cells (Fig. 2B and Supplementary Fig. S2H-I). Meanwhile, the size and number of colonies formed by UPP1-overexpressing BLCA cells were higher than those of colonies formed by control cells (Supplementary Fig. S2J-K). Flow cytometric analysis demonstrated that the cell cycle of UPP1 knockdown cells was arrested at the G1 phase (Fig. 2C, Supplementary Figs. S2L and S3A-B). Meanwhile, UPP1 overexpression promoted cell cycle transition (Supplementary Figs. S2M and S3C-D).
UPP1 deficiency suppresses BLCA cell proliferation, metastasis, and invasion in vitro and in vivo. (A) MTT assay results revealed that UPP1 knockdown inhibited the proliferation of UM-UC-3 cells. (B) Statistical chart of the colony formation assay results with UPP1 knockdown UM-UC-3 cells. (C) The statistical chart of the flow cytometric analysis revealed that UPP1 knockdown promoted cell cycle arrest at the G1 phase. The weight (D) and volume (E) of tumors derived from shNC-transfected or shUPP1-transfected UM-UC-3 cells. (F-G) Statistical chart of the results of the transwell assay with UPP1 knockdown UM-UC-3 cells. (H) Statistical chart of the wound healing assay results with UPP1 knockdown UM-UC-3 cells. Fluorescence intensity (I) and H&E staining (J) of the lung from the BALB/c nude mouse metastasis model injected with Vector-transfected and UPP1-transfected T24 cells. (K) Immunoblotting analysis revealed that UPP1 knockdown downregulated the expression of EMT-related and cell cycle-related proteins in UM-UC-3 cells. UPP1 overexpression promoted the expression of these proteins in T24 cells. *: p < 0.05; **: p < 0.01; ***: p < 0.001; ns: not significant (p > 0.05).
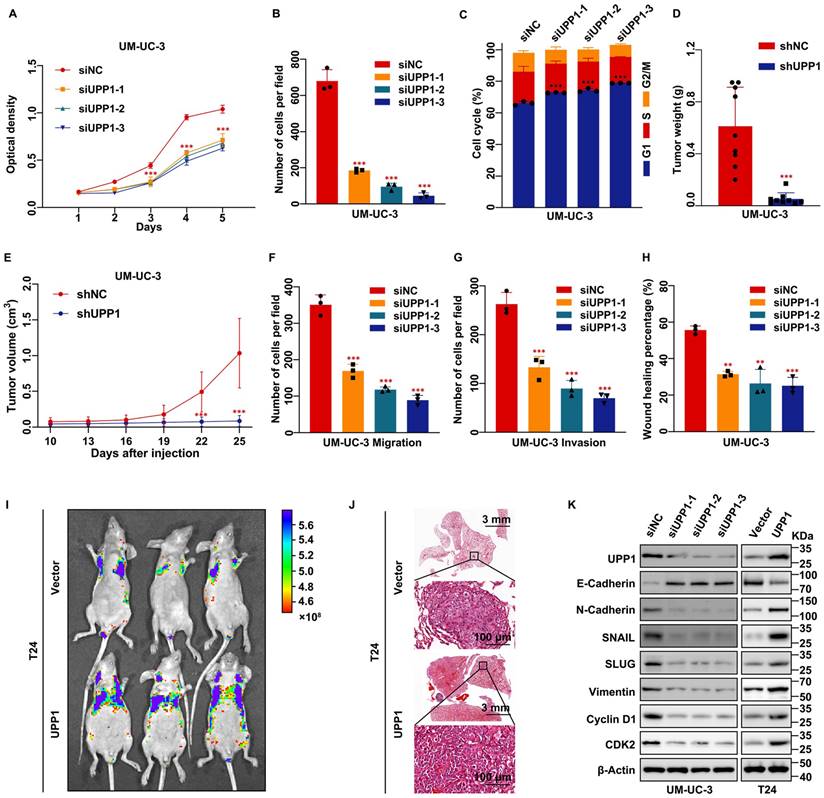
To further verify the function of UPP1 in cell proliferation in vivo, a stable UPP1-knockdown UM-UC-3 cell line and a stable UPP1-overexpressing T24 cell line were established using lentiviral transduction. UPP1 knockdown and overexpression efficiency was determined using qRT-PCR and immunoblotting (Supplementary Fig. S4A-D). shNC-transfected or shUPP1-transfected UM-UC-3 cells and Vector-transfected or UPP1-transfected T24 cells were injected into the subcutaneous tissue of BALB/c nude mice. The tumor size was regularly measured using a vernier caliper to determine tumor growth. The tumor was dissected at the specified time. The growth rate and weight of tumors derived from shUPP1-transfected UM-UC-3 cells were significantly lower than those derived from shNC-transfected UM-UC-3 cells (Fig. 2D-E and Supplementary Fig. S4E). Additionally, the tumors derived from UPP1-transfected T24 cells grew faster than those derived from Vector-transfected T24 cells (Supplementary Fig. S4F-H).
Transwell assay results showed that UPP1 knockdown significantly inhibited BLCA cell migration and invasion (Fig. 2F-G and Supplementary Fig. S5A-C). In contrast, UPP1 overexpression promoted the migration and invasion of BLCA cells (Supplementary Fig. S5D-F). The wound healing assay results were consistent with those of the transwell assay (Fig. 2H and Supplementary Fig. S5G-J). Next, an experimental tumor lung metastasis model was established by injecting nude mice aged six weeks with shNC-transfected or shUPP1-transfected UM-UC-3 cells and Vector-transfected or UPP1-transfected T24 cells via the tail vein. The GFP fluorescence intensity in mice injected with shUPP1-transfected UM-UC-3 cells was lower than that in mice injected with shNC-transfected UM-UC-3 cells (Supplementary Fig. S4I), and the GFP fluorescence intensity in mice injected with UPP1-transfected T24 cells was higher than that in mice injected with Vector-transfected T24 cells (Fig. 2I). H&E staining also supported these results (Fig. 2J and Supplementary Fig. S4J). Finally, immunoblotting revealed that UPP1 modulation altered the expression levels of biomarkers related to the cell cycle and epithelial-mesenchymal transition (EMT) (Fig. 2K and Supplementary Fig. S5K).
UPP1 knockdown suppresses tumorigenesis and promotes BLCA cell apoptosis and ROS generation by downregulating the AKT signaling pathway
Next, the regulatory effects of UPP1 on apoptosis in BLCA were examined. Flow cytometric analysis was used to determine the cellular ROS level. The cellular ROS levels were upregulated in UPP1 knockdown cells (Fig. 3A and Supplementary Fig. S6A-C) and downregulated in UPP1-overexpressing cells (Supplementary Fig. S6D-F) compared with those in control cells. Flow cytometric analysis revealed that the percentage of apoptotic cells in the UPP1 knockdown group was higher than that in the control group (Fig. 3B and Supplementary Fig. S6G-I).
UPP1 knockdown upregulates cellular ROS levels and promotes apoptosis in BLCA through the AKT signaling pathway in vitro and in vivo. (A) Flow cytometric analysis revealed that UPP1 knockdown upregulated ROS levels in UM-UC-3 cells. (B) Statistical chart of the apoptosis rates of UM-UC-3 cells evaluated using flow cytometry. (C) GSEA based on TCGA dataset. (D) Immunoblotting analysis revealed that UPP1 knockdown suppressed the phosphorylation of AKT at Ser473 and Thr308, downregulated anti-apoptotic proteins, and upregulated pro-apoptotic proteins in UM-UC-3 cells. UPP1 overexpression reversed the expression trend of these proteins in T24 cells. (E) H&E and IHC staining of subcutaneous Vector-transfected and UPP1-transfected T24 cell-derived xenograft tumors. (F) Immunoblotting indicates that UPP1 overexpression could promote AKT phosphorylation and inhibit apoptosis of BLCA cells in vivo. *: p < 0.05; **: p < 0.01; ***: p < 0.001; ns: not significant (p > 0.05).
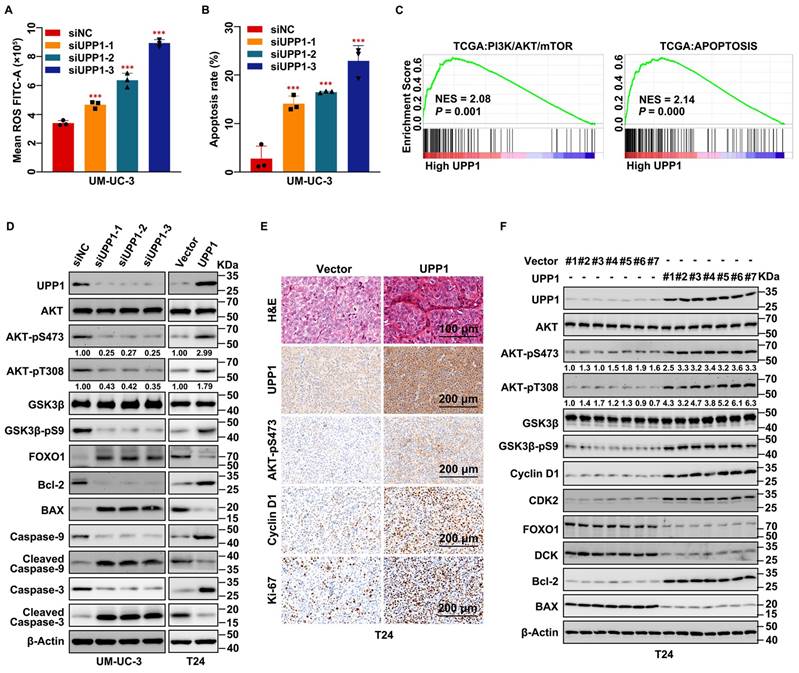
GSEA revealed that AKT, apoptosis, and EMT-related pathways were upregulated (Fig. 3C and Supplementary Fig. S7A). GSVA revealed that the expression of UPP1 was significantly related to PI3K/AKT/mTOR, apoptosis, ROS, and EMT-related signaling pathways (Supplementary Fig. S7B). Immunoblotting analysis demonstrated that UPP1 knockdown inhibited the phosphorylation of AKT and GSK3β, resulting in the downregulation of the pro-survival factor Bcl-2 [33] and the upregulation of FOXO1 and the pro-apoptotic factor BAX [34] (Fig. 3D and Supplementary Fig. S7C). UPP1 knockdown downregulated Caspase 9 and Caspase 3 levels but upregulated the Cleaved Caspase 9 and Cleaved Caspase 3 levels. The expression patterns of these proteins in UPP1-overexpressing cells contrasted with those in UPP1 knockdown cells (Fig. 3D and Supplementary Fig. S7C).
Next, H&E and IHC staining of dissected tumors indicated that the number of cells in the tumors derived from shUPP1-transfected UM-UC-3 cells was lower than that in the tumors derived from shNC-transfected UM-UC-3 cells (Supplementary Fig. S7D). Additionally, the proliferation-related biomarkers Cyclin D1, Ki-67, and AKT-pS473 were downregulated in the tumors derived from shUPP1-transfected UM-UC-3 cells (Supplementary Fig. S7D). In contrast, the number of cells in the tumor derived from UPP1-transfected T24 cells was higher than that in the tumor derived from Vector-transfected T24 cells (Fig. 3E), and the pro-proliferative biomarkers were upregulated in the tumor derived from UPP1-transfected T24 cells (Fig. 3E). Total protein was extracted from the subcutaneous tumors derived from UM-UC-3 cells (shNC-transfected and shUPP1-transfected) and T24 cells (Vector-transfected and UPP1-transfected). Immunoblotting revealed that the AKT signaling pathway was downregulated, and the expression of pro-apoptosis-related biomarkers was upregulated in the tumors derived from shUPP1-transfected cells (Supplementary Fig. S7E), which was consistent with the results of the in vitro experiments. In contrast, the AKT signaling pathway was upregulated and pro-apoptosis-related biomarkers were downregulated in UPP1-transfected T24 cells (Fig. 3F). These results suggest that UPP1 knockdown promotes apoptosis by downregulating the AKT signaling pathway.
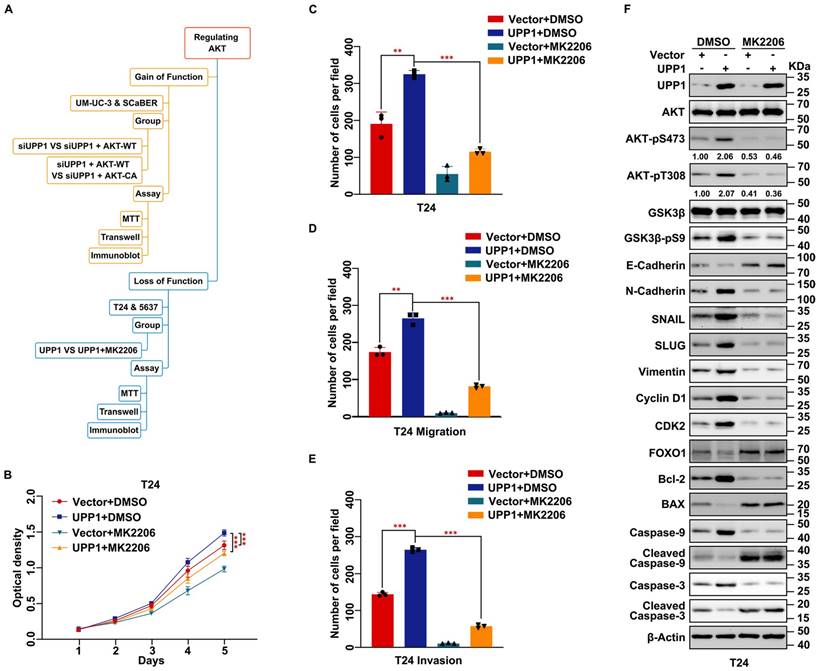
To further verify whether UPP1 exerts regulatory effects on the biological function of BLCA via the AKT signaling pathway, cells were treated with the AKT-specific inhibitor MK2206 or transfected with the AKT plasmid. A constitutively active plasmid AKT-CA was constructed by mutating Thr308 and Ser473 to Asp to simulate phosphorylated AKT [35, 36] (Fig. 4A). MTT assay results showed that MK2206 significantly decreased the viability of UPP1-overexpressing BLCA cells (Fig. 4B and Supplementary Fig. S8A). The results of the colony formation assay were consistent with those of the MTT assay (Fig. 4C and Supplementary Fig. S8B-C). Meanwhile, transwell assay results indicated that MK2206 treatment significantly inhibited the migration and invasion of UPP1-overexpressing BLCA cells (Fig. 4D-E and Supplementary Fig. S8D-E). Immunoblotting analysis demonstrated that the phosphorylation of AKT (Ser473 and Thr308) and the expression of downstream EMT-related biomarkers were downregulated. In contrast, the expression levels of pro-apoptotic biomarkers were upregulated (Fig. 4F and Supplementary Fig. S8F).
Inhibition of AKT rescues the stimulating effect of UPP1 overexpression in BLCA cells. (A) Frame diagram of rescue experiments. (B) MTT assay results revealed that treatment with MK2206 (10 μM) suppressed the UPP1-induced upregulation of T24 cell proliferation. (C) The colony formation assay results revealed that MK2206 (10 μM) mitigated the UPP1-induced upregulation of T24 cell proliferation. (D-E) The statistical chart of the transwell assay results indicates that MK2206 (10 μM) suppressed the UPP1-induced upregulation of migration and invasion in T24 cells. (F) Immunoblotting analysis revealed that UPP1-induced AKT activation was mitigated upon treatment with MK2206 (10 μM). *: p < 0.05; **: p < 0.01; ***: p < 0.001; ns: not significant (p > 0.05).
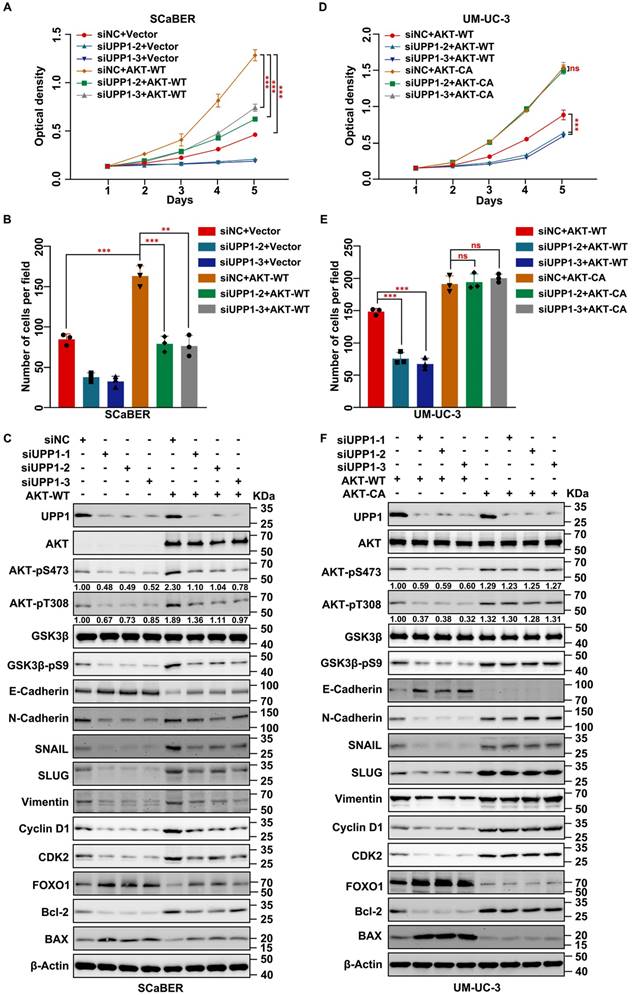
Next, AKT-WT was overexpressed in UPP1 knockdown cells. MTT assay results suggested that AKT-WT overexpression partially restored the impaired proliferation of UPP1 knockdown BLCA cells (Fig. 5A and Supplementary Fig. S9A). Consistently, the transwell assay results showed that AKT-WT overexpression partially restored the impaired migration of UPP1 knockdown BLCA cells (Fig. 5B and Supplementary Fig. S9B-C). Immunoblotting revealed that AKT-WT overexpression partially mitigated the UPP1 knockdown-induced downregulation of AKT phosphorylation and downstream cell cycle- and EMT-related biomarkers. In contrast, AKT-WT overexpression partially mitigated the UPP1 knockdown-mediated upregulation of pro-apoptosis-related biomarkers (Fig. 5C and Supplementary Fig. S10A). Additionally, BLCA proliferation (Fig. 5D and Supplementary Fig. S9D) and migration (Fig. 5E and Supplementary Fig. S9E-F) in AKT-CA-overexpressing UPP1 knockdown cells were fully rescued when compared with those of AKT-WT-overexpressing cells. Immunoblotting also confirmed these conclusions (Fig. 5F and Supplementary Fig. S10B). These findings indicate that UPP1 regulates the biological function of BLCA by activating the AKT signaling pathway.
AKT overexpression rescues the inhibitory effect of UPP1 knockdown in BLCA cells. (A) MTT assay results with UPP1 knockdown and AKT-WT-overexpressing SCaBER cells. (B) The results of the transwell assay with UPP1 knockdown and AKT-WT-overexpressing SCaBER cells. (C) Immunoblotting analysis of the effect of UPP1 knockdown and AKT-WT overexpression on the expression of related proteins in SCaBER cells. (D) The results of the MTT assay examine the effect of AKT-WT and AKT-CA overexpression in UPP1 knockdown UM-UC-3 cells. (E) The results of the transwell assay examining the effect of AKT-WT and AKT-CA overexpression in UPP1 knockdown UM-UC-3 cells. (F) Immunoblotting analysis of the expression of related proteins in UPP1 knockdown, AKT-WT-overexpressing, and AKT-CA-overexpressing UM-UC-3 cells. *: p < 0.05; **: p < 0.01; ***: p < 0.001; ns: not significant (p > 0.05).
UPP1 promotes AKT dual-site phosphorylation by interacting with the C-terminus of AKT
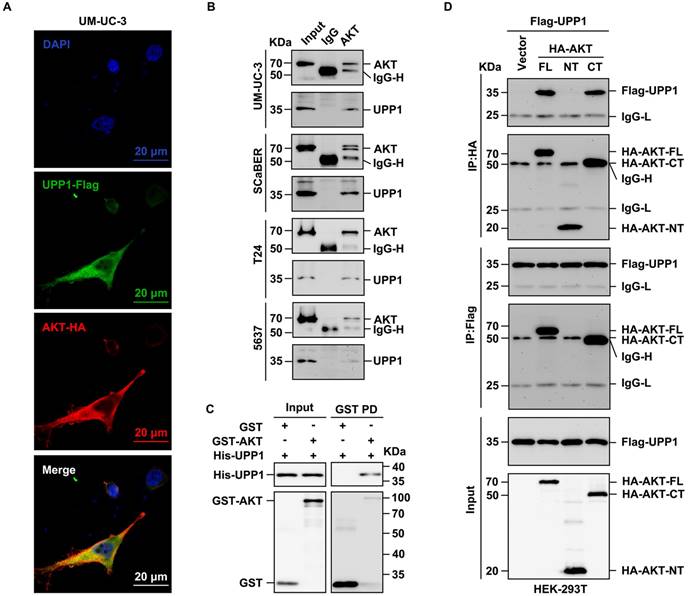
Next, the biochemical mechanism and specific interaction domains were identified using the co-IP assay (Supplementary Fig. S11A). The results of the exogenous co-IP assay demonstrated a definite interaction between UPP1 and AKT in HEK-293T cells (Supplementary Fig. S11B). Immunofluorescence analysis revealed that UPP1 co-localized with AKT in UM-UC-3 cell cytoplasm (Fig. 6A). Meanwhile, the results of the endogenous co-IP assay demonstrated that UPP1 interacted with AKT in multiple BLCA cell lines (Fig. 6B). GST pull-down analysis showed direct binding between recombinant UPP1 and recombinant AKT in vitro (Fig. 6C). Truncated AKT-NT and AKT-CT plasmids were constructed, and analysis of the interaction between UPP1 and truncated AKT demonstrated that UPP1 could interact with AKT-CT (Fig. 6D).
UPP1 interacts with the C-terminus of AKT. (A) Immunofluorescence analysis of the cytoplasmic co-localization of UPP1-Flag and AKT-HA in UM-UC-3 cells. (B) Endogenous co-IP analysis indicates that UPP1 interacted with AKT in UM-UC-3, SCaBER, T24, and 5637 cell lines. (C) GST pull-down assay results revealed that UPP1 interacted with AKT in vitro. (D) Exogenous co-IP analysis demonstrated that UPP1 interacted with the C-terminus of AKT in HEK-293T cells.
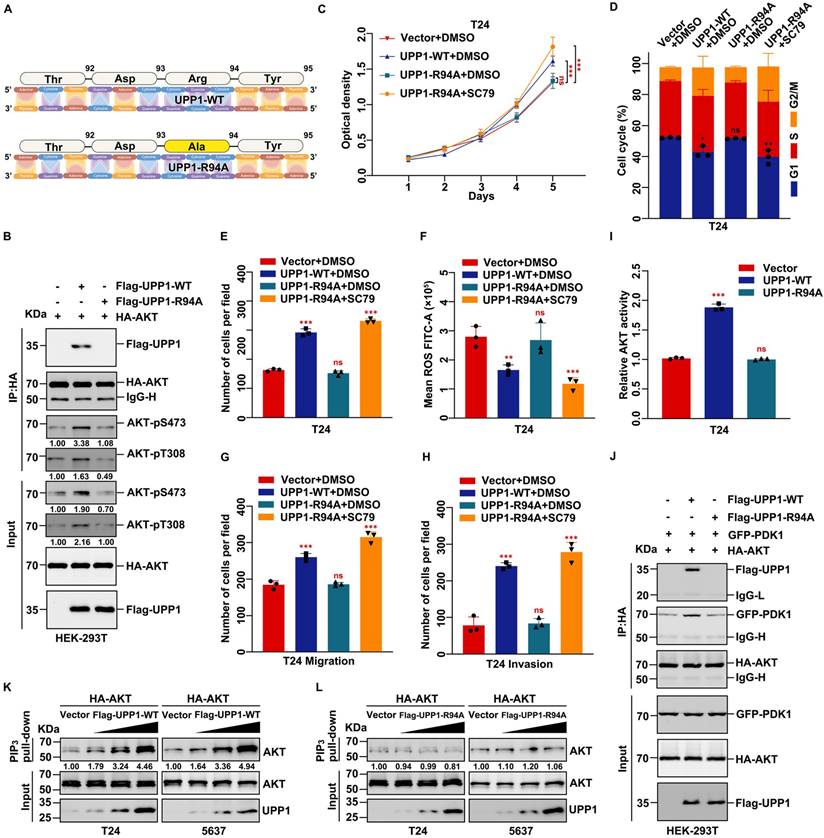
To further investigate the mechanism underlying the interaction between UPP1 and AKT, a mutant UPP1 overexpression plasmid was constructed. Previous studies have analyzed the molecular structure of UPP1 and reported that Arg94 is a critical residue that binds to phosphate. Alteration of Arg94 modulates the biological function of UPP1 [25, 37, 38]. Thus, Arg94 was mutated to Ala94 to construct the mutant plasmid UPP1-R94A (Fig. 7A). The effects of UPP1-R94A overexpression were compared with those of UPP1-WT. The interaction between AKT and mutant UPP1-R94A was analyzed by co-IP assay. UPP1-R94A did not interact with AKT-FL (Supplementary Fig. S11C). Next, quantitative exogenous co-IP analysis was performed to clarify the phosphorylation level of AKT. When equal amounts of AKT were immunoprecipitated, the phosphorylation levels of AKT in immunoprecipitated and input samples were upregulated upon UPP1-WT overexpression but did not markedly change upon UPP1-R94A overexpression. The AKT phosphorylation levels in UPP1-R94A-overexpressing cells were similar to those in the control group (Fig. 7B). These results suggest that Arg94 is an AKT-binding site and essential for the phosphorylation of AKT.
UPP1 promotes AKT activation through direct interaction. (A) Schematic for site mutation of UPP1. (B) Quantitative exogenous co-IP analysis indicates that UPP1-R94A overexpression did not promote AKT phosphorylation in HEK-293T cells. (C) The results of MTT assay with T24 cells overexpressing UPP1-WT or UPP1-R94A. SC79 (20 μM) promoted the proliferation of T24 cells. (D) UPP1-WT or UPP1-R94A overexpression did not promote cell cycle transition in T24 cells. SC79 (20 μM) promoted cell cycle transition in T24 cells. (E) The results of the colony formation assay with T24 cells overexpressing UPP1-WT or UPP1-R94A. SC79 (20 μM) increased the colony numbers of T24 cells. (F) ROS levels in cells overexpressing UPP1-WT or UPP1-R94A. SC79 (20 μM) significantly downregulated the intercellular ROS level. (G-H) The results of the transwell assay with T24 cells overexpressing UPP1-WT or UPP1-R94A. SC79 (20 μM) promoted the metastasis of T24 cells. (I) The relative AKT activity in T24 cells overexpressing UPP1-WT or UPP1-R94A. (J) UPP1-WT promoted the binding of AKT to PDK1 in HEK-293T cells. (K) UPP1-WT facilitated phosphatidylinositol 3,4,5-triphosphate (PIP3) recruitment to AKT. (L) UPP1-R94A did not promote PIP3 recruitment to AKT. *: p < 0.05; **: p < 0.01; ***: p < 0.001; ns: not significant (p > 0.05).
The effects of UPP1-R94A on biological functions were examined. MTT assay results demonstrated that the proliferation of UPP1-R94A-overexpressing cells was similar to that of the control group (Fig. 7C and Supplementary Fig. S11D). Treatment with SC79, an AKT-specific activator, promoted cell proliferation (Fig. 7C and Supplementary Fig. S11D). UPP1-R94A overexpression did not promote cell cycle transition (Fig. 7D and Supplementary Figs. S11E and S12A-B). Treatment with SC79 promoted the UPP1-R94A-overexpressing cell cycle transition process (Fig. 7D and Supplementary Figs. S11E and S12A-B). Furthermore, the colony formation assay results indicated that UPP1-R94A overexpression did not increase the colony number or size (Fig. 7E and Supplementary Fig. S11F-G). UPP1-R94A overexpression did not downregulate the cellular ROS level. Treatment with SC79 downregulated the ROS levels of UPP1-R94A-overexpressing cells (Fig. 7F and Supplementary Fig. S11H-J). The results of the transwell assay showed that UPP1-R94A overexpression did not promote BLCA cell migration and invasion. However, SC79 treatment strengthened the invasion and migration of UPP1-R94A-overexpressing cells (Fig. 7G-H and Supplementary Fig. S11K-M).
Immunoblotting analysis revealed that UPP1-R94A did not activate the AKT signaling pathway. In contrast, SC79 activated the AKT signaling pathway in UPP1-R94A-overexpressing cells (Supplementary Fig. S13A). To rule out the interference of endogenous UPP1 with the experimental results, UPP1 was knocked down, and UPP1-WT or UPP1-R94A was overexpressed. The immunoblotting results were consistent with the previous results (Supplementary Fig. S13B). These findings show that UPP1 promotes BLCA cell proliferation, migration, and invasion and inhibits ROS generation and apoptosis in BLCA by activating the AKT signaling pathway by interacting with the C-terminus. In contrast, UPP1-R94A did not exert these functions.
UPP1, a phosphorylase, has no structural basis to support serine/threonine kinase activity against AKT. Thus, the mechanism by which UPP1 mediates the phosphorylation of AKT and the role of the UPP1-AKT interaction were examined. In particular, the effect of artificial modulation of UPP1 expression in BLCA cells on the expression of PI3K, PTEN, PDK1, and PDK2, which are critical proteins that regulate AKT phosphorylation, was examined. Immunoblotting analysis revealed that UPP1 downregulation or overexpression did not affect the protein levels of PI3K, phosphorylated PI3K, PTEN, PDK1, and PDK2 (Supplementary Fig. S14A). The activity of AKT was quantified using the AKT kinase activity kit. UPP1 knockdown inhibited the activity of AKT (Supplementary Fig. S14B-C). UPP1 overexpression upregulated AKT activity, but UPP1-R94A overexpression did not promote the phosphorylation of AKT (Fig. 7I and Supplementary Fig. S14D).
Next, PDK1, PDK2, and PTEN overexpression vectors were constructed, and a series of co-IP assays were performed to explore the relationship between UPP1 and these proteins. Exogenous co-IP analysis revealed that AKT interacted with PDK1 and PDK2 in HEK-293T cells (Supplementary Fig. S14E-F). Moreover, UPP1 could not interact with PTEN (Supplementary Fig. S14G). Meanwhile, UPP1 and UPP1-R94A interacted with PDK1 and PDK2 (Supplementary Fig. S15A-B). The results of the quantitative exogenous co-IP experiments demonstrated that UPP1, but not UPP1-R94A, facilitates AKT binding to PDK1 and PDK2 (Fig. 7J and Supplementary Fig. S15C). These results suggest that UPP1 promotes AKT activation by facilitating the binding of AKT to PDK1 and PDK2, which depends on the interaction between UPP1 and AKT.
As the activation of AKT is associated with its binding to PIP3, a PIP3 pull-down assay was performed to elucidate the potential mechanisms. UPP1 overexpression, but not UPP1-R94A overexpression, increased the interaction between AKT and PIP3 (Fig. 7K-L). These results suggest that UPP1 promotes the phosphorylation of AKT by facilitating PIP3 recruitment to AKT, which depends on the interaction between UPP1 and AKT.
Furthermore, SC79 was demonstrated to activate AKT and rescue the malignant phenotype of UPP1-R94A-overexpressing BLCA cells. SC79 activates AKT in the cytoplasm and inhibits AKT membrane translocation [39-41]. Therefore, an exogenous co-IP assay was implemented to investigate the effect of SC79 on the binding between UPP1-R94A and AKT. UPP1-R94A did not interact with AKT in the presence of SC79 (Supplementary Fig. S15D). These results suggest that UPP1-R94A is not involved in the SC79-mediated activation of AKT.
Thus, this study demonstrates that UPP1 interacts with the C-terminus of AKT to promote the BLCA malignant phenotype. UPP1 activates the AKT signaling pathway by promoting the binding of AKT to PDK1 and PDK2 and facilitating the recruitment of PIP3 to AKT, which depends on the binding of UPP1 to AKT.
UPP1 promotes gemcitabine resistance in BLCA through the AKT/FOXO1/DCK signaling pathway
Gemcitabine is a pyrimidine analog. Intravesical gemcitabine is a standard, effective, and safe therapy for NMIBC and MIBC [42]. The beneficial effects of gemcitabine in patients during postoperative recurrence and progression-free survival were higher than those of mitomycin [43]. Downregulation of the AKT signaling pathway can increase gemcitabine sensitivity in BLCA [44, 45]. Therefore, based on our previous findings, experiments were performed to explore the clinical value of increasing gemcitabine chemosensitivity. UPP1 knockdown in multiple BLCA cells significantly decreased the half-maximal inhibitory concentration of gemcitabine, and opposite results were found in UPP1 overexpression cells (Supplementary Fig. S16A-D). MTT assay results indicated that UPP1 knockdown increased gemcitabine chemosensitivity in SCaBER (300 nM) and UM-UC-3 (400 nM) cells (Fig. 8A and Supplementary Fig. S16E). In contrast, UPP1 overexpression promoted drug tolerance in T24 (200 nM) and 5637 (400 nM) cells (Supplementary Fig. S16F-G). Gemcitabine significantly increased the apoptotic rate in UPP1 knockdown cells (Fig. 8B, and Supplementary Figs. S16H and S17A-B). Immunoblotting analysis revealed that Cleaved Caspase 3, an apoptosis marker, was upregulated in UPP1 knockdown cells. UPP1 knockdown upregulated the expression of deoxycytidine kinase (DCK), a critical enzyme that can phosphorylate gemcitabine to exert pharmacological effects in the nucleus. Consistent with previous results, UPP1 overexpression suppressed the expression levels of Cleaved Caspase 3 and DCK (Fig. 8C and Supplementary Fig. S16I).
UPP1 knockdown promotes gemcitabine chemosensitivity through the AKT/FOXO1/DCK signaling pathway. (A) MTT assay results revealed that UPP1 knockdown promoted gemcitabine chemosensitivity in SCaBER cells. (B) UPP1 knockdown significantly increased the apoptosis rate in SCaBER cells. (C) Immunoblotting analysis revealed that gemcitabine significantly downregulated AKT phosphorylation and upregulated pro-apoptotic protein expression in UPP1 knockdown SCaBER cells. UPP1 overexpression suppressed the gemcitabine-induced inhibition of AKT phosphorylation and downregulated pro-apoptotic protein expression in gemcitabine-treated 5637 cells. The effect of gemcitabine on the volume (D) and viability (E) of shUPP1-transfected and shNC-transfected UM-UC-3 cell-derived xenograft tumors. (F) Analysis of the protein levels in xenograft tumors of different groups. (G) Schematic showing the mechanism by which UPP1 regulates biological status via the AKT signaling pathway. *: p < 0.05; **: p < 0.01; ***: p < 0.001; ns: not significant (p > 0.05).
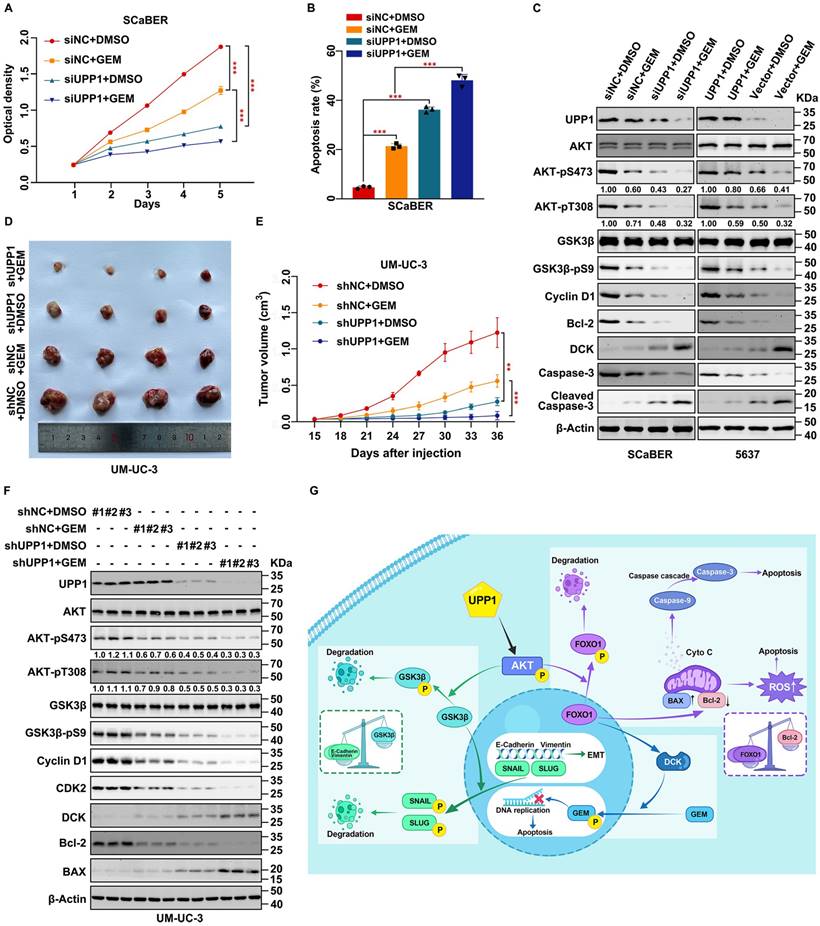
To further explore the function of UPP1 in gemcitabine tolerance in vivo, a tumor formation assay was performed by injecting UM-UC-3 cells (shNC-transfected and shUPP1-transfected) and T24 cells (Vector-transfected and UPP1-transfected) into nude mouse subcutaneous tissue. After allowing the tumors to grow for 15 days, the mice were intraperitoneally administered gemcitabine (50 mg/kg bodyweight) or DMSO twice a week. The tumor weight in the gemcitabine-treated UPP1 knockdown group was significantly lower than that in the group treated with gemcitabine (Fig. 8D and Supplementary Fig. S18A). Cell viability in the gemcitabine-treated UPP1 knockdown group was significantly weaker than that in the group treated with gemcitabine (Fig. 8E). H&E staining revealed that the cell density in the tumors of the gemcitabine-treated UPP1 knockdown group was lower than that in the tumors of the other three groups (Supplementary Fig. S18B). IHC analysis demonstrated that AKT-pS473, Cyclin D1, and Ki-67 were downregulated (Supplementary Fig. S18B). Immunoblotting of xenograft tumors indicated that gemcitabine inhibited the phosphorylation of AKT (Fig. 8F). In contrast, the tumor weight and cell viability in the gemcitabine-treated UPP1-overexpressing group were significantly higher than those in the group treated with gemcitabine (Supplementary Fig. S18C-E). H&E staining revealed that the cell density in the tumors of the gemcitabine-treated UPP1-overexpressing group was higher than that in the tumors of the other three groups (Supplementary Fig. S18G). IHC analysis demonstrated that AKT-pS473, Cyclin D1, and Ki-67 were downregulated (Supplementary Fig. S18G). Immunoblotting of xenograft tumors indicated that gemcitabine inhibited the phosphorylation of AKT (Supplementary Fig. S18F). The combination of gemcitabine treatment and UPP1 overexpression markedly activated the AKT signaling pathway and promoted BLCA cell gemcitabine resistance.
Next, the specific downstream mechanisms by which UPP1 regulates DCK expression were examined. A previous study by our team confirmed a positive correlation between DCK and FOXO1 expression [46]. UPP1 knockdown promoted the expression of DCK, whereas UPP1 overexpression downregulated the expression of DCK (Supplementary Fig. S19A). Treatment with the AKT inhibitor MK2206 mitigated the inhibitory effects of UPP1 overexpression on DCK (Supplementary Fig. S19B). AKT-WT overexpression partially inhibited the UPP1 knockdown-induced upregulation of DCK (Supplementary Fig. S19C). Meanwhile, AKT-CA overexpression completely inhibited the protein level of DCK (Supplementary Fig. S19D). Additionally, UPP1-R94A overexpression did not suppress the expression of DCK (Supplementary Fig. S19E). Furthermore, UPP1-R94A overexpression suppressed the expression of DCK in UPP1 knockdown cells (Supplementary Fig. S19F). These findings indicate that UPP1 promotes gemcitabine resistance in BLCA through the AKT/FOXO1/DCK signaling pathway.
In summary, our study indicates that UPP1 activates the AKT signaling pathway by facilitating AKT binding to PDK1 and PDK2 and promoting the interaction between PIP3 and AKT in BLCA cells, which depends on the binding of UPP1 to the AKT C-terminus. UPP1 promotes BLCA cell proliferation via the AKT/GSK3β/Cyclin D1 signaling pathway, facilitates BLCA cell metastasis through the AKT/GSK3β/SNAIL signaling pathway, inhibits BLCA cell apoptosis and ROS generation by the AKT/FOXO1/Bcl-2 signaling pathway, and improves BLCA cell gemcitabine resistance via the AKT/FOXO1/DCK signaling pathway (Fig. 8G).
Discussion
UPP1, which is involved in pyrimidine metabolism, regulates uridine homeostasis and promotes pyrimidine salvage [47]. Previous studies have reported that UPP1 is involved in the pathogenesis of colon cancer [48], glioma [26], breast cancer [49], thyroid cancer [50], oral squamous cell carcinoma [51], pancreatic cancer [52], and lung adenocarcinoma [53]. The oncogenic functions of UPP1 are suggested to mediate tumorigenesis. UPP1 overexpression is associated with poor prognosis and cancer progression [54]. Cao et al. detected tumors in multiple organs of a Upp1-/- murine model and reported that Upp1 deficiency promotes DNA damage and sequentially activates the ATM/CHK2/p53 signaling pathway [55]. Wang et al. reported that UPP1 deficiency inhibited glycolysis in lung adenocarcinoma progression by suppressing the expression of ENO1 and LDHA [53]. A recent study demonstrated that pancreatic ductal adenocarcinoma utilizes uridine as a crucial compensatory fuel to meet metabolic needs under nutrient-deficient conditions and that this is mainly mediated by UPP1 [56]. In addition, small molecule inhibitors of UPP1 have been reported in clinical trials. 5-FU, a widely used chemotherapy drug for treating various types of cancer globally [57], has limited clinical application due to dose-dependent cytotoxicity [58]. It has been reported that UPP1 deficiency leads to the accumulation of uridine, which can reduce 5-FU toxicity in normal tissues [59], and BAU is a UPP1-specific inhibitor that protects normal tissues from 5-FU toxicity [60-62]. Zhao et al. found that the glutaminase 1 (GLS1) inhibitor CB-839 could effectively inhibit colorectal cancer with PIK3CA mutations [63]. In addition, CB-839 upregulated the expression of UPP1 in various transplantation tumor models, strengthening the inhibitory effect of 5-FU on PIK3CA-mutant colorectal cancer [63]. da Silva EFG et al. demonstrated for the first time the ability of CPBMF65 to inhibit the proliferation of HepG2 cells by blocking the cell cycle and promoting cellular senescence [64]. Based on its in vitro antitumor activity and low toxicity in normal cells, CPBMF65 may be a candidate for future in vivo therapeutic studies in hepatocellular carcinoma.
However, previous studies examining the role of UPP1 in tumorigenesis have mainly focused on metabolism and DNA damage. Limited studies have reported the role of UPP1 in BLCA. As the p53-encoding gene is extensively mutated in BLCA [65], we hypothesized the presence of a distinct mechanism through which UPP1 promotes tumorigenesis in BLCA. This study reported that BLCA expression was upregulated and positively correlated with tumor malignancy. Kaplan-Meier survival curves revealed that UPP1 represented a poor prognosis in patients with BLCA and might be a potential biomarker.
In this study, UPP1 promoted BLCA cell proliferation, metastasis, and cell cycle transition and exerted protective effects against ROS stress-induced apoptosis through the AKT signaling pathway. The primary mechanism through which AKT regulates biological functions involves the phosphorylation of various target kinases, enzymes, and transcription factors. Patients with BLCA exhibiting hyperactivated AKT are associated with enhanced proliferative and metastatic characteristics, increasing their risk of death [66]. The PH domain of AKT binds to PIP3, promoting the membrane translocation of AKT [67]. Furthermore, AKT can be activated through a classical dual phosphorylation mechanism. AKT is phosphorylated at Thr308 by PDK1 after translocation to the cell membrane [68]. PDK2 then phosphorylates AKT at Ser473, resulting in complete AKT activation [69] in association with the mTOR-Rictor complex mTORC2 [70]. Moreover, PTEN inhibits AKT activity by dephosphorylating PIP3 [71]. However, it is unclear if this accounts for the full activation or overactivation of AKT and if the dysregulation of downstream functions is associated with excessive AKT activation. Additionally, AKT can be phosphorylated at Ser477 and Thr479 by the cyclin-dependent kinase 2 (CDK2)/cyclin A2 complex through direct interactions with the C-terminus of AKT, which could facilitate or partially compensate for Thr308 and Ser473 phosphorylation [72].
A series of co-IP experiments investigated the relationship between UPP1 and AKT. UPP1 facilitated the malignant phenotype of BLCA by interacting with the C-terminus of AKT, whereas mutant UPP1-R94A could not interact with AKT. Furthermore, UPP1 upregulated the phosphorylation of AKT by promoting the binding of AKT to PDK1 and PDK2 and facilitating the recruitment of PIP3 to AKT, which was dependent on the binding of UPP1 to AKT.
GSK3β is a substrate of AKT. AKT can phosphorylate GSK3β at Ser9, inhibiting its activity. GSK3β phosphorylates various substrates and mediates multiple biological functions. Most substrates are inhibited and degraded upon phosphorylation [73]. SNAIL (SNAIL-1) and SLUG (SNAIL-2), which are essential substrates of GSK3β [74, 75], belong to the SNAIL family and are critical transcription factors for EMT [76]. Additionally, SNAIL and SLUG facilitate transcriptional regulation of proteins related to EMT, such as E-Cadherin, N-Cadherin, and Vimentin, promoting the transformation of epithelial cells into mesenchymal cells [77]. In this study, UPP1 upregulated the SLUG, SNAIL, Vimentin, and N-Cadherin levels and suppressed the E-Cadherin levels. Additionally, some studies have reported the co-localization and interaction between UPP1 and Vimentin in NIH/3T3 and C26 cell lines [78], although the function of this interaction has not been reported. This finding may be consistent with that of this study, which reported that UPP1 promoted EMT through the AKT pathway. Thus, UPP1 promotes BLCA metastasis through the AKT/GSK3β/SNAIL signaling pathway. Furthermore, GSK3β phosphorylates Cyclin D1, a critical cell cycle-related protein, resulting in the rapid ubiquitination and degradation of Cyclin D1 [79]. Our study indicated that UPP1 facilitated the expression of Cyclin D1, indicating that UPP1 activates the AKT/GSK3β/Cyclin D1 signaling pathway and promotes cell cycle transition.
FOXO1, a member of the forkhead family of transcription factors, is an essential catalytic substrate of AKT. AKT-mediated phosphorylation inhibits the function of FOXO1, resulting in the translocation of FOXO1 from the nucleus to the cytoplasm [80]. FOXO1 regulates cellular metabolism, the oxidative stress response, and biological activities, such as cell cycle arrest, autophagy, and apoptosis [81, 82]. The anti-apoptotic protein Bcl-2, a critical substrate of FOXO1, regulates apoptosis by modulating mitochondrial permeability. Bcl-2 is localized to the outer mitochondrial membrane and inhibits the release of cytochrome C [83]. The pro-apoptotic protein BAX, an essential member of the Bcl-2 family, is localized to the cytoplasm, undergoes translocation into the mitochondria upon death signal transduction, and promotes cytochrome C release [84]. Cell survival requires active apoptosis inhibition, achieved by inhibiting pro-apoptotic factor expression and promoting anti-apoptotic factor expression. The transduction of cell survival signals is dependent on AKT. Activated AKT can maintain mitochondrial integrity by inhibiting FOXO1 and subsequently promoting Bcl-2 expression and inhibiting BAX expression [85], suppressing the release of cytochrome C and the activation of the downstream caspase cascade [86]. UPP1 knockdown downregulated AKT phosphorylation, Bcl-2, Caspase 9, and Caspase 3 and upregulated BAX, FOXO1, Cleaved Caspase 9, and Cleaved Caspase 3. The effects of AKT overexpression were in contrast to those of UPP1 knockdown.
UPP1 can increase cell viability and inhibit apoptosis. These results indicate that UPP1 can regulate mitochondrial apoptosis through the AKT/FOXO1/Bcl-2/Caspase pathway. Cancer cells are exposed to metabolic stress owing to rapid growth and nutrient depletion in the tumor microenvironment. Metabolic stress can cause ROS-induced apoptosis and lead to cell death. However, cancer cells can adapt to metabolic stress by altering their metabolic pathways. AKT is a major effector involved in the metabolic stress response [87]. Several studies have reported that Bcl-2 is essential for ROS adaptation in different cell types [88, 89]. UPP1 knockdown significantly upregulated ROS levels and downregulated AKT phosphorylation and Bcl-2 expression. In contrast, UPP1 overexpression significantly downregulated ROS levels and upregulated AKT phosphorylation and Bcl-2 expression. The UPP1-R94A mutant did not exert these effects. These results suggest that UPP1 can also regulate apoptosis through the AKT/FOXO1/Bcl-2/ROS pathway with some synergy with mitochondrial apoptosis. Thus, UPP1 inhibits apoptosis in BLCA cells by phosphorylating AKT to inhibit FOXO1 and upregulating Bcl-2 levels to inhibit downstream caspase and ROS levels.
Furthermore, a high recurrence rate significantly contributes to high mortality rates in patients with BLCA. Intravesical therapy is essential for treating and preventing BLCA. Gemcitabine, a nucleotide analog, is the mainstream intravesical chemotherapy drug [90]. The therapeutic effects of gemcitabine, which is activated via phosphorylation, on BLCA involve the inhibition of DNA replication. The critical enzyme mediating the phosphorylation of gemcitabine is DCK [91]. Gemcitabine inhibits the phosphorylation of AKT [92]. Previous studies by our team reported that DCK can interact with FOXO1 and that DCK is positively correlated with FOXO1 [46]. In this study, UPP1 knockdown enhanced the chemosensitivity of BLCA to gemcitabine and upregulated FOXO1 and DCK. AKT overexpression mitigated the UPP1 knockdown-induced increase in gemcitabine sensitivity by restoring the expression of DCK and FOXO1. These results suggest that UPP1 deficiency promotes gemcitabine sensitivity through the AKT/FOXO1/DCK pathway.
However, this study has some limitations. This study experimentally verified that UPP1 overexpression promoted the phosphorylation of AKT at dual sites and identified a crucial AKT-binding site (Arg94) in UPP1 at the C-terminus. However, the specific binding site in the C-terminus of AKT for UPP1 was not examined in detail. Furthermore, the human AKT protein has three isoforms (AKT1, AKT2, and AKT3). Each isoform has a distinct subcellular localization with a specific biological function. This study did not examine the specific AKT isoform regulated by UPP1. In addition, we have provided a limited picture of UPP1 protein expression in bladder cancer by tissue microarray, and larger sample sizes are still needed to detect the generalization of UPP1 expression in bladder cancer. Tissue microarrays provide minimal epidemiological information, which makes it challenging to learn whether bladder cancer patients with specific exposure characteristics are strongly associated with UPP1 expression. Last, the expression level of UPP1 in bladder cancer cell lines was inconsistent with the malignancy of bladder cancer reported previously [93]. We believe this may be related to the following reasons: first, we only detected the expression of UPP1 at the mRNA and protein levels in six bladder cancer cell lines, which is a small sample size; second, different expression patterns are widespread in various bladder cancer cell lines. For example, many oncogenes whose expression levels in bladder cancer cell lines do not correspond to the malignancy of the cell lines [94, 95]. More efforts are needed to explore the biological function of UPP1 in more BLCA cell lines. These limitations will be addressed in future studies.
In conclusion, UPP1, an essential oncogene, promotes tumorigenesis and development via the AKT signaling pathway.
Abbreviations
AOD: average optical density; BCA: bicinchoninic acid; BLCA: bladder cancer; CDK2: cyclin-dependent kinase 2; co-IP: co-immunoprecipitation; DAB: diaminobenzidine; DCK: deoxycytidine kinase; FBS: fetal bovine serum; GEPIA: Gene Expression Profiling Interactive Analysis; GFP: green fluorescent protein; GLS1: glutaminase 1; GSEA: gene set enrichment analysis; GSVA: gene set variation analysis; H&E: Hematoxylin and eosin; HIS: hue-saturation-intensity; IHC: immunohistochemistry; IOD: integral optical density; MIBC: muscle-invasive bladder cancer; MTT: methyl thiazolyl tetrazolium; NMIBC: non-muscle-invasive bladder cancer; OS: overall survival; PBS: phosphate-buffered saline; PH: protein homology; PTEN: phosphatase and tensin homolog; PIP3: phosphatidylinositol 3,4,5-triphosphate; PIP2: phosphatidylinositol 4,5-bisphosphate; PI3K: phosphoinositide 3-kinase; qRT-PCR: quantitative reverse transcription PCR; ROC: receiver operating characteristic; ROS: reactive oxygen species; RT: room temperature; siRNAs: short-interfering RNAs; SDS: sodium dodecyl sulfate; TCGA: The Cancer Genome Atlas; UPP1: uridine phosphorylase 1; WT: wild-type.
Supplementary Material
Supplementary figures and tables.
Acknowledgements
We sincerely thank Ms. Mengxue Yu, Ms. Yayun Fang, and Ms. Danni Shan for their technical assistance. Thanks to Dr. Yuruo Chen for exceptional assistance in editing the diagram. This study was supported by the National Natural Science Foundation of China (82372654). The funders played no role in the study design, data collection and analysis, decision to publish, or preparation of the manuscript.
Data availability statement
The original datasets and materials used and/or analyzed in this study are available from the corresponding author upon reasonable request.
Ethical approval
For animal study: This study was approved by the Experimental Animal Welfare and Ethics, Zhongnan Hospital of Wuhan University (approval No. ZN2022030). For human study: not applicable.
Author contributions
Y.X., X.W., and L.J. conceptualized, developed and coordinated the study. W.D., S.T., and W.Z. performed the experiments. W.D. and W.Z. collected the original dataset. W.Z. prepared the first draft. Y.Z., W.L., K.Q., G.W., Y.X., X.W., and L.J. analyzed the data and revised the manuscript and figures. K.X., F.Z., and W.X. assisted with the animal experiments. N.L. and J.Y. performed bioinformatic analysis. R.Z. and M.L. assisted in additional experiments.
Competing Interests
The authors have declared that no competing interest exists.
References
1. Jubber I, Ong S, Bukavina L, Black PC, Compérat E, Kamat AM. et al. Epidemiology of Bladder Cancer in 2023: A Systematic Review of Risk Factors. Eur Urol. 2023;84:176-90
2. Ren L, Jiang M, Xue D, Wang H, Lu Z, Ding L. et al. Nitroxoline suppresses metastasis in bladder cancer via EGR1/circNDRG1/miR-520h/smad7/EMT signaling pathway. Int J Biol Sci. 2022;18:5207-20
3. Lenis AT, Lec PM, Chamie K, Mshs MD. Bladder Cancer: A Review. JAMA. 2020;324:1980-91
4. Zhang N, Hua X, Tu H, Li J, Zhang Z, Max C. Isorhapontigenin (ISO) inhibits EMT through FOXO3A/METTL14/VIMENTIN pathway in bladder cancer cells. Cancer Lett. 2021;520:400-8
5. Patel VG, Oh WK, Galsky MD. Treatment of muscle-invasive and advanced bladder cancer in 2020. CA Cancer J Clin. 2020;70:404-23
6. Jiang N, Liao Y, Wang M, Wang Y, Wang K, Guo J. et al. BUB1 drives the occurrence and development of bladder cancer by mediating the STAT3 signaling pathway. J Exp Clin Cancer Res. 2021;40:378
7. Barani M, Hosseinikhah SM, Rahdar A, Farhoudi L, Arshad R, Cucchiarini M. et al. Nanotechnology in Bladder Cancer: Diagnosis and Treatment. Cancers (Basel). 2021;13:2214
8. Funt SA, Lattanzi M, Whiting K, Al-Ahmadie H, Quinlan C, Teo MY. et al. Neoadjuvant Atezolizumab With Gemcitabine and Cisplatin in Patients With Muscle-Invasive Bladder Cancer: A Multicenter, Single-Arm, Phase II Trial. J Clin Oncol. 2022;40:1312-22
9. Zhang XG, Zhang T, Li CY, Zhang MH, Chen FM. CD164 promotes tumor progression and predicts the poor prognosis of bladder cancer. Cancer Med. 2018;7:3763-72
10. Knowles MA, Hurst CD. Molecular biology of bladder cancer: new insights into pathogenesis and clinical diversity. Nature reviews Cancer. 2015;15:25-41
11. Witjes JA, Bruins HM, Cathomas R, Comperat EM, Cowan NC, Gakis G. et al. European Association of Urology Guidelines on Muscle-invasive and Metastatic Bladder Cancer: Summary of the 2020 Guidelines. Eur Urol. 2021;79:82-104
12. Shariati M, Meric-Bernstam F. Targeting AKT for cancer therapy. Expert Opin Investig Drugs. 2019;28:977-88
13. Song M, Bode AM, Dong Z, Lee MH. AKT as a Therapeutic Target for Cancer. Cancer Res. 2019;79:1019-31
14. Massari F, Ciccarese C, Santoni M, Iacovelli R, Mazzucchelli R, Piva F. et al. Metabolic phenotype of bladder cancer. Cancer Treat Rev. 2016;45:46-57
15. Revathidevi S, Munirajan AK. Akt in cancer: Mediator and more. Semin Cancer Biol. 2019;59:80-91
16. Kearney AL, Norris DM, Ghomlaghi M, Kin Lok Wong M, Humphrey SJ, Carroll L. et al. Akt phosphorylates insulin receptor substrate to limit PI3K-mediated PIP3 synthesis. Elife. 2021 10
17. Liu A, Zhu Y, Chen W, Merlino G, Yu Y. PTEN Dual Lipid- and Protein-Phosphatase Function in Tumor Progression. Cancers (Basel). 2022 14
18. Chu N, Viennet T, Bae H, Salguero A, Boeszoermenyi A, Arthanari H. et al. The structural determinants of PH domain-mediated regulation of Akt revealed by segmental labeling. Elife. 2020 9
19. Jacinto E, Facchinetti V, Liu D, Soto N, Wei S, Jung SY. et al. SIN1/MIP1 maintains rictor-mTOR complex integrity and regulates Akt phosphorylation and substrate specificity. Cell. 2006;127:125-37
20. Abdel-Wahab AF, Mahmoud W, Al-Harizy RM. Targeting glucose metabolism to suppress cancer progression: prospective of anti-glycolytic cancer therapy. Pharmacol Res. 2019;150:104511
21. Alzahrani AS. PI3K/Akt/mTOR inhibitors in cancer: At the bench and bedside. Semin Cancer Biol. 2019;59:125-32
22. Martínez-Reyes I, Chandel NS. Cancer metabolism: looking forward. Nat Rev Cancer. 2021;21:669-80
23. Stine ZE, Schug ZT, Salvino JM, Dang CV. Targeting cancer metabolism in the era of precision oncology. Nat Rev Drug Discov. 2022;21:141-62
24. Yang C, Li J, Huang Z, Zhang X, Gao X, Zhu C. et al. Structural and catalytic analysis of two diverse uridine phosphorylases in Phytophthora capsici. Sci Rep. 2020;10:9051
25. Roosild TP, Castronovo S, Villoso A, Ziemba A, Pizzorno G. A novel structural mechanism for redox regulation of uridine phosphorylase 2 activity. J Struct Biol. 2011;176:229-37
26. Wang J, Xu S, Lv W, Shi F, Mei S, Shan A. et al. Uridine phosphorylase 1 is a novel immune-related target and predicts worse survival in brain glioma. Cancer Med. 2020;9:5940-7
27. Sun C, Li T, Song X, Huang L, Zang Q, Xu J. et al. Spatially resolved metabolomics to discover tumor-associated metabolic alterations. Proc Natl Acad Sci U S A. 2019;116:52-7
28. Sachs MC. plotROC: A Tool for Plotting ROC Curves. J Stat Softw. 2017 79
29. Subramanian A, Tamayo P, Mootha VK, Mukherjee S, Ebert BL, Gillette MA. et al. Gene set enrichment analysis: a knowledge-based approach for interpreting genome-wide expression profiles. Proc Natl Acad Sci U S A. 2005;102:15545-50
30. Tang Z, Li C, Kang B, Gao G, Li C, Zhang Z. GEPIA: a web server for cancer and normal gene expression profiling and interactive analyses. Nucleic Acids Res. 2017;45:W98-W102
31. Walker RA. Quantification of immunohistochemistry-issues concerning methods, utility and semiquantitative assessment I. Histopathology. 2006;49:406-10
32. Taylor CR, Levenson RM. Quantification of immunohistochemistry-issues concerning methods, utility and semiquantitative assessment II. Histopathology. 2006;49:411-24
33. Shimizu S, Eguchi Y, Kosaka H, Kamiike W, Matsuda H, Tsujimoto Y. Prevention of hypoxia-induced cell death by Bcl-2 and Bcl-xL. Nature. 1995;374:811-3
34. Mignard V, Lalier L, Paris F, Vallette FM. Bioactive lipids and the control of Bax pro-apoptotic activity. Cell Death Dis. 2014;5:e1266
35. Alessi DR, Andjelkovic M, Caudwell B, Cron P, Morrice N, Cohen P. et al. Mechanism of activation of protein kinase B by insulin and IGF-1. Embo j. 1996;15:6541-51
36. Goren I, Müller E, Pfeilschifter J, Frank S. Thr308 determines Akt1 nuclear localization in insulin-stimulated keratinocytes. Biochem Biophys Res Commun. 2008;372:103-7
37. Roosild TP, Castronovo S, Fabbiani M, Pizzorno G. Implications of the structure of human uridine phosphorylase 1 on the development of novel inhibitors for improving the therapeutic window of fluoropyrimidine chemotherapy. BMC Struct Biol. 2009;9:14
38. Roosild TP, Castronovo S. Active site conformational dynamics in human uridine phosphorylase 1. PLoS One. 2010;5:e12741
39. Jo H, Mondal S, Tan D, Nagata E, Takizawa S, Sharma AK. et al. Small molecule-induced cytosolic activation of protein kinase Akt rescues ischemia-elicited neuronal death. Proc Natl Acad Sci U S A. 2012;109:10581-6
40. So EY, Ouchi T. BRAT1 deficiency causes increased glucose metabolism and mitochondrial malfunction. BMC Cancer. 2014;14:548
41. Liu X, Kiss GK, Mellender SJ, Weiss HR, Chi OZ. Activation of Akt by SC79 decreased cerebral infarct in early cerebral ischemia-reperfusion despite increased BBB disruption. Neurosci Lett. 2018;681:78-82
42. Schlack K, Boegemann M, Steinestel J, Schrader AJ, Krabbe LM. The safety and efficacy of gemcitabine for the treatment of bladder cancer. Expert Rev Anticancer Ther. 2016;16:255-71
43. Han MA, Maisch P, Jung JH, Hwang JE, Narayan V, Cleves A. et al. Intravesical gemcitabine for non-muscle invasive bladder cancer. Cochrane Database Syst Rev. 2021;6:CD009294
44. Jeon HG, Yoon CY, Yu JH, Park MJ, Lee JE, Jeong SJ. et al. Induction of caspase mediated apoptosis and down-regulation of nuclear factor-kappaB and Akt signaling are involved in the synergistic antitumor effect of gemcitabine and the histone deacetylase inhibitor trichostatin A in human bladder cancer cells. J Urol. 2011;186:2084-93
45. Mey V, Giovannetti E, De Braud F, Nannizzi S, Curigliano G, Verweij F. et al. In vitro synergistic cytotoxicity of gemcitabine and pemetrexed and pharmacogenetic evaluation of response to gemcitabine in bladder cancer patients. Br J Cancer. 2006;95:289-97
46. Xiong Y, Ju L, Yuan L, Chen L, Wang G, Xu H. et al. KNSTRN promotes tumorigenesis and gemcitabine resistance by activating AKT in bladder cancer. Oncogene. 2021;40:1595-608
47. Bhasin N, Alleyne D, Gray OA, Kupfer SS. Vitamin D Regulation of the Uridine Phosphorylase 1 Gene and Uridine-Induced DNA Damage in Colon in African Americans and European Americans. Gastroenterology. 2018;155:1192-204.e9
48. Weng W, Liu N, Toiyama Y, Kusunoki M, Nagasaka T, Fujiwara T. et al. Novel evidence for a PIWI-interacting RNA (piRNA) as an oncogenic mediator of disease progression, and a potential prognostic biomarker in colorectal cancer. Mol Cancer. 2018;17:16
49. Kanzaki A, Takebayashi Y, Bando H, Eliason JF, Watanabe Si S, Miyashita H. et al. Expression of uridine and thymidine phosphorylase genes in human breast carcinoma. Int J Cancer. 2002;97:631-5
50. Guan Y, Bhandari A, Zhang X, Wang O. Uridine phosphorylase 1 associates to biological and clinical significance in thyroid carcinoma cell lines. J Cell Mol Med. 2019;23:7438-48
51. Miyashita H, Takebayashi Y, Eliason JF, Fujimori F, Nitta Y, Sato A. et al. Uridine phosphorylase is a potential prognostic factor in patients with oral squamous cell carcinoma. Cancer. 2002;94:2959-66
52. Sahin F, Qiu W, Wilentz RE, Iacobuzio-Donahue CA, Grosmark A, Su GH. RPL38, FOSL1, and UPP1 are predominantly expressed in the pancreatic ductal epithelium. Pancreas. 2005;30:158-67
53. Wang X, Wang Z, Huang R, Lu Z, Chen X, Huang D. UPP1 Promotes Lung Adenocarcinoma Progression through Epigenetic Regulation of Glycolysis. Aging Dis. 2022;13:1488-503
54. Weng JY, Salazar N. DNA Methylation Analysis Identifies Patterns in Progressive Glioma Grades to Predict Patient Survival. Int J Mol Sci. 2021 22
55. Cao Z, Ma J, Chen X, Zhou B, Cai C, Huang D. et al. Uridine homeostatic disorder leads to DNA damage and tumorigenesis. Cancer Letters. 2016;372:219-25
56. Nwosu ZC, Ward MH, Sajjakulnukit P, Poudel P, Ragulan C, Kasperek S. et al. Uridine-derived ribose fuels glucose-restricted pancreatic cancer. Nature. 2023;618:151-8
57. Grem JL. 5-Fluorouracil: forty-plus and still ticking. A review of its preclinical and clinical development. Invest New Drugs. 2000;18:299-313
58. Wei Y, Yang P, Cao S, Zhao L. The combination of curcumin and 5-fluorouracil in cancer therapy. Arch Pharm Res. 2018;41:1-13
59. Cao D, Russell RL, Zhang D, Leffert JJ, Pizzorno G. Uridine phosphorylase (-/-) murine embryonic stem cells clarify the key role of this enzyme in the regulation of the pyrimidine salvage pathway and in the activation of fluoropyrimidines. Cancer Res. 2002;62:2313-7
60. Darnowski JW, Handschumacher RE. Enhancement of fluorouracil therapy by the manipulation of tissue uridine pools. Pharmacol Ther. 1989;41:381-92
61. Darnowski JW, Handschumacher RE, Wiegand RA, Goulette FA, Calabresi P. Tissue-specific expansion of uridine pools in mice. Effects of benzylacyclouridine, dipyridamole and exogenous uridine. Biochem Pharmacol. 1991;41:2031-6
62. van Groeningen CJ, Peters GJ, Leyva A, Laurensse E, Pinedo HM. Reversal of 5-fluorouracil-induced myelosuppression by prolonged administration of high-dose uridine. J Natl Cancer Inst. 1989;81:157-62
63. Zhao Y, Feng X, Chen Y, Selfridge JE, Gorityala S, Du Z. et al. 5-Fluorouracil Enhances the Antitumor Activity of the Glutaminase Inhibitor CB-839 against PIK3CA-Mutant Colorectal Cancers. Cancer Res. 2020;80:4815-27
64. da Silva EFG, Lima KG, Krause GC, Haute GV, Pedrazza L, Catarina AV. et al. CPBMF65, a synthetic human uridine phosphorylase-1 inhibitor, reduces HepG2 cell proliferation through cell cycle arrest and senescence. Invest New Drugs. 2020;38:1653-63
65. Cooper MJ, Haluschak JJ, Johnson D, Schwartz S, Morrison LJ, Lippa M. et al. p53 mutations in bladder carcinoma cell lines. Oncol Res. 1994;6:569-79
66. Houédé N, Pourquier P. Targeting the genetic alterations of the PI3K-AKT-mTOR pathway: its potential use in the treatment of bladder cancers. Pharmacol Ther. 2015;145:1-18
67. Liu P, Cheng H, Roberts TM, Zhao JJ. Targeting the phosphoinositide 3-kinase pathway in cancer. Nat Rev Drug Discov. 2009;8:627-44
68. Hers I, Vincent EE, Tavaré JM. Akt signalling in health and disease. Cell Signal. 2011;23:1515-27
69. Osaki M, Oshimura M, Ito H. PI3K-Akt pathway: its functions and alterations in human cancer. Apoptosis. 2004;9:667-76
70. Bhaskar PT, Hay N. The two TORCs and Akt. Dev Cell. 2007;12:487-502
71. Christine A, Park MK, Song SJ, Song MS. The equilibrium of tumor suppression: DUBs as active regulators of PTEN. Exp Mol Med. 2022
72. Liu P, Begley M, Michowski W, Inuzuka H, Ginzberg M, Gao D. et al. Cell-cycle-regulated activation of Akt kinase by phosphorylation at its carboxyl terminus. Nature. 2014;508:541-5
73. Kaidanovich-Beilin O, Woodgett JR. GSK-3: Functional Insights from Cell Biology and Animal Models. Front Mol Neurosci. 2011;4:40
74. Pai JT, Chen XH, Leu YL, Weng MS. Propolin G-Suppressed Epithelial-to-Mesenchymal Transition in Triple-Negative Breast Cancer Cells via Glycogen Synthase Kinase 3β-Mediated Snail and HDAC6-Regulated Vimentin Degradation. Int J Mol Sci. 2022 23
75. Kim JY, Kim YM, Yang CH, Cho SK, Lee JW, Cho M. Functional regulation of Slug/Snail2 is dependent on GSK-3β-mediated phosphorylation. Febs j. 2012;279:2929-39
76. Nieto MA. The snail superfamily of zinc-finger transcription factors. Nat Rev Mol Cell Biol. 2002;3:155-66
77. Lu W, Kang Y. Epithelial-Mesenchymal Plasticity in Cancer Progression and Metastasis. Dev Cell. 2019;49:361-74
78. Russell RL, Cao D, Zhang D, Handschumacher RE, Pizzorno G. Uridine phosphorylase association with vimentin. Intracellular distribution and localization. J Biol Chem. 2001;276:13302-7
79. Simoneschi D. Uncovering the degrader of D-type cyclins. Science. 2022;378:845
80. Manning BD, Toker A. AKT/PKB Signaling: Navigating the Network. Cell. 2017;169:381-405
81. Webb AE, Brunet A. FOXO transcription factors: key regulators of cellular quality control. Trends Biochem Sci. 2014;39:159-69
82. Salih DA, Brunet A. FoxO transcription factors in the maintenance of cellular homeostasis during aging. Curr Opin Cell Biol. 2008;20:126-36
83. Murphy KM, Ranganathan V, Farnsworth ML, Kavallaris M, Lock RB. Bcl-2 inhibits Bax translocation from cytosol to mitochondria during drug-induced apoptosis of human tumor cells. Cell Death Differ. 2000;7:102-11
84. Murphy KM, Streips UN, Lock RB. Bax membrane insertion during Fas(CD95)-induced apoptosis precedes cytochrome c release and is inhibited by Bcl-2. Oncogene. 1999;18:5991-9
85. Manning BD, Cantley LC. AKT/PKB signaling: navigating downstream. Cell. 2007;129:1261-74
86. Degterev A, Yuan J. Expansion and evolution of cell death programmes. Nat Rev Mol Cell Biol. 2008;9:378-90
87. Zhao Y, Hu X, Liu Y, Dong S, Wen Z, He W. et al. ROS signaling under metabolic stress: cross-talk between AMPK and AKT pathway. Mol Cancer. 2017;16:79
88. Liang J, Cao R, Wang X, Zhang Y, Wang P, Gao H. et al. Mitochondrial PKM2 regulates oxidative stress-induced apoptosis by stabilizing Bcl2. Cell Res. 2017;27:329-51
89. Hildeman DA, Mitchell T, Aronow B, Wojciechowski S, Kappler J, Marrack P. Control of Bcl-2 expression by reactive oxygen species. Proc Natl Acad Sci U S A. 2003;100:15035-40
90. Meng X, Xiao W, Sun J, Li W, Yuan H, Yu T. et al. CircPTK2/PABPC1/SETDB1 axis promotes EMT-mediated tumor metastasis and gemcitabine resistance in bladder cancer. Cancer Lett. 2022: 216023.
91. Yamamoto M, Sanomachi T, Suzuki S, Uchida H, Yonezawa H, Higa N. et al. Roles for hENT1 and dCK in gemcitabine sensitivity and malignancy of meningioma. Neuro Oncol. 2021;23:945-54
92. Yang Y, Zhang LJ, Bai XG, Xu HJ, Jin ZL, Ding M. Synergistic antitumour effects of triptolide plus gemcitabine in bladder cancer. Biomed Pharmacother. 2018;106:1307-16
93. Zuiverloon TCM, de Jong FC, Costello JC, Theodorescu D. Systematic Review: Characteristics and Preclinical Uses of Bladder Cancer Cell Lines. Bladder Cancer. 2018;4:169-83
94. Zeng S, Liu A, Dai L, Yu X, Zhang Z, Xiong Q. et al. Prognostic value of TOP2A in bladder urothelial carcinoma and potential molecular mechanisms. BMC Cancer. 2019;19:604
95. Shen H, Blijlevens M, Yang N, Frangou C, Wilson KE, Xu B. et al. Sox4 Expression Confers Bladder Cancer Stem Cell Properties and Predicts for Poor Patient Outcome. Int J Biol Sci. 2015;11:1363-75
Author contact
![]() Corresponding authors: Dr. Yu Xiao, email: yu.xiaoedu.cn; or Dr. Xinghuan Wang, email: wangxinghuanedu.cn; or Dr. Lingao Ju, email: julingao1990edu.cn.
Corresponding authors: Dr. Yu Xiao, email: yu.xiaoedu.cn; or Dr. Xinghuan Wang, email: wangxinghuanedu.cn; or Dr. Lingao Ju, email: julingao1990edu.cn.