Impact Factor ISSN: 1449-2288

 Global reach, higher impact
Int J Biol Sci 2024; 20(8):2790-2813. doi:10.7150/ijbs.93943 This issue Cite
Research Paper
Coenzyme Q0 inhibited the NLRP3 inflammasome, metastasis/EMT, and Warburg effect by suppressing hypoxia-induced HIF-1α expression in HNSCC cells
Hsin-Ling Yang1,#, Che-Wei Chang1, Chithravel Vadivalagan2,#, Sudhir Pandey3, Siang-Jyun Chen1, Chuan-Chen Lee4, Jhih-Hsuan Hseu5, ![]() , You-Cheng Hseu3,4,6,7,
, You-Cheng Hseu3,4,6,7, ![]()
1. Institute of Nutrition, College of Health Care, China Medical University, Taichung 406040, Taiwan.
2. Department of Surgery, University of Michigan Medical Center, Ann Arbor, Michigan 48109, United States.
3. Department of Cosmeceutics, College of Pharmacy, China Medical University, Taichung 406040, Taiwan.
4. Department of Health and Nutrition Biotechnology, Asia University, Taichung 413305, Taiwan.
5. Department of Dermatology, Chang Gung Memorial Hospital, Kaohsiung 83301, Taiwan.
6. Chinese Medicine Research Center, China Medical University, Taichung 404333, Taiwan.
7. Research Center of Chinese Herbal Medicine, China Medical University, Taichung 404333, Taiwan.
#Equal contribution.
Received 2024-1-5; Accepted 2024-5-1; Published 2024-5-5
Abstract

Coenzyme Q0 (CoQ0), a quinone derivative from Antrodia camphorata, has antitumor capabilities. This study investigated the antitumor effect of noncytotoxic CoQ0, which included NLRP3 inflammasome inhibition, anti-EMT/metastasis, and metabolic reprogramming via HIF-1α inhibition, in HNSCC cells under normoxia and hypoxia. CoQ0 suppressed hypoxia-induced ROS-mediated HIF-1α expression in OECM-1 and SAS cells. Under normoxia and hypoxia, the inflammatory NLRP3, ASC/caspase-1, NFκB, and IL-1β expression was reduced by CoQ0. CoQ0 reduced migration/invasion by enhancing epithelial marker E-cadherin and suppressing mesenchymal markers Twist, N-cadherin, Snail, and MMP-9, and MMP-2 expression. CoQ0 inhibited glucose uptake, lactate accumulation, GLUT1 levels, and HIF-1α-target gene (HK-2, PFK-1, and LDH-A) expressions that are involved in aerobic glycolysis. Notably, CoQ0 reduced ECAR as well as glycolysis, glycolytic capability, and glycolytic reserve and enhanced OCR, basal respiration, ATP generation, maximal respiration, and spare capacity in OECM-1 cells. Metabolomic analysis using LC-ESI-MS showed that CoQ0 treatment decreased the levels of glycolytic intermediates, including lactate, 2/3-phosphoglycerate, fructose 1,6-bisphosphate, and phosphoenolpyruvate, and increased the levels of TCA cycle metabolites, including citrate, isocitrate, and succinate. HIF-1α silencing reversed CoQ0-mediated anti-metastasis (N-Cadherin, Snail, and MMP-9) and metabolic reprogramming (GLUT1, HK-2, and PKM-2) under hypoxia. CoQ0 prevents cancer stem-like characteristics (upregulated CD24 expression and downregulated CD44, ALDH1, and OCT4) under normoxia and/or hypoxia. Further, in IL-6-treated SG cells, CoQ0 attenuated fibrosis by inhibiting TGF-β and Collagen I expression and suppressed EMT by downregulating Slug and upregulating E-cadherin expression. Interesting, CoQ0 inhibited the growth of OECM-1 tumors in xenografted mice. Our results advocate CoQ0 for the therapeutic application against HNSCC.
Keywords: CoQ0, HIF-1α, NLRP3, EMT, Warburg effect
Introduction
Over 800,000 people worldwide have head and neck squamous cell carcinoma (HNSCC). Papillomavirus infection and tobacco and alcohol consumption are the primary etiological agents that are associated with the pathogenesis of HNSCC [1]. The transcriptional response is epigenetically regulated by low oxygen levels under hypoxic conditions, leading to a poor prognosis in cancer. Interestingly, HIF-1α-regulated genes are expressed under both normoxic and hypoxic conditions; therefore, they could be targeted to ameliorate solid cancers [2]. HNSCC cells exposed to hypoxia are much more resistant to radiotherapy than their normoxic counterparts [3]. Therefore, developing molecular therapies that target cancer hypoxia is an amenable treatment approach for HNSCC patients.
Higher NOD-like receptor (NLR) family pyrin domain-containing 3 (NLRP3) inflammasome levels in cancer cells are linked with increased HIF-1α expression [4]. Expression of Nuclear factor κB (NFκB), Interleukin 1β (IL-1β), and caspase-1 is necessary for NLRP3 inflammasome activation [5]. Tumor etiology involves dysregulated activation of the NLRP3 inflammasome, although its significance in the initiation and development of cancers is still controversial given the contradictory results thus far. A few studies have suggested that blocking the NLRP3 inflammasome/IL-1β pathway may be a potential strategy for treating HNSCC by ameliorating the tumor microenvironment [6].
Increased expression of HIF-1α in HNSCC cells controls the expression of genes related to epithelial-mesenchymal transition (EMT). The EMT in cancer cells is a dynamic biological process that is involved in migration/invasion and metastasis. EMT has been related to the metastasis potential of tumors and gives cancer cells the capacity to migrate to other body parts by increasing their invasive ability. Extracellular matrix components, cytoskeletal proteins, transcription factors, and cell-surface proteins are a few of the protein types that affect EMT [7]. The clinical significance of EMT prediction in HNSCC cells has been highlighted, indicating its value in treating head and neck cancer. An integrative EMT signature analysis was used to establish an EMT prediction model that is unique to HNSCC [8].
HIF-1α is a key factor that is responsible for regulating the energy supply in tumor cells under both normoxic and hypoxic conditions [9]. Tumor cells require enhanced ATP delivery, protein synthesis, lipid synthesis, and DNA duplication for increasing prevalence, and these effects are achieved through the Warburg effect, which encourages aerobic glycolysis over tricarboxylic acid cycle (TCA) cycle oxidative phosphorylation. The Warburg effect describes how cancer cells absorb glucose and produce more lactic acid than normal cells when there is plenty of oxygen present. This highlights the metabolic alterations that cancer cells acquire in order to produce more ATP and metabolic intermediates, which power the synthesis of biological macromolecules and aid in cell survival, development, and multiplication. An acidic microenvironment is created by pyruvate, an end product of glycolysis that preferentially accumulates in cancer cells and is transformed to lactic acid by lactate dehydrogenase, which promotes the growth and invasion of cancer cells [10, 11]. In HNSCC, there is an adverse correlation between high lactic acid levels and overall patient survival [12]. The aerobic glycolysis is notably enhanced, which is associated with tumor evolution and reduced susceptibility to chemotherapy in HNSCC. Solid cancers, including HNSCC, undergo metabolic reprogramming to support enhanced growth requirements.
The indigenous Taiwanese medicinal mushroom Antrodia camphorata is used as traditional medicine in the treatment of numerous illnesses, such as a number of malignancies, common skin ailments, indigestion, liver dysfunction, hypertension, and enteric diseases [13]. Numerous characteristics, including antioxidant, anti-angiogenesis, anti-inflammation, and anti-tumorigenesis, were attributed to the submerged fermented broths (mycelium and fruiting body) of Antrodia camphorata [13]. In our prior work, we identified that fermented broths of Antrodia camphorata prepared from submerged cultures contained high concentrations of Coenzyme Q0 (CoQ0, 17.3%) detected by a high-performance liquid chromatography (HPLC) analysis [14]. CoQ0 (ubiquinone 0; 2,3 dimethoxy-5-methyl-1,4 benzoquinone) is a ubiquinone chemical that is redox-sensitive as well as a constituent of the mitochondrial respiratory chain [15, 16]. In our previous investigation, results revealed the anti-inflammatory and antiangiogenic properties of CoQ0 both in vivo and in vitro [17].
Coenzyme Q0 (CoQ0), which is a quinone derivative from Antrodia camphorata, has therapeutic effects against various cancer cells, such as A549, HepG2, SW480, B16F10, MDA-MB-231, and SKOV-3 cells [18-20]. Our previous research demonstrated that CoQ0 prevents EMT/metastasis, apoptosis, and/or autophagy in glioblastoma cells, TWIST1-overexpressing HNSCC cells, triple-negative breast cancer cells, and ovarian carcinoma cells [20-22]. This investigation studied the molecular mechanisms and therapeutic effects of Antrodia camphorata-derived CoQ0 on the NLRP3 inflammasome, EMT/metastasis, and Warburg effect (metabolic reprogramming) in HNSCC (OECM-1 and SAS) cells.
Materials and Methods
Reagents and antibodies
GIBCO (BRL/Invitrogen, Carlsbad, USA) supplied the antibiotics (penicillin/streptomycin/neomycin) and DMEM. CoQ0 (2,3-dimethoxy-5-methyl-1,4-benzoquinone, purity > 99%) was obtained from Sigma-Aldrich (St. Louis, MO, USA). Antibodies against the following targets were obtained: IL-1β (ab9722) (Biorbyt, and Abcam, Cambridge, UK), NFκB (GTX 107678), (GeneTex, Irvine, USA), NLRP3 (#15101), Vimentin (#5741), HIF-1α (#79233), N-cadherin (#13116), Apoptosis-associated speck-like protein (ASC) (#13833), Snail (#3879), Matrix metalloproteinase-2 (MMP-2) (#4022), Matrix metalloproteinase-9 (MMP-9) (#3852), Octamer-binding transcription factor 4 (OCT4) (#4286), Aldehyde dehydrogenase 1 (ALDH1) (#12035), CD44 (#3570), Slug (#9585), pyruvate kinase M-2 (PKM-2) (#4053), and Twist (#69366) (Cell Signaling Technology, Danvers, USA) Caspase-1 (sc-56036), Glucose transporter 1 (GLUT1) (sc-377228), Hexokinase 2 (HK-2) (sc-374091), Lactate dehydrogenase A (LDH-A) (sc-137246), Phosphofructokinase 1 (PFK-1) (sc-293072), TGF-β (sc-130348), CD24 (sc-19585), E-cadherin (sc-8426), glyceraldehyde-3-phosphate dehydrogenase (GAPDH) (sc-47724) and β-actin (sc-47778) (Santa Cruz Biotechnology, Heidelberg, Germany). 3-[4,5-dimethylthiazol-2-yl]-2,5 diphenyl tetrazolium bromide (MTT) (Sigma-Aldrich, St. Louis, MO, USA), Diamidino-2-phenylindole dihydrochloride (DAPI, Calbiochem-La Jolla, USA), 2-deoxy-2-[(7-nitro-2,1,3-benzoxadiazol-4-yl) amino]-D-glucose (2-NBDG), and the L-lactate assay kit (Cayman Chemical Company, MI, USA) were used, and the extracellular acidification rate (ECAR) and oxygen consumption rate (OCR) were examined through a Seahorse XF assay (Agilent Technologies, USA). Cobalt chloride (CoCl2) and other reagents were obtained from Sigma-Aldrich (St. Louis, MO, USA).
Preparation of the fermented culture broths of Antrodia camphorata
Antrodia camphorata was collected from Nantou County, Taiwan. All AC specimens used were saved in the CMU repository and named “CMU-AC010”. Dr. Shy-Yuan Hwang from 'The Endemic Species Research Institute' in Nantou, Taiwan, characterized the fermented broths prepared from Antrodia camphorata [14]. The original colonies acquired above were plated on agar potato dextrose media at 30°C and incubated for 15-20 days to establish the seed cultures of Antrodia camphorata. Next, the whole colony was added into a 50-mL of sterile water flask and homogenized, following which the mycelial suspension was used as an inoculum for subsequent culture broth preparation. The initiating culture was then generated in a 20-liter fermenter (BioTop) that was whirled at 150 rpm and maintained at 30°C with a 0.2 vvm aeration rate. A 250-liter agitated fermenter (BioTop) was inoculated with 15 L of mycelium inoculum from a 5-day culture, and the mixture was then incubated for 331 h with an aeration rate of 0.075 vvm. The mycelia and deep-red fermented culture broths were separated by passing them through a 20-mesh sieve. After being centrifuged for 10 min at 3000 g, the culture soup was filtered through a 0.2 µm pore-size filter. Three to four separate sets of the fermented Antrodia camphorata cultures were utilized for experimental purposes. Then, the obtained filtrate was concentrated and lyophilized into a powder. A dry matter yield of 9.72 g/L was obtained from the culture broths. The aqueous solution was prepared by dissolving the powder samples at 25°C in 10 mM sodium phosphate buffer (pH 7.4) containing 0.15 M sodium chloride. For further investigation, the stock solutions were prepared and kept at -20°C.
CoQ0 isolation from the fermented broths of Antrodia camphorata by HPLC analysis
The fermented broths of Antrodia camphorata from the submerged cultures were subjected to HPLC characterization using a 4.6 x 250 mm RP-18 column (COSMOSIL, 5C18-AR-II, Waters) at a flow rate of 1.0 mL/min and detection at UV 254 and 220 nm. A standard solution for HPLC analysis was prepared by dissolving the Antrodia camphorata fermented culture broths in water (5.0 mg/mL) and filtering it through a 0.22 µm membrane filter. A gradient elution of 5-60% was obtained with the mobile phase consisting of (A) 0.05% trifluoroacetic acid (TFA) and (B) acetonitrile applied for 5-40 min. 20 µL aliquots were injected with a flow rate of 1.0 mL/min. The key constituents of the fermented broths of Antrodia camphorata were analyzed using chromatography and spectrum analysis. C5D5N was used as the measuring solvent for NMR 1D and 2D spectra on an NMR spectrometer (Bruker, Unity Plus 400 MHz) using a Shimadzu LC program for all analyses. The system incorporated an autosampler (SIL-20), a PDA detector (SPD-M20A), a pump (LC-20AT), and a column oven (CTO-20A). A mass Esquire HCT (Bruker), an Agilent 1100 series, and a column (Agilent, Zorbax Eclipse, SB-C18, 2.1 x 150 mm, 5 µm) were used for the LC-MS analyses. Multiple chromatographic peaks were obtained, indicating the presence of a diverse range of chemicals in the fermented broths of Antrodia camphorata. A yield of 17.3% (at 254 nm) and 13.5% (at 220 nm), respectively, was obtained for CoQ0 in the fermented culture broths of Antrodia camphorata [14].
Cell culture
HNSCC OECM-1, SAS, Cal-27, HSC-3, and FaDu cells and human salivary gingival epithelial SG cells were obtained from the American Type Culture Collection (VA, USA). OECM-1 cells were cultured in RPMI-1640, FaDu and Cal-27 cells were cultured in DMEM, and SAS and HSC-3 cells were cultured in DMEM/F12, and heat-inactivated fetal bovine serum (FBS, 10%) was supplemented into these media, along with penicillin-streptomycin-neomycin (1%), and glutamine (2 mM). The cells were maintained in a 5% CO2 and 37 °C humidified incubator under normoxia or hypoxia (1% O2). Interleukin 6 (IL-6)-treated SG cells were grown in DMEM supplemented with heat-inactivated FBS (1%), 1% penicillin-streptomycin-neomycin (1%), and glutamine (2 mM), and they were maintained in a humidified incubator with 5% CO2 at 37 °C.
MTT assay
Cell viability was spectrophotometrically measured using MTT assays as described earlier with minor modifications [23]. 4 × 10⁴ cells/well (20-40 passages) were cultivated in 24-well plates and treated with the indicated concentration of CoQ0 for 24, 48, or 72 h. The MTT reagent (400 μL 0.5 mg/mL MTT in PBS) was added to each well and incubated for 2 h at 37 °C, following which the formed MTT formazan crystals were solubilized using an equal volume of DMSO (400 μL). Finally, an ELISA microplate reader (Bio-Tek Instruments Inc., Winooski, USA) was employed to read the absorbance (A) at 570 nm. The assay was executed in triplicate at each concentration. The cell viability was expressed as the proportion of viable cells relative to vehicle-treated cells (A570 of treated cells/A570 of untreated cells) × 100.
Colony formation assay
To examine the colony formation ability of OECM-1 and SAS cells, a colony formation assay using previously established procedures was performed [22]. In brief, OECM-1 and SAS cells (3 × 10⁴ cells/well of a 6-well plate) were exposed to CoQ0 at concentrations of 0-7.5 μM for 24 h. All the assays were performed in triplicate, and the colony formation ability was expressed as a percentage relative to the number of colonies that were formed in the absence of CoQ0 (as 100%). A bright field microscope (100X) was used to visualize the colonies and acquire the images.
Immunoblotting assay
Cells were seeded at a density of 1 × 10⁶ cells/10-cm dish (20-40 passages), and the next day, they were treated with CoQ0 (0-7.5 μM) for 24 h. After treatment, the cells were rinsed with ice-cold phosphate buffer saline (PBS), and nuclear, cytoplasmic, and total proteins were extracted according to the manufacturer's recommendations (Pierce Biotechnology, Rockford, IL, USA). The specified proteins were analyzed using established immunoblotting procedures, as previously described [22]. Bovine serum albumin was used as the standard to estimate the protein content of each sample using the Bio-Rad protein assay reagent. Equal portions of denatured protein samples (50-100 µg) were electrophoresed on an 8-15% SDS-PAGE gel and then transferred overnight to a polyvinylidene difluoride (PVDF) membrane. 5% nonfat dry milk powder in Tris-buffered saline (0.1% Tween 20, TBST) was used to block the non-specific binding of proteins on the membrane for 30 minutes at room temperature. Following incubation at 4°C with primary antibodies overnight, the membranes were exposed to an HRP-conjugated goat anti-mouse or anti-rabbit secondary antibody for 2 h. The protein bands were detected using the enhanced chemiluminescence substrate (Bio-Rad, Hercules, CA, USA). The protein spot intensities were analyzed using commercially accessible software (AlphaEase, Genetic Technology Inc., Miami, FL, USA). Later, the PVDF membrane was de-probed of prior primary antibodies using the membrane stripping procedure and re-probed for specific proteins. The following chemicals made up the stripping buffer: glycine (1.5%), SDS (0.1%), Tween (20%), and pH (2.2). A suitable volume of the stripping buffer was applied to cover the membrane surface, and it was gently rocked for 15 minutes at room temperature. The step was repeated three times, following a fresh addition of stripping buffer, and then the buffer was discarded. The membrane was then rinsed three times (each for 10 minutes) using TBST. Next, the membrane was blocked with 5% nonfat dry milk powder as above at room temperature for 30 minutes, followed by incubation with primary antibodies.
Measurement of ROS production using DCFH2-DA assay
The production of intracellular oxygen radicals was measured using DCFH2-DA, as previously described [24]. In a 12-well plate, 2 × 10⁵ cells/well were treated with CoQ0 (7.5 µM) for 0-90 min. Afterward, the cells were rinsed with PBS and incubated with 10 µM DCFH2-DA for another 30 min at 37 °C in serum-free culture medium. Next, PBS was used to wash the cells, and the fluorescence intensity of DCF indicating ROS levels was analyzed using fluorescence microscopy (Olympus, Center Valley, PA, USA).
Annexin V-FITC and PI staining for apoptosis analysis
The apoptosis of OECM-1 and SAS cells (1x10⁶ cells/10-cm dish) (20-40 passages) was examined using Annexin V-FITC (BD Biosciences, MI, USA) and PI (propidium iodide) (Sigma-Aldrich, St. Louis, MO, USA) staining as per manufacturer instructions. Summarily, cells were incubated with CoQ0 (0-7.5 μM) for 24 h, trypsinized and washed twice with PBS, followed by centrifugation at 800 rpm for 5 min. Then, the resulting fluorescence intensity [green (FITC) and red (PI)] of each sample was quantified using a FACSCalibur flow cytometer (Accuri C6, BD Biosciences, MI, USA) and Cell Quest software. The results attained were construed as follows: (Q1) PI-positive, Annexin V-FITC-negative stained cells were adjudicated to be in necrosis; (Q2) PI-positive, Annexin V-FITC-positive stained cells were adjudicated to be in late apoptosis; (Q3) cells negative for both PI and Annexin V-FITC staining were accepted as normal live cells; and (Q4) PI-negative, Annexin V-FITC-positive stained cells were arbitrated to be in early apoptosis.
Detection of CD24 and TGF-β expression by flow cytometry
In a 10-cm dish, cells (1 × 10⁶ cells/dish) were grown and exposed to CoQ0 (0-7.5 μM) for 24 h. Afterwards, the cells were washed and trypsinized, and centrifugation for 5 minutes at 1500 rpm was used to collect the cell pellet. Next, the cells were subjected to fixation and permeabilization using the Cytofix/Cytoperm Kit (BD Biosciences, MI, USA) and rinsed with PBS. Next, the cells were incubated for 1 h at room temperature with primary human monoclonal anti-TGF-β and anti-CD24 antibodies that were conjugated to PE (BD Biosciences, MI, USA) before being rinsed three times with PBS. PE-positive cells were evaluated by an Accuri C6 Flow Cytometer (BD Biosciences, MI, USA).
Cell migration assay
A standardized procedure [25] with minor modifications was used to investigate the effect of CoQ0 on cell migration using a wound-healing assay. Briefly, cells were seeded in a 1% gelatin-coated 12-well plate with an Ibidi culture insert (2 × 10⁴ cells/well). The cells were pretreated with IL-6 (50 ng/mL) and then exposed to CoQ0 (0-7.5 μM for 24 or 48 h) in 1% FBS medium before being washed with PBS. The cells were subjected to staining with Giemsa solution (Merck, Darmstadt, Germany), and a phase-contrast microscope (200 × amplification) was used to assess the migrated cells, which were analyzed using Image-Pro Plus software (Media Cybernetics, Inc., USA).
Cell invasion assay
Matrigel invasion chambers (BD Biosciences, MI, USA) were used to assess cell invasion following previously standardized procedures [26]. For invasion assay, 10 μL of Matrigel (25 mg/50 mL) were coated onto the 8-μm polycarbonate membrane filters, and then the cells (2 × 10⁴ cells/well in 12-well plates) were seeded onto the Matrigel-treated filter in 200 μL of CoQ0 (0-7.5 μM) for 24 h deprived of serum. Cell migration or Matrigel invasion underwent 24 h incubation at 37ºC. The cells that did not migrate were detached from atop the membrane by using a cotton swab after 24 h. On the reverse side of the membrane, the cells that migrated were fixed with ice-cold methanol (75%) for 15 min and subsequently, washed with PBS three times. Following the experimental treatments, the cells were subjected to Giemsa staining, and after being rinsed with PBS, the invading cells were imaged using an optical microscope (200 X) and manually quantified.
Immunofluorescence assay
The cells were seeded (3x10⁴ cells/8-chamber slide) in 1% FBS-supplemented medium overnight and exposed to CoQ0 (0-7.5 μM) for 24 h treatment. At the end of the specified treatments, immunofluorescence staining procedures were followed as previously described [24]. Post treatments, the cells were fixed using 2% paraformaldehyde for 15 min and then permeabilized for 10 min with 0.1% Triton X-100 and then washed and blocked with 10% FBS in PBS. The cells were then incubated with primary antibodies (anti-HIF-1α, anti-E-cadherin, and anti-HK-2) in 1.5% FBS for 2 h. The secondary antibodies conjugated with fluorophores Alexa Fluor 594 (Red) or Alexa Fluor 488 (Green) (Invitrogen Life Technologies, Gaithersburg, MD) were used for 1 h at room temperature. Lastly, DAPI (1 μg/mL) for 5 min was used to stain the nuclei of cells. Then, the cells were rinsed with PBS, and images were acquired using a fluorescence microscope and quantified using ImageJ analysis software (National Institutes of Health, USA).
Glucose uptake analysis
Glucose utilization was measured following a previously described protocol [27] with a Glucose Uptake Assay Kit (Cayman, US). The fluorescently tagged glucose derivative 2-NBDG was used to examine the glucose absorption capacity of OECM-1 cells. The cells (1×10⁵ cells/well of a 24-well plate) were grown in RPMI-1640 medium without carbon sources. After being exposed to CoQ0 (0-7.5 μM) for 6 h, the cells were gently washed with PBS and then incubated for 30 min at 37 °C with 100 μM 2-NBDG in glucose-free medium. Then, the cells were rinsed with PBS, and images were immediately captured using a fluorescence microscope (Ex(λ)/Em(λ): 485/530 nm).
Estimation of lactate production
Extracellular and intracellular lactate production by OECM-1 cells was estimated using the L-Lactate Assay Kit following previously established procedures [28]. At the end of the designated treatments, the lactate concentration within the culture medium (extracellular) and cell pellet (intracellular) samples was determined.
Determination of extracellular acidification rate (ECAR)
OECM-1 cells (3 × 10⁴ cells/well) were seeded in the Seahorse XFp culture XF24 well overnight, and then the cells were exposed to CoQ0 (5 μM) without or with the hypoxia-mimetic agent CoCl2 (10 μM) for 24 h. The Seahorse test was performed in an XFp Analyzer System (Agilent Technologies, CA, USA) following the manufacturer's instructions. For consistency of data, treatment with CoQ0 (5 μM) alone or CoQ0 (5 μM) + CoCl2 (10 μM) was performed in the same plate (24-well) of OECM-1 cells. Before tests using the XFp Analyzer, the treated cells were changed to a specific medium (without glucose, FBS, sodium bicarbonate, and HEPES) and incubated in an incubator without CO2 (at 37°C) for 30-60 min. To measure glycolytic activity, the following injections were sequentially administered: glucose (10 mM), oligomycin (1.0 µM), and 2-deoxyglucose (2-DG, 50 mM). Measurements were collected after each injection. After detection of the extracellular acidification ratio, the rise in ECAR was correlated with the rate of glycolysis, glycolytic capacity, and glycolytic reserve under baseline conditions.
Assessment of oxygen consumption rate (OCR)
The OCR was measured using the Seahorse test with an XFp Analyzer System (Agilent Technologies, CA, USA) according to the manufacturer's instructions. In brief, OECM-1 cells (3 × 10⁴ cells/well) were grown in Seahorse XFp culture XF24 wells overnight, followed by exposure to CoQ0 (5 μM) with or without CoCl2 (10 μM) for 24 h. Next, the cells were cultured for 1 h at 37 °C in a CO2-free incubator in Seahorse assay medium. An XFp Analyzer System was used to run the Seahorse test, and the following injections were sequentially administered: oligomycin (1.0 μM), rotenone/antimycin A (0.5 μM), and carbonyl cyanide-p-(trifluoromethoxy) phenylhydrazone (FCCP, 0.5 μM). Readings were collected after each injection.
Metabolomic analysis
The cells were grown on 6-well plates (2 × 10⁵ cells/well) and treated with CoQ0 (2.5-5 µM) as previously described. The samples were prepared, and analysis was performed using liquid chromatography‒electrospray ionization tandem mass spectrometry (LC-ESI-MS) following previously described procedures [21]. The measurement of the metabolites in the samples was performed using a negative ion mode LC-ESI-MS platform, and the data were evaluated by UNIFI software (Waters).
HIF-1α siRNA transfection
OECM-1 and SAS cells (5 × 10⁵ cells/well) were grown in 6-well plates, and transfection was performed when the cells reached 60-70% confluence. The transfection of siRNAs targeting HIF-1α was performed using a commercially available transfection kit (Lipofectamine RNAiMAX, Invitrogen, Carlsbad, CA, USA) according to the manufacturer's recommendations. The culture medium was then substituted with 500 μL of Opti-MEM on the following day and the cells were transfected using RNAiMAX transfection reagent. 5 μL RNAiMAX was mixed with 250 μL of Opti-MEM and incubated the mixture for 5 min at room temperature. In another tube, siRNA (100 pM) was prepared, and mixed with the tube comprising 250 μL of Opti-MEM. The mixture, thus obtained, was poured into the diluted RNAiMAX. The siRNA/RNAiMAX concoction (500 μL) was allowed to incubate for additional 25 min at room temperature to form a transfection complex. Subsequently, the obtained complex mixture was added to the 6-well plate-making the final transfection volume to 1 mL. At 6 h post-transfection, the medium was replaced with 2 mL standard culture medium and grown at 37°C. After siHIF-1α transfection, OECM-1 and SAS cells were exposed to CoQ0 (0 or 7.5 μM) for 24 h.
Animal model and tumor xenograft preparation
Eight-week-old male athymic nude mice (BALB/c-nu) were acquired from the National Laboratory Animal Center (Taipei, Taiwan) and housed in discrete cages in a pathogen-free secluded facility with a 12-h light/dark cycle; the mice were given free access to rodent chow and water. This study was approved by the Animal Ethics Research Board of China Medical University (Approval no. IACUC-2018-065). For tumor xenograft preparation, the left rear flanks of BALB/c nude mice were subcutaneously injected with OECM-1 cells (5 × 10⁶ cells in 100 μL of matrix gel). The treatment groups were orally administered 1.5 mg/kg of CoQ0 every two days for 28 days, and the control group was injected with vehicle alone (1% DMSO) on the same schedule. Body weight measurements were recorded twice every seven days to track the side effects caused by the drugs. The tumor volume was measured every four days using caliper measurements and with the following formula: length × width2 × 0.5 [29]. The mice were sacrificed on the 28th day of treatment. Any signs of treatment side effects on vital organs were examined by a veterinary pathologist.
Statistical analysis
The normal distribution of data was determined relative to the deviation from the mean values of group data. For normally distributed data, one-way analysis of variance (ANOVA) with Dunnett's test was used for pair-wise comparisons and to analyze the significant differences with the control group. The results were presented as the mean ± standard deviation (n=3). β-actin, or GAPDH, served as the internal control. *p < 0.05; **p < 0.01; ***p < 0.001 compared with untreated cells. #p < 0.05; ##p < 0.01; ###p < 0.001 compared with normoxia-, CoCl2-, or IL-6-treated cells.
Results
CoQ0 suppresses cell viability, colony formation, and HIF-1α expression in HNSCC (OECM-1 and SAS) cells
Our previous investigation showed that CoQ0 (Figure 1A), which is a novel quinone derived from Antrodia camphorata, exerted in vitro and in vivo antitumor effects against Twist-overexpressing HNSCC (OECM-1 and FaDu-Twist) cells via the ROS-modulated induction of apoptosis and autophagy [30]. EMT is a dynamic biological process that is indispensable for tumor cell metastasis and involves the diminution of epithelial proteins (E-cadherin) and the increment of mesenchymal proteins (Twist, Vimentin, and N-Cadherin). Our findings revealed that Twist and Vimentin expression were higher in HNSCC (OECM-1 and SAS) cells than in other HNSCC (HSC-3, Cal-27, and FaDu) cells (Figure 1B-C). Additionally, the expression of the mesenchymal marker N-cadherin was higher, while the expression of the epithelial marker E-cadherin was lower in OECM-1 and SAS cells than in other HNSCC (HSC-3, Cal-27, and FaDu) cells (Figure 1D). These results suggested that OECM-1 and SAS cells have more EMT/metastasis potential than HSC-3, Cal-27, and FaDu cells.
Coenzyme Q0 (CoQ0) inhibits cell viability, colony formation, and HIF-1α expression in HNSCC cells. (A) Chemical structure of CoQ0, a quinone derivative from Antrodia camphorata. (B-C) Immunoblotting showing Twist and Vimentin expression in OECM-1, SAS, Cal-27, HSC-3, or FaDu cells. **p < 0.01; ***p < 0.001 compared with OECM-1 cells. (D) N-cadherin and E-cadherin expression in OECM-1, SAS, HSC-3, Cal-27, or FaDu cells as demonstrated by Western blotting. (E-I) Cell viability was assessed using an MTT colorimetric assay. OECM-1, SAS, HSC-3, Cal-27, and FaDu cells were treated with CoQ0 (0-25 μM for 24 h) under normoxic and hypoxic (1% O2) conditions. (J-K) OECM-1 and SAS cells were treated with CoQ0 (0-7.5 μM) and incubated for 8 days to assess colony formation. (L-O) HIF-1α expression was examined by immunoblotting and immunofluorescence analysis. OECM-1 (L-M) and SAS (N-O) cells were treated with CoQ0 (0-7.5 μM for 24 h) under normoxia and hypoxia. Values are the mean ± SD (n=3). *p < 0.05; **p < 0.01; ***p < 0.001 compared with untreated cells. #p < 0.05; ##p < 0.01; ###p < 0.001 compared with normoxia-treated cells.
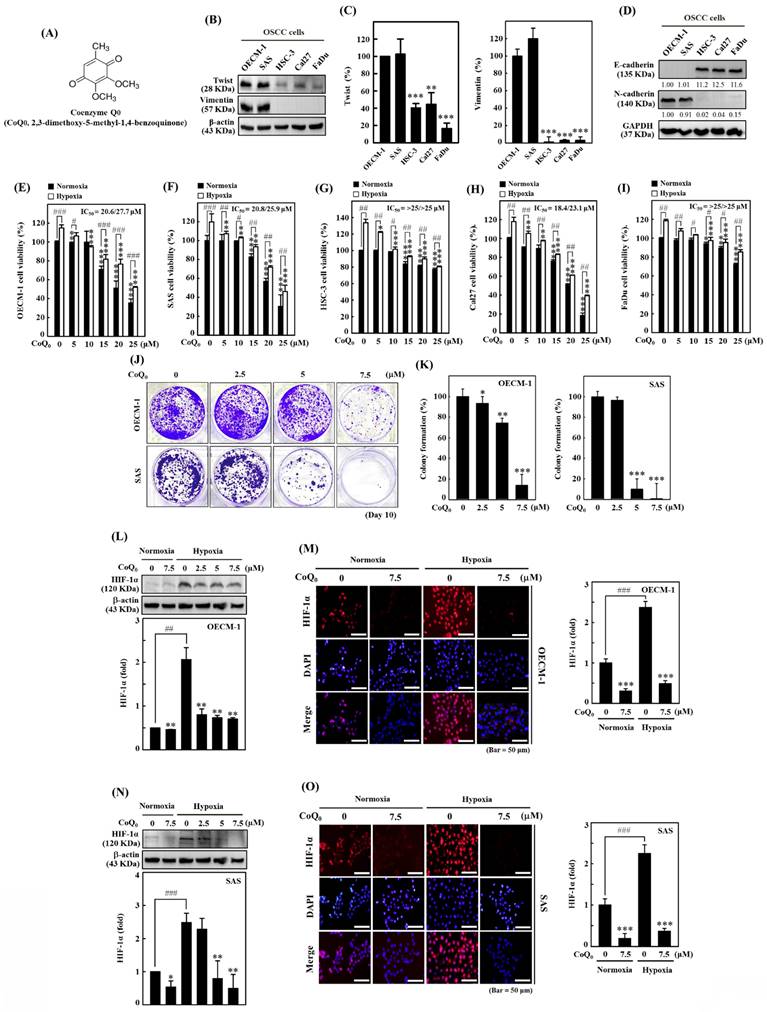
The MTT assay showed that CoQ0 administration markedly reduced the cell viability of OECM-1, SAS, FaDu, HSC-3, and Cal-27 cells under normoxic and hypoxic conditions, with IC50 values of 20.6/27.7, 20.8/25.9, >25/>25, 18.4/23.1, and >25/>25 μM, respectively (Figure 1E-I). Notably, cytotoxicity in HNSCC cells was more prominent under normoxia than under hypoxia (Figure 1E-I). To examine the prolonged effect of CoQ0 (0-7.5 µM for 10 days) on cellular proliferation, the colony forming capacity (a feature of cancer cells that is strongly associated with tumorigenesis) was investigated. CoQ0 administration dose-dependently inhibited the capacity of OECM-1 and SAS cells to form colonies (Figure 1J-K).
In cancer cells, HIF-1α expression is related to the NLRP3 inflammasome, the Warburg effect, and EMT/metastasis [31]. The study investigated the efficacy of CoQ0 (0-7.5 µM for 24 h) on HIF-1α expression in OECM-1 and SAS cells under both normoxia and hypoxia (1% O2). Based on the results of immunoblotting and immunofluorescence analysis, we found that HIF-1α expression in OECM-1 (Figure 1L-M) and SAS (Figure 1N-O) cells was higher under hypoxia than normoxia, while CoQ0 significantly inhibited HIF-1α expression under both normoxia and hypoxia. Our results validated the use of a noncytotoxic CoQ0 dose ranging from 0 to 7.5 µM to inspect the effect of CoQ0 on HIF-1α inhibition, NLRP3 inflammation suppression, EMT/metastasis inhibition, and metabolic reprogramming in OECM-1 and SAS cells.
CoQ0 inhibits hypoxia-induced intracellular ROS production in OECM-1 and SAS cells
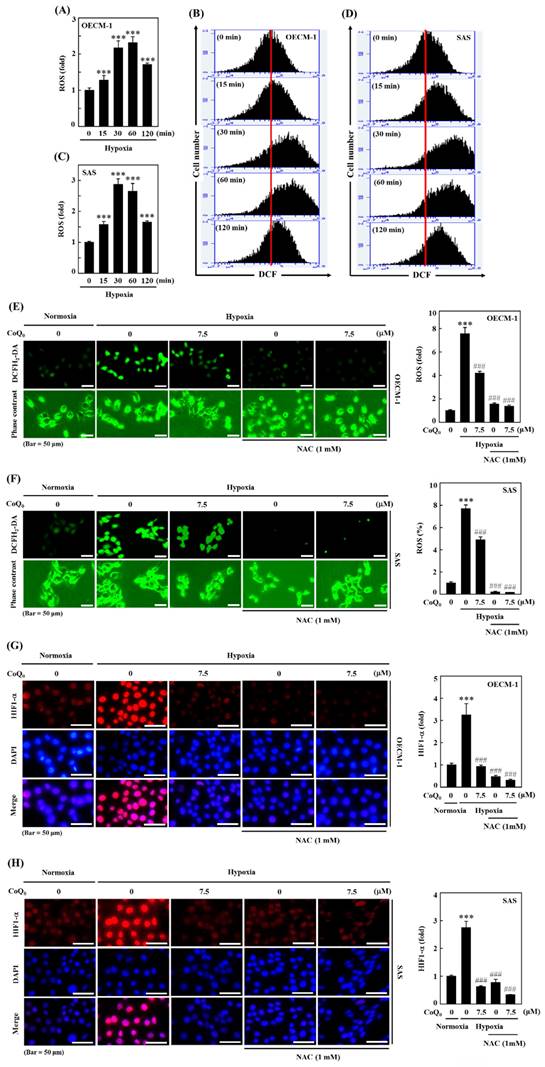
The ROS production is well known to enhance HIF-1α expression. The efficacy of CoQ0 on hypoxia-induced intracellular ROS generation in OECM-1 and SAS cells was determined. As shown by the fluorescence microscopy and flow cytometry DCF assays, OECM-1 and SAS cells exposed to hypoxia produced a remarkable amount of ROS, which peaked at 30 min and 60 min (Figure 2A-D). Next, to assess whether the effect of CoQ0 treatment is mediated via an anti-oxidant pathway, we used N-acetylcysteine (NAC), a well-known anti-oxidant compound, for in vitro assays. Our results showed that pretreatment with CoQ0 (7.5 µM) and/or NAC (1 mM) notably suppressed hypoxia-triggered ROS generation in OECM-1 and SAS cells (Figure 2E-F). The combined effects of CoQ0 and NAC were similar to NAC alone treatment, whereas, there was a synergistic effect when CoQ0 and NAC were compared to CoQ0 alone, suggesting that CoQ0 follows an anti-oxidant mediated pathway. These data confirmed that exposure to hypoxia leads to the substantial release of ROS by OECM-1 and SAS cells, which was significantly abolished by CoQ0 and/or NAC treatment.
CoQ0 repressed hypoxia-mediated ROS and HIF-1α expression in SAS and OECM-1 cells. (A-D) The time-dependent effect on hypoxia-enhanced ROS generation as determined by measuring the fluorescence intensity of DCFH2-DA by flow cytometry. OECM-1 and SAS cells were treated with CoQ0 (7.5 μM) for 0-120 min under hypoxic conditions. (E-F) CoQ0 and/or NAC suppressed hypoxia-enhanced ROS generation, as shown by the fluorescence intensity of DCFH2-DA under a fluorescence microscope (Olympus Soft Imaging Solution). OECM-1 and SAS cells under hypoxia were exposed to CoQ0 (7.5 μM) or NAC (1 mM) for 60 or 30 min. (G-H) CoQ0 and/or NAC inhibited hypoxia-induced ROS-mediated HIF-1α expression as determined by using an immunofluorescence assay. OECM-1 and SAS cells under hypoxia were treated with CoQ0 (7.5 μM) or NAC (1 mM) for 24 h. Values are the mean ± SD (n=3). ***p < 0.001 compared with untreated cells. ###p < 0.001 compared with normoxia-treated cells.
CoQ0 inhibits hypoxia-induced ROS-mediated HIF-1α expression in OECM-1 and SAS cells
Hypoxia, which acts through ROS delivery and HIF-1α stabilization, is a key determinant of human tumor progression. To further reaffirm the action of CoQ0 on ROS-mediated HIF-1α expression under hypoxic conditions, we examined whether treatment with CoQ0 could alter HIF-1α expression. The immunofluorescence data demonstrated that CoQ0 (7.5 µM for 24 h) and/or NAC (1 mM for 24 h) treatment suppressed HIF-1α expression under hypoxia in OECM-1 and SAS cells (Figure 2G-H). These data confirmed that CoQ0 inhibited hypoxia-triggered ROS-mediated HIF-1α expression in HNSCC cells.
CoQ0 suppresses the NLRP3/NFκB inflammasome in OECM-1 and SAS cells
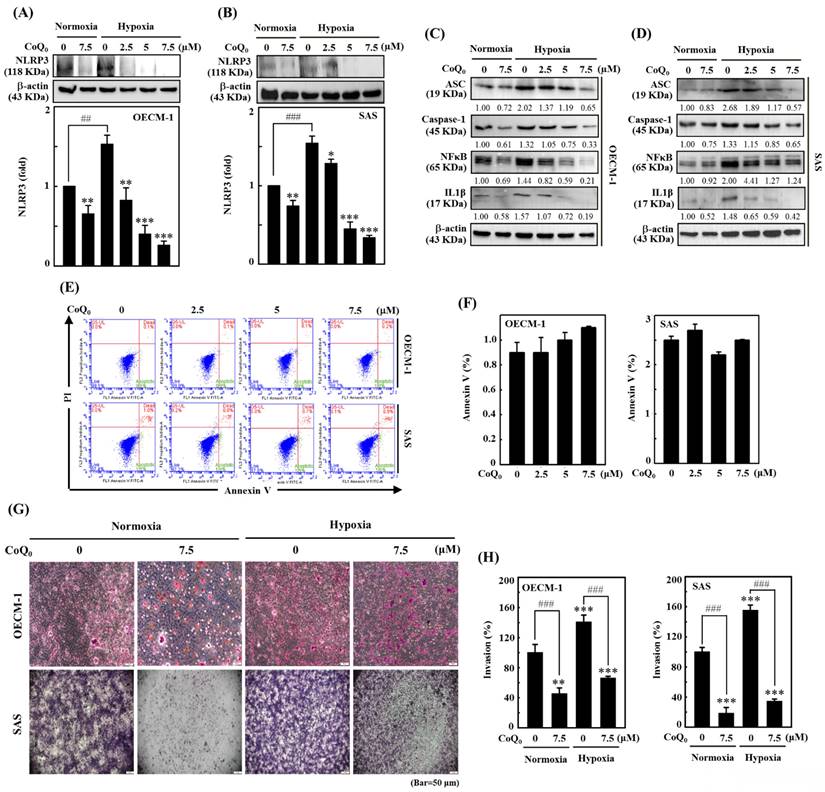
The NLRP3 inflammasome consists of the adaptor and effector proteins NLRP3, Caspase-1, and ASC, which are abundantly produced by cancer cells [32]. Our data indicated that CoQ0 treatment (0-7.5 µM for 24 h) markedly suppressed NLRP3 expression in OECM-1 and SAS cells under normoxia and hypoxia (Figure 3A-B). Furthermore, the data showed that CoQ0 exposure inhibited ASC and caspase-1 expression in OECM-1 and SAS cells under normoxia and hypoxia (Figure 3C-D). NLRP3 and NFκB perform crucial functions in the regulation of inflammasome formation and the expression of IL-1β. The data showed that CoQ0 exposure inhibited NFκB and IL-1β in SAS and OECM-1 cells under normoxia and hypoxia (Figure 3C-D). Together, these results suggest that CoQ0 attenuates NLRP3 inflammation in HNSCC (OECM-1/SAS) cells under normoxia and hypoxia.
CoQ0 inhibits the NLRP3 inflammasome and invasion in OECM-1 and SAS cells under normoxia and hypoxia. Cells were incubated with CoQ0 (0-7.5 μM) for 24 h. (A-B) NLRP3 expression was determined by immunoblotting analysis. The protein densitometric quantifications were performed using commercially accessible software (AlphaEase, Genetic Technology Inc., Miami, FL, USA). (C-D) Western blotting shows IL-1β, ASC, Caspase-1, and NFκB expression. (E-F) Annexin V-FITC-negative cells analyzed by flow cytometry indicated normal cells. (G-H) Invasion was measured using BD Matrigel chambers. Values are the mean ± SD (n=3). **p < 0.01; ***p < 0.001 compared with untreated cells. ###p < 0.01 compared with normoxia-treated or untreated cells.
CoQ0 inhibits the invasion and migration of OECM-1 and SAS cells
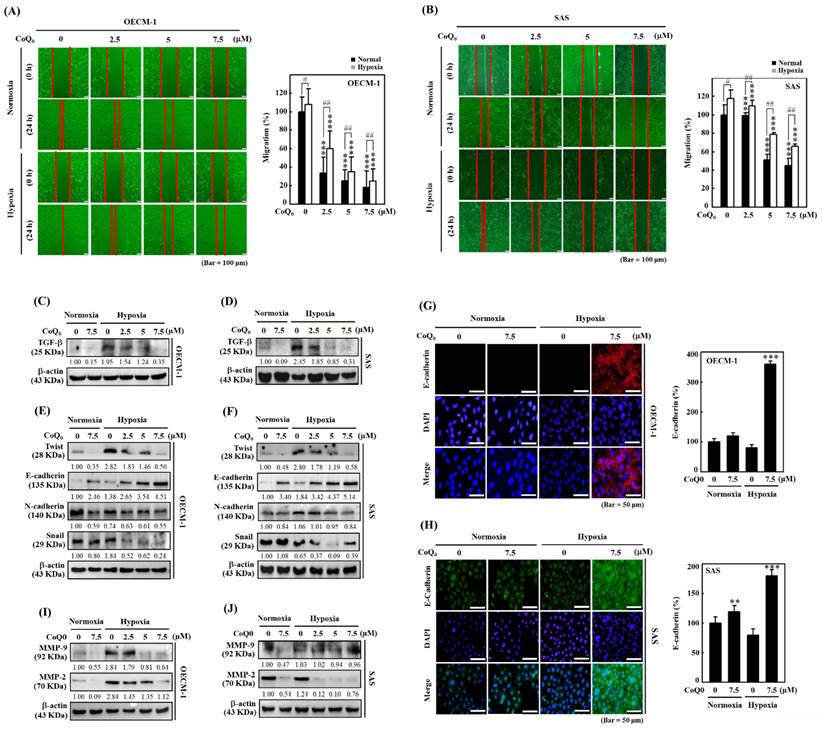
Cancer cell invasion or migration impacts the early stages of metastasis and promotes the advancement of untreatable complex metastasis. We elucidated the impact of CoQ0 (0-7.5 μM for 24 h) on apoptosis. Flow cytometry analysis using Annexin V-FITC staining revealed that treatment of OECM-1 and SAS cells with CoQ0 caused no significant increase in the proportion of apoptotic cells (Figure 3E-F). These data indicated that treatment with 0-7.5 μM CoQ0 for 24 h had no cytotoxic effects on OECM-1 and SAS cells. Next, we assessed the impact of CoQ0 treatment on the invasion of OECM-1 and SAS cells. The data indicated that the invasion of OECM-1 and SAS cells under hypoxic conditions was more intensified than that under normoxia (Figure 3G-H). CoQ0 treatment conspicuously decreased OECM-1 and SAS cell invasion under normoxic and hypoxic conditions (Figure 3G-H). Furthermore, these data also revealed that the migration ability of OECM-1 and SAS cells under hypoxia was more prominent than that under normoxia; however, treatment with CoQ0 dose-dependently inhibited OECM-1 and SAS cell migration under normoxic and hypoxic conditions (Figure 4A-B).
CoQ0 attenuated the migration and EMT in OECM-1 and SAS cells under normoxia and hypoxia. Cells were treated with CoQ0 (0-7.5 μM) for 24 h. (A-B) Cell migration in a wound-healing assay was observed by an optical microscope, and commercially available software was used to determine the wound healing area. (C-D) Cell migration (%) was calculated using commercially available software (Image-Pro Plus). (E-F) TGF-β expression was examined by immunoblotting analysis. (G-H) Immunoblot showing the protein expression of Twist, E-cadherin, N-cadherin, and Snail. (I-J) Immunofluorescence analysis of E-cadherin expression. (K-L) MMP-9 and MMP-2 expression were determined by immunoblotting. Values are the mean ± SD (n=3). **p < 0.01; ***p < 0.001 compared with untreated cells. #p < 0.05; ##p < 0.01 compared with normoxia-treated cells.
CoQ0 suppresses TGF-β expression in SAS and OECM-1 cells
TGF-β is known to promote EMT through the TGF-β/Smad/Snail molecular pathways [33]. We examined whether CoQ0 (0-7.5 µM for 24 h) treatment could inhibit TGF-β in OECM-1 and SAS cells under normoxia and hypoxia. These data showed that TGF-β expression was more prominent under hypoxic conditions than that under normoxic conditions; however, exposure to CoQ0 significantly decreased TGF-β expression under both normoxia and hypoxia (Figure 4A-D).
CoQ0 reverses EMT by decreasing Twist, Snail, and N-cadherin expression and enhancing E-cadherin expression in SAS and OECM-1 cells
EMT is a dynamic pathway that regulates cancer cell propensity by changing the mesenchymal markers Twist, N-cadherin, and Snail expression, and the epithelial marker E-cadherin expression [34]. Western blotting showed that Twist, N-cadherin, and Snail expression in SAS and OECM-1 cells was higher under hypoxic conditions than under normoxic conditions (Figure 4E-F). However, treatment with CoQ0 decreased Twist, N-cadherin, and Snail expression (Figure 4E-F). In addition, Western blotting (Figure 4E-F) and immunofluorescence staining (Figure 4G-H) revealed that E-cadherin expression was lower under hypoxic conditions than under normoxic conditions, while CoQ0 treatment increased E-cadherin expression in OECM-1 and SAS cells under normoxia and hypoxia.
CoQ0 inhibits MMP-2 and MMP-9 expression in OECM-1 and SAS cells
MMP-9 and MMP-2 are the principal proteolytic enzymes that promote cancer cell invasion by decomposing the basement membrane and then triggering cancer metastasis [35]. The data indicated that the expression of MMP-2 and MMP-9 was higher under hypoxic conditions than under normoxic conditions, while exposure to CoQ0 inhibited MMP-9 and MMP-2 expression in OECM-1 and SAS cells (Figure 4I-J).
CoQ0 decreases glucose absorption and lactate accumulation in OECM-1 and/or SAS cells
The study used a noncytotoxic concentration of CoQ0 (0-7.5 μM for 24 h) in subsequent experiments to investigate its effect on the Warburg effect, which prefers aerobic glycolysis over mitochondrial oxidative respiration. An increase in glucose absorption and a preference for lactate accumulation in spite of the presence of oxygen are characteristics of the Warburg effect. Lactate, which is one of the products of glycolysis, has the capacity to change the cancer microenvironment and promote tumor development [36]. A novel fluorescent glucose analog probe called 2-NBDG has been utilized extensively as a tracer for monitoring of glucose transport directly in a variety of cell types. In mammalian cells, it has been confirmed that 2-NBDG is intracellularly transported via the same glucose transporters (GLUTs) as glucose [37]. Therefore, we used 2-NBDG, to assess glucose uptake in HNSCC cells. The data showed that CoQ0 treatment decreased aerobic glycolysis by suppressing glucose uptake and reducing extracellular and intracellular lactate accumulation in OECM-1 cells (Figure 5A-C).
CoQ0 prevents glucose absorption/lactate accumulation and inhibits GLUT1/glycolytic enzyme (HK-2, PFK-1, and LDH-A) expression in OECM-1 and/or SAS cells. (A-B) Glucose uptake was examined under a fluorescence microscope. OECM-1 cells were treated with CoQ0 (0-7.5 μM) for 6 h, followed by incubation with 2-NBDG (100 μM). (C) Extracellular and intracellular lactate accumulation was examined by using a Cayman Lactate test kit. OECM-1 cells were treated with CoQ0 (0-7.5 μM) for 24 h. (D-E) The expression of the glycolytic enzyme HK-2 was examined using immunofluorescence analysis. Cells were exposed to CoQ0 (0 or 7.5 μM for 24 h) under normoxia and hypoxia. (F-I) Western blotting was used to examine GLUT1, HK-2, PFK-1, and LDH-A expression in OECM-1 and SAS cells. Cells were treated with CoQ0 (0-7.5 μM) for 24 h under normoxia and hypoxia. Values are the mean ± SD (n=3). *p < 0.05; **p < 0.01; ***p < 0.001 compared with untreated cells. #p < 0.05; ###p < 0.001 compared with normoxia-treated cells.
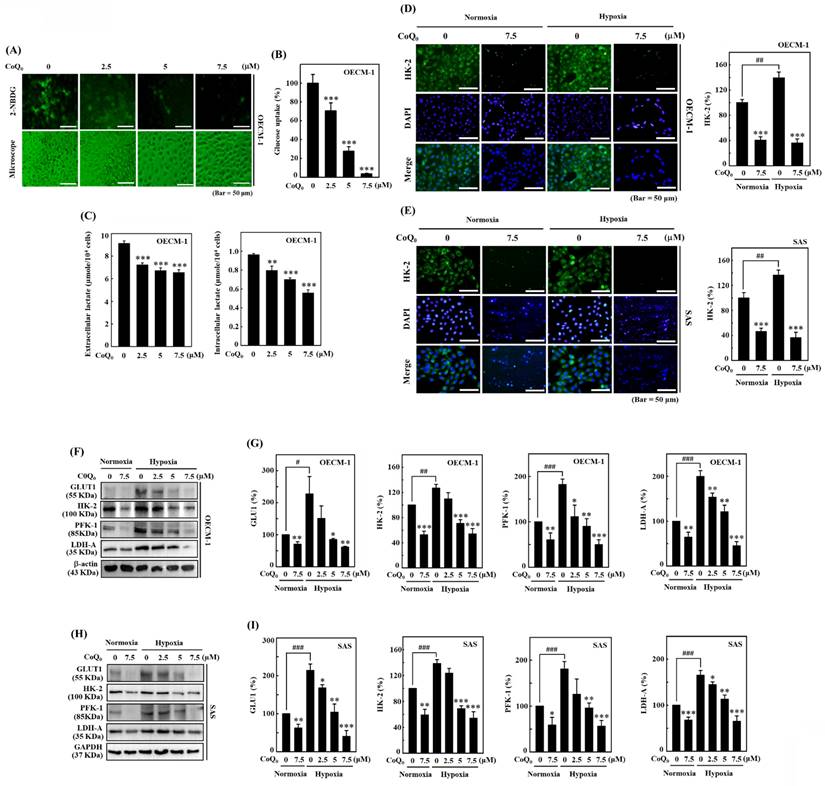
The initial phase in the glucose metabolic pathway (aerobic glycolysis) involves the phosphorylation of Hexokinase (HK) [36]. Immunofluorescence data showed that HK-2 expression under hypoxia was higher than that under normoxia, while CoQ0 treatment diminished HK-2 expression in OECM-1 and SAS cells (Figure 5D-E). These findings indicated that CoQ0 treatment attenuated the Warburg effect in HNSCC cells.
CoQ0 decreases the expression of the glucose transporter GLUT1 and glycolytic enzymes HK-2, PFK-1, and LDH-A in OECM-1 and SAS cells
The glucose transporter GLUT1 facilitates the passage of glucose across cell membranes. PFK-1, which is an essential enzyme for aerobic glycolysis, catalyzes the transformation of fructose-6-phosphate and ATP into fructose-1,6-bisphosphate (FBP) and ADP [36]. Pyruvate and L-lactate are transformed into each other by LDH-A. Our findings revealed that GLUT1, HK-2, PFK-1, and LDH-A protein expression were enhanced in OECM-1 and SAS cells under hypoxic conditions compared to normoxic conditions. However, CoQ0 (0-7.5 μM for 24 h) treatment suppressed GLUT1, HK-2, PFK-1, and LDH-A expression in OECM-1 and SAS cells under hypoxic and normoxic conditions in a dose-dependent manner (Figure 5F-I). Our results showed that CoQ0 inhibited HIF-1α-regulated glycolysis enzymes in SAS and OECM-1 cells under hypoxia and normoxia.
CoQ0 suppresses the extracellular acidification rate (ECAR) and glycolytic intermediate levels in OECM-1 cells
The extracellular acidification rate (ECAR) is typically used to examine aerobic glycolysis [38].
Oligomycin is an ATP synthase (complex V) inhibitor which decreases electron flow across the electron transport chain, which in turn lowers cellular ATP generation and mitochondrial respiration or oxygen consumption rate (OCR). This causes the generation of energy to switch to glycolysis, and the maximum glycolytic capacity of the cell is revealed by the increase in ECAR that follows. The last injection with 2-DG (a glucose analog), competitively inhibits glycolysis through binding to glucose hexokinase, the initial enzyme in the glycolytic pathway. The subsequent drop in ECAR demonstrates that the ECAR produced in the experiment is due to glycolysis. The glycolytic capacity and glycolysis rate differences are indicative of the glycolytic reserve of the cells [39].
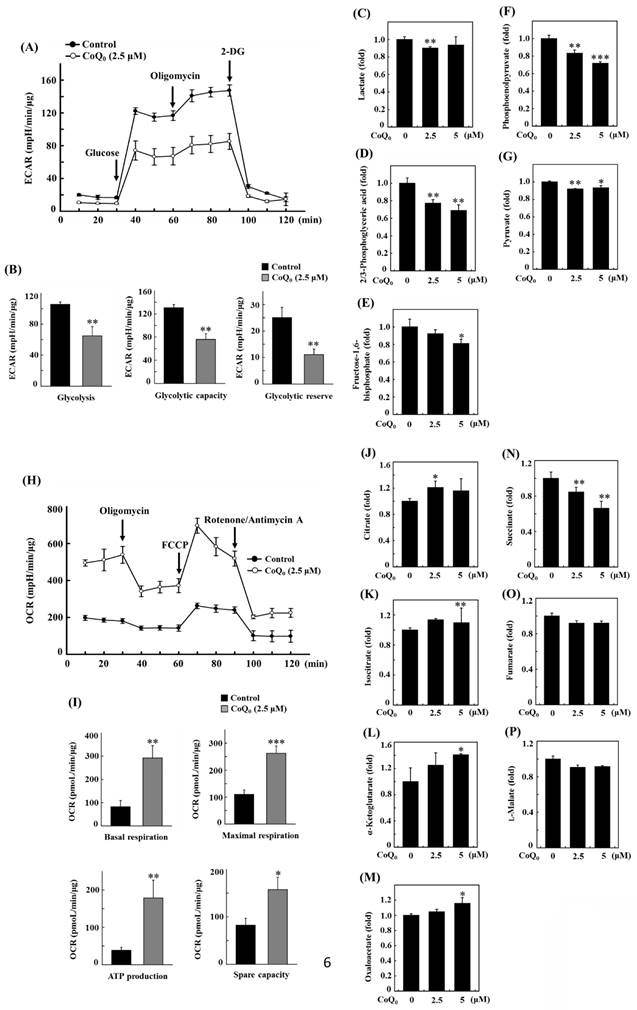
Measuring the efficacy of CoQ0 (0 and 2.5 μM for 24 h) on the ECAR allowed us to determine whether the Warburg effect was inhibited. The results disclosed that CoQ0 inhibited the glucose-stimulated ECAR and reduced the glycolytic reserve, glycolytic capability, and glycolysis in OECM-1 cells (Figure 6A-B). Furthermore, glycolytic intermediates were examined using LC-ESI-MS metabolomic analysis. The data showed that CoQ0 (0-5 μM for 24 h) treatment markedly reduced the lactate, 2/3-phosphoglycerate (2/3-PG), FBP, phosphoenolpyruvate (PEP), and pyruvate levels in OECM-1 cells (Figure 6C-G).
CoQ0 attenuated the extracellular acidification rate (ECAR)/aerobic glycolysis intermediates and augmented the oxygen consumption rate (OCR)/TCA cycle (mitochondrial oxidative phosphorylation) metabolites in OECM-1 cells. (A-B) The ECAR, glycolytic capacity, glycolysis, and glycolytic reserve were examined. Cells were treated with CoQ0 (0 or 2.5 μM) for 24 h. (C-G) Levels of aerobic glycolysis intermediates, including lactate (C), 2/3-phosphoglycerate (2/3-PG) (D), fructose 1,6-bisphosphate (FBP) (E), phosphoenolpyruvate (PEP) (F), and pyruvate (G), were examined using an LC-ESI-MS metabolomics platform. Cells were treated with CoQ0 (0-5 μM) for 24 h. (H-I) The OCR, basal respiration, ATP generation, maximal respiration, and spare capacity were determined. Cells were treated with CoQ0 (0 or 2.5 μM) for 24 h. (J-P) Levels of TCA cycle metabolites, including citrate (J), isocitrate (K), α-ketoglutarate (L), oxaloacetate (M), succinate (N), fumarate (O), and L-malate (P), were examined using an LC-ESI-MS metabolomics platform. Cells were treated with CoQ0 (0-5 μM) for 24 h. Values are the mean ± SD (n=3). *p < 0.05; **p < 0.01; ***p < 0.001 compared with untreated cells.
CoQ0 increases the oxygen consumption rate (OCR) and TCA cycle (mitochondrial oxidative phosphorylation)-derived metabolite levels in OECM-1 cells
To further inspect the role of CoQ0 in the Warburg effect, we determined the OCR and measured TCA cycle-derived metabolite levels in OECM-1 cells. The results revealed that CoQ0 (0 and 2.5 μM for 24 h) treatment promoted the OCR and increased ATP production, basal respiration, maximal respiration, and spare capacity compared to nontreated OECM-1 cells (Figure 6H-I). Next, OECM-1 cells were incubated with CoQ0 (0-5 μM for 24 h), and then TCA cycle metabolite levels were tracked. LC-ESI-MS metabolomic analysis was used to measure the amounts of isocitrate, α-ketoglutarate, citrate, oxaloacetate, succinate, fumarate, and L-malate. There was an elevation in the amounts of citrate, isocitrate, α-ketoglutarate, and oxaloacetate in CoQ0-treated versus nontreated OECM-1 cells (Figure 6J-M). These metabolites, whose levels are increased by the Warburg effect, are consistent with enhancement in the TCA cycle (mitochondrial oxidative respiration). Nevertheless, there was no increase in the succinate, fumarate, or L-malate levels in CoQ0-treated OECM-1 cells (Figure 6N-P).
CoQ0 ameliorates the Warburg effect in OECM-1 cells treated with the hypoxia-mimetic agent CoCl2
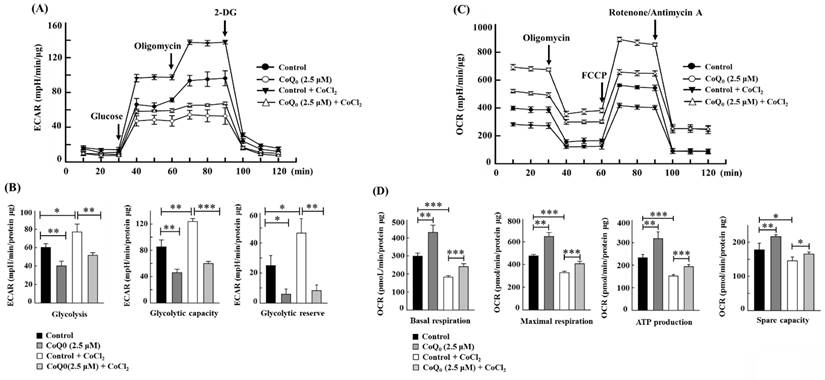
CoCl2 is a commonly used chemical that artificially induces hypoxia, leading to the stabilization of HIF-1α [40]. As expected, CoCl2 treatment resulted in hypoxia in OECM-1 cells, leading to an increased ECAR and a decreased OCR (Figures 7A, and 7C). Compared with non-CoCl2 treatment, the increase in the ECAR and decrease in the OCR were more pronounced after CoCl2 treatment (Figures 7A, and 7C). However, in both CoCl2-stimulated and control OECM-1 cells, we discovered that CoQ0 (0 and 2.5 μM for 24 h) inhibits the glucose-stimulated ECAR and suppresses glycolysis, glycolytic capability, and glycolytic reserves (Figure 7A-B). Additionally, the elevation in glycolysis, glycolytic capability, and glycolytic reserves in the CoCl2 treatment group were more pronounced than those in the non-CoCl2 treatment group (Figure 7B). In addition, treatment with CoQ0 (0 and 2.5 μM for 24 h) increased the OCR, basal respiration, ATP generation, maximal respiration, and spare capacity compared to OECM-1 cells treated without or with CoCl2 (Figure 7C-D). Moreover, the increases in basal respiration, ATP generation, maximal respiration, and spare capacity in non-CoCl2-treated cells were more prominent than those in CoCl2-treated OECM-1 cells (Figure 7D). These findings demonstrated that CoQ0 suppresses the ECAR (Warburg effects) and enhances the OCR (mitochondrial oxidative phosphorylation) under both normoxia and hypoxia (CoCl2).
CoQ0 attenuated the ECAR and enhanced the OCR in OECM-1 cells exposed to normoxia and the hypoxia-mimetic agent CoCl2. Cells were incubated with CoQ0 (0 or 2.5 μM for 24 h) under normoxia and hypoxia (CoCl2, 10 μM). (A-B) The ECAR, glycolytic capacity, glycolysis, and glycolytic reserve were increased by CoCl2 and attenuated by CoQ0 treatment. (C-D) The OCR, basal respiration, ATP synthesis, maximum respiration, and spare capacity were inhibited by CoCl2 and enhanced by CoQ0 treatment. Values are the mean ± SD (n=3). *p < 0.05; **p < 0.01; ***p < 0.001 compared with untreated or CoCl2-treated cells.
Effect of HIF-1α knockdown in OECM-1 and SAS cells under hypoxia
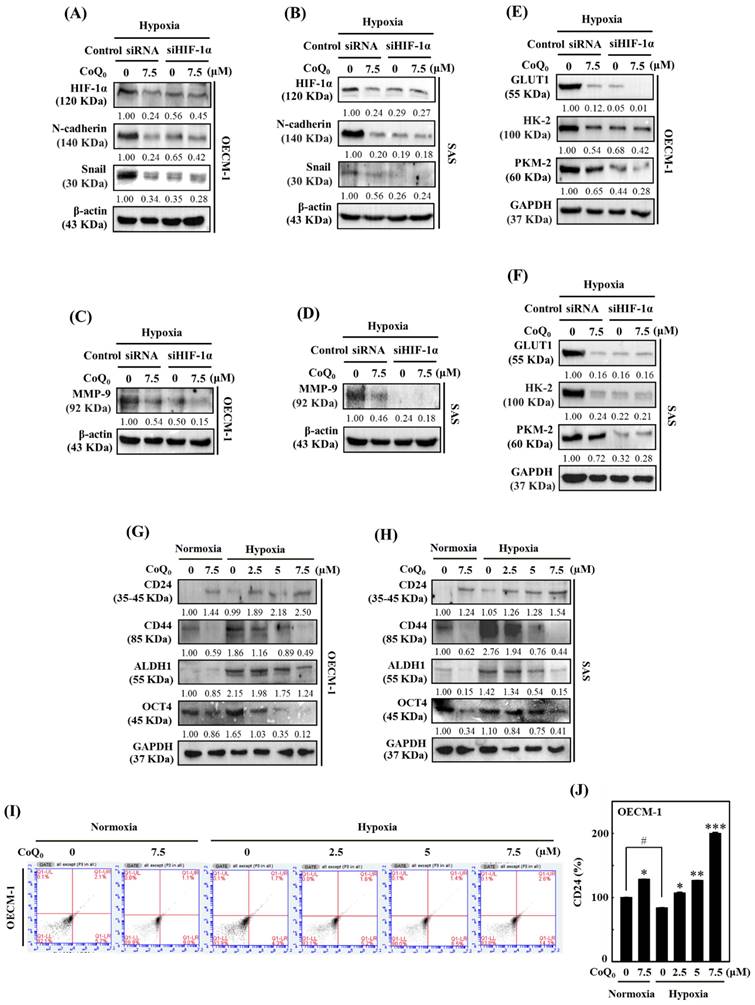
To further verify the impact of HIF-1α in HNSCC cells under hypoxia (1% O2), siRNAs specifically targeting HIF-1α expression were transfected into OECM-1 and SAS cells. Silencing HIF-1α further enhanced CoQ0-suppressed N-cadherin and Snail expression, suggesting a major contribution of HIF-1α inhibition to CoQ0-triggered anti-EMT effects in OECM-1 and SAS cells under hypoxic conditions (Figure 8A-B). As above, a combinatorial effect of CoQ0 and HIF-1α knockdown was observed on MMP-9 expression, which was decreased compared to hypoxia alone-treated OECM-1 and SAS cells (Figure 8C-D). Furthermore, as shown in Figure 8E-F, siHIF-1α enhanced the effect of CoQ0 and additionally inhibited GLUT1, HK-2, and PKM-2 expression, confirming the crucial contribution of HIF-1α inhibition in the CoQ0-attenuated Warburg effect under hypoxic conditions in OECM-1 and SAS cells. Together, these findings suggested that silencing HIF-1α expression exerted a combinatorial effect with CoQ0-mediated inhibition of N-cadherin, Snail, MMP-9, GLUT1, HK-2, and PKM-2 expression, suggesting an important role of HIF-1α inhibition in the CoQ0-mediated anti-metastasis effects and metabolic reprogramming of OECM-1 and SAS cells under hypoxic conditions.
HIF-1α silencing reversed CoQ0-mediated anti-metastasis and metabolic reprogramming, and CoQ0 prevented cancer stem-like characteristics in OECM-1 and/or SAS cells under normoxia and/or hypoxia. (A-F) Cells were transfected with siRNAs targeting HIF-1α or nontargeting control siRNAs. Next, the cells were incubated with CoQ0 (7.5 µM) for 24 h under hypoxic conditions. (A-B) HIF-1α, N-cadherin, and Snail expression were determined using immunoblotting analysis. (C-D) Western blotting analysis shows MMP-9 expression. (E-F) GLUT1, HK-2, and PKM-2 expression were assessed using immunoblotting analysis. (G-J) Cells were treated with CoQ0 (0-7.5 μM for 24 h) under normoxia and/or hypoxia. (G-H) Expression of the stem cell markers CD24, CD44, ALDH1, and OCT4 in OECM-1 and SAS cells was determined by immunoblotting analysis. (I-J) CD24 expression in OECM-1 cells was assessed by flow cytometry analysis. Values are the mean ± SD (n=3). *p < 0.05; **p < 0.01; ***p < 0.001 compared with untreated cells. #p < 0.05 compared with normoxia-treated cells.
CoQ0 upregulates CD24 expression and downregulates CD44 expression in OECM-1 and SAS cells
Cancer stem cells are unique in their ability to undergo EMT, differentiation, and self-renewal, and they exhibit CD24low and CD44high expression [41]. The results showed that CoQ0 (0-7.5 µM for 24 h) treatment increased CD24 and decreased CD44 expression in OECM-1 and SAS cells under normoxia and hypoxia (Figure 8G-H). Additionally, we determined whether CoQ0 has an impact on ALDH1 and OCT4, which are markers of cancer stem cells. Similar results were observed for ALDH1 and OCT4 expression, which was decreased by CoQ0 (Figure 8G-H). Flow cytometry analysis further confirmed that CoQ0 increases CD24 expression in OECM-1 cells under normoxic and hypoxic conditions (Figure 8I-J). Consistent with findings from other studies, we found decreased expression of the cancer stem cell markers CD44, ALDH1, and OCT4 in OECM-1 and SAS cells under hypoxic conditions compared to normoxic conditions.
CoQ0 reverses IL-6-stimulated morphological changes (epithelial-to-fibroblastic phenotype) in salivary gland epithelial (SG) cells
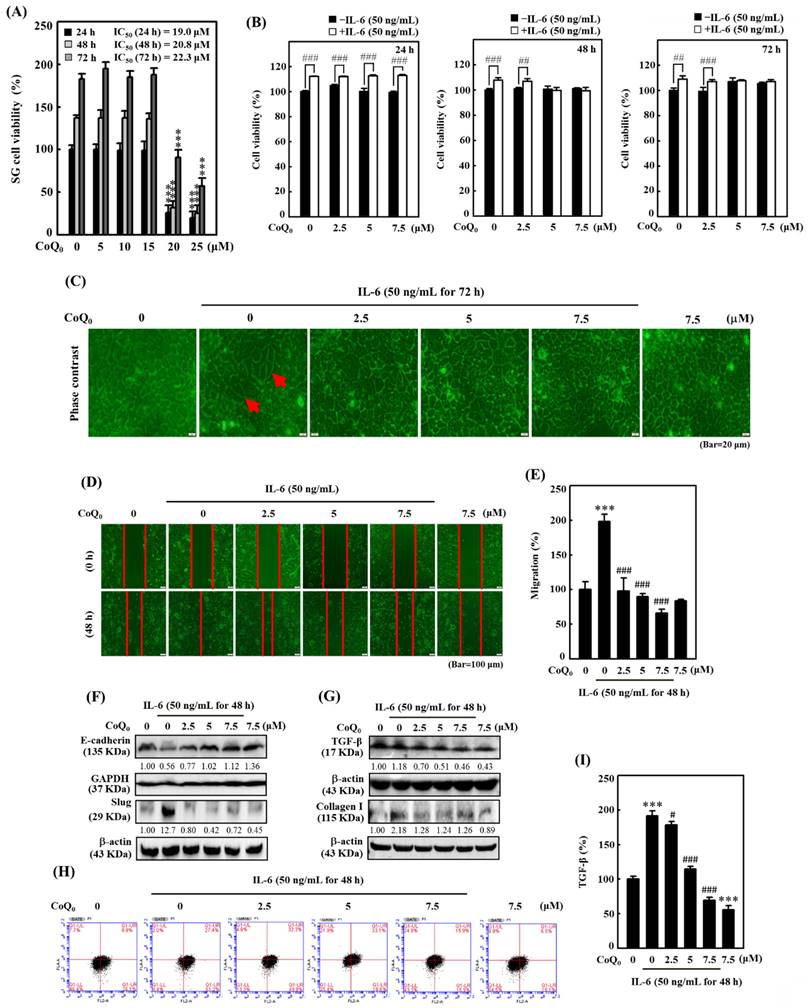
The overexpression of the cytokine IL-6 is known to promote EMT and fibrosis in several inflammatory conditions that predispose to cancer development [42]. To determine the significance of CoQ0 in preventing EMT and fibrosis, we used IL-6-stimulated SG cells. We found that CoQ0 (0-25 µM for 24, 48, or 72 h) treatment markedly decreased the viability of SG cells, with IC50 values of 19.0, 20.8, or 22.3 µM, respectively (Figure 9A). Furthermore, the MTT of noncytotoxic CoQ0 concentrations (0-7.5 μM for 24, 48, or 72 h) on IL-6 (50 ng/mL)-stimulated SG cells were also determined. The data showed that IL-6 stimulation with CoQ0 treatment increased SG cell viability (Figure 9B). In addition, SG cells incubated with IL-6 (50 ng/mL for 72 h) exhibited abnormal morphological changes from an epithelial-to-fibroblastic phenotype (Figure 9C). However, CoQ0 (0-7.5 μM for 72 h) treatment reversed the IL-6-induced fibrotic effects and restored the fibroblastic-to-epithelial phenotype in SG cells (Figure 9C).
CoQ0 inhibited IL-6-stimulated morphological changes (epithelial-to-fibroblastic phenotype), metastasis/EMT, and fibrosis in human salivary gingival epithelial SG cells. (A) Cells (in medium supplemented with 1% FBS) were incubated with CoQ0 (0-25 μM) for 24, 48, or 72 h. The MTT colorimetric test was utilized to determine cell viability. (B) Cells (in medium supplemented with 1% FBS) were incubated with CoQ0 (0-7.5 μM) for 24, 48, or 72 h without or with IL-6 (50 ng/mL). Cell viability was assessed using the MTT colorimetric test. (C) The morphological changes were determined using a phase contrast microscope. Arrows indicate fibroblastic cells. Cells (medium supplemented with 1% FBS) were treated with CoQ0 (0-7.5 μM) for 72 h without or with IL-6 (50 ng/mL). (D-I) Cells were stimulated without or with IL-6 (50 ng/mL) following CoQ0 (0-7.5 μM for 48 h) treatment. (D-E) Cell migration in a wound-healing assay was observed by an optical microscope, and commercially available software was used to determine the wound healing area. (F) E-cadherin and Slug expression were determined by immunoblotting analysis. (G) TGF-β and Collagen I expression were determined by Western blotting. (H-I) TGF-β expression was examined by flow cytometry analysis. Values are the mean ± SD (n=3). ***p < 0.001 compared with untreated cells. #p < 0.05; ##p < 0.01; ###p < 0.001 compared with IL-6-treated cells.
CoQ0 inhibits IL-6-stimulated EMT in SG cells
We also examined the impact of CoQ0 (0-7.5 μM for 48 h) treatment on EMT and migration in SG cells. Our findings disclosed that CoQ0 significantly suppressed the migration of IL-6-stimulated SG cells (Figure 9D-E). Additionally, we assessed the E-cadherin (an epithelial phenotype marker) and Slug (a mesenchymal phenotype marker) protein expression, which are known to regulate the EMT process, in IL-6-stimulated SG cells. Compared to the control, CoQ0 treatment increased E-cadherin expression and decreased Slug expression in IL-6-stimulated SG cells in a dose-dependent manner (Figure 9F). These results revealed that CoQ0 treatment could have an anti-EMT effect on SG cells that had been incubated with IL-6.
CoQ0 suppresses fibrosis by inhibiting TGF-β and Collagen I production in IL-6-stimulated SG cells
TGF-β plays a crucial role in myofibroblast phenoconversion, which is primarily responsible for fibrogenic effects. In addition, Collagen I is a key pathogenic factor in fibrotic conditions. We investigated the effect of CoQ0 treatment (0-7.5 μM for 48 h) on TGF-β and Collagen I expression in IL-6-stimulated (50 ng/mL for 48 h) SG cells. The western blot findings demonstrated that CoQ0 treatment diminished TGF-β and Collagen I expression in IL-6-stimulated SG cells in a dose-dependent manner (Figure 9G). TGF-β expression was further confirmed by flow cytometry analysis, which showed CoQ0 significantly decreased TGF-β expression in a dose-dependent manner in IL-6-stimulated SG cells (Figure 9H-I).
CoQ0 suppresses the growth of OECM-1 xenograft tumors
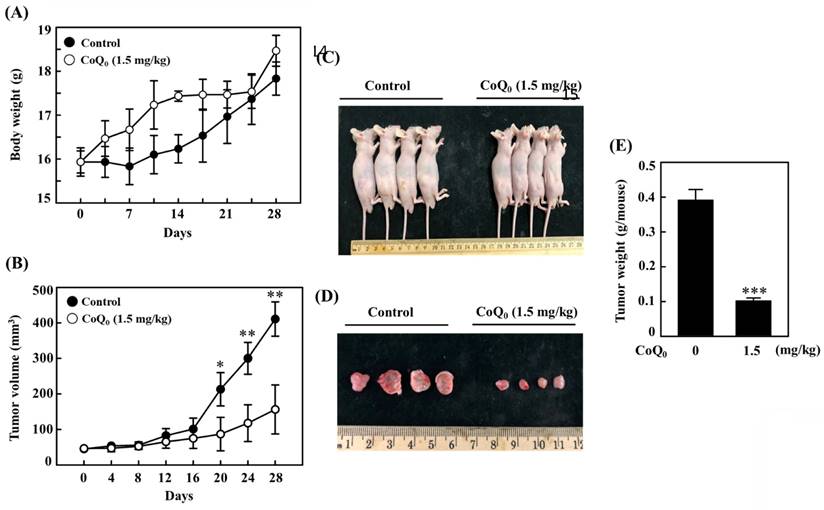
We investigated the anticancer potential of CoQ0 in a model of athymic nude mice with OECM-1 xenografts (Figure 10A). The data revealed that there was no apparent body weight reduction throughout CoQ0 therapy, and all the animals were healthy (Figure 10A). The tumor volume was significantly increased after OECM-1 cell inoculation into control nude mice. However, CoQ0 (1.5 mg/kg) treatment decreased the tumor volume in nude mice in a time-dependent manner (Figure 10B). Additionally, OECM-1-xenografted tumors were removed and weighed from each sacrificed mouse at the end of the 28-day period. The tumor mass in CoQ0-treated nude mice was reduced and circumscribed in comparison to the control group (Figure 10C-E). Moreover, we did not observe any overt toxicity (body weight and microscopic inspection of vital organs) in CoQ0-treated mice. Together, these results showed that tumor development in mice with OECM-1 xenografts was effectively inhibited by CoQ0 treatment.
CoQ0 treatment inhibits OECM-1 xenograft tumors in vivo. Every two days for a total of 28 days, athymic nude mice were administered either 1.5 mg/kg CoQ0 or control (0.1% DMSO). (A-B) Tumor progression was assessed by evaluating body weight, which was measured twice every 7 days, and tumor volume, which was measured every 4 days. The animals were euthanized, and the tumor tissues were harvested and weighed on the 28th day after OECM-1 cell implantation. (C-D) Images showing tumor sizes before and after dissection. (E) Tumor weight (g/mouse) is shown in the histogram. Values are the mean ± SD (n=3). *p < 0.05; **p < 0.01; ***p < 0.001 compared with untreated animals.
Discussion
Phytochemicals and traditional medicines are being investigated to reduce the gap associated with currently available cancer treatments [43]. In this investigation, using noncytotoxic concentrations of CoQ0 (0-7.5 μM), the molecular mechanisms by which CoQ0 suppresses the NLRP3 inflammasome, metastasis/EMT, and the Warburg effect by inhibiting ROS-mediated HIF-1α expression in OECM-1 and SAS cells under normoxic and hypoxic conditions were elucidated. The tumor microenvironment, which is widely known to be a significant promoter of angiogenesis, features hypoxia as one of its primary properties. The hypoxic tumor microenvironment leads to HIF-1 activation via the assembly of the HIF-1α and HIF-1β subunits. Activated HIF-1 leads to angiogenesis and metabolic reprogramming in tumor cells. This study revealed more prominent HIF-1α expression in OECM-1 and SAS cells under hypoxia than under normoxia; however, treatment with CoQ0 inhibited HIF-1α expression under both normoxia and hypoxia (1% O2 or CoCl2). Previous studies have suggested pleiotropic effects of HIF-1α on several cellular and metabolic mechanisms that are related to tumorigenesis. Higher levels of HIF-1α expression are associated with the NLRP3 inflammasome, EMT/metastasis, and Warburg effect in tumor cells [31]. Our findings supported the hypothesis that CoQ0 suppressed HIF-1α expression, which therefore suppressed the NLRP3 inflammasome, EMT/metastasis, and Warburg effect in HNSCC cells under normoxia and hypoxia.
Inflammasomes constitute an assembly of protein complexes comprised of several proteins, including NLRP3, which recognize many diverse inflammation-inducing stimuli such as stress, acute injury, microbial infections, etc. By directly activating caspase-1, inflammasomes trigger the release of effective pro-inflammatory cytokines. A recent study showed that periodontal pathogens may contribute to HNSCC pathogenesis by causing chronic inflammation and increasing NLRP3/IL-1β expression due to inflammasome dysregulation [44]. Notably, periodontitis-associated bacteria may stimulate NLRP3 and enhance the progression and development of tumors in an in situ oral squamous cell carcinoma (OSCC) model in mice [45]. In a carcinogen-induced OSCC model, the intracellular ROS induced by 5-FU enhanced the NLRP3 inflammasome and IL-1β expression, which in turn mediated the onset of chemoresistance and tumor cell proliferation [46]. The downregulation of NLRP3 expression significantly decreased caspase-1 cleavage and IL-1β generation, whereas E-cadherin expression was enhanced in OSCC cells [47]. Another study showed that inhibition of the NLRP3 inflammasome hampered the invasiveness of HNSCC cells [48]. In addition, the instigation of the NLRP3 inflammasome by LPS and ATP upregulated cancer stem cell characteristics and induced sphere-forming and colony formation abilities [49]. In the head and neck squamous cell carcinoma, treatment with the NLRP3 inhibitor MCC950 decreased sphere and colony formation as well as cancer stem cell marker BMI1, ALDH1, and CD44 expression [49]. In an in vitro model employing OSCC cells and an in vivo xenograft model of oral cancer, an NLRP3 inflammasome inhibitor BAY-117082 significantly reduced NLRP3, ASC, caspase-1, IL-1β, and IL-18 expression and a reduction in tumor growth [50]. In this study, we confirmed that the inflammatory NLRP3, ASC/caspase-1, and IL-1β expression, and EMT/metastasis was inhibited by CoQ0 under normoxia and hypoxia.
The overwhelming production of ROS eventually results in increased HIF-1α stabilization and expression. Previous research investigations have demonstrated that a functional mitochondrial electron transport chain is necessary for hypoxia-induced ROS release, which is crucial for HIF-1α stability [51]. Following proline hydroxylation by prolyl hydroxylases, HIF-1α is damaged under normoxic conditions. Hypoxia prevents HIF-1α hydroxylation, which causes it to accumulate. Our findings revealed that CoQ0 and/or NAC treatment suppressed hypoxia-induced intracellular ROS generation in both OECM-1 and SAS cells. In addition, the current study also confirmed that pretreatment with CoQ0 and/or NAC inhibited hypoxia-induced HIF-1α expression in HNSCC cells. Our findings indicated that inhibition of hypoxia-induced ROS by CoQ0 strongly reduced HIF-1α expression, disrupting signaling related to the malignant growth of HNSCC cells. Our previous investigation showed that CoQ0 suppresses LPS-stimulated ROS-mediated inflammatory NFκB/AP-1 activation through antioxidant Nrf2 pathways in macrophages [17]. Furthermore, CoQ0 inhibits LPS/ATP-stimulated ROS-mediated NLRP3 inflammasome via mitophagy induction and Nrf2 activation in macrophages [52]. In addition, CoQ0 exerts anti-angiogenic effects via the inhibition of TNF-α-induced ROS-mediated NFκB activation and Nrf2 pathway activation in human endothelial cells [53]. These investigations, along with our results (CoQ0 inhibits hypoxia-stimulated ROS-mediated HIF-1α expression), revealed the pharmacological activity of CoQ0. Therefore, it has been proposed that CoQ0 inhibits hypoxia-induced ROS-mediated HIF-1α expression and thus attenuates the NLRP3-mediated inflammation, EMT/metastasis, and Warburg effect in HNSCC cells, which have been suggested as possible targets for cancer therapy.
In this investigation, CoQ0 served as a mediator that prevented NLRP3 inflammasome activation in OECM-1 and SAS cells. When the NLRP3 inflammasome is activated, the adaptor protein ASC colocalizes with Caspase-1. Caspase-1 is a cysteine protease that cleaves pro-IL-1β to generate IL-1β, which leads to proinflammatory effects. There are currently no approved drugs that can prevent NLRP3 inflammasome activation, despite the findings that neutralization of IL-1β has anti-inflammatory effects [54]. The data showed that CoQ0 suppresses the NLRP3 inflammasome via ASC, caspase-1, and IL-1β inhibition under normoxia and hypoxia in HNSCC cells.
The inhibition of hypoxia-induced HIF-1α suppresses the migration, invasion, and EMT of tumor cells [55]. E-cadherin is an adherence junction protein that is essential for maintaining cell integrity and cellular communication. However, the loss of E-cadherin is related to EMT, which is necessary for the development of cancer metastasis. Hence, reversing or preventing the loss of E-cadherin may help to inhibit EMT and metastasis. The expression of N-cadherin, which is a cell surface mesenchymal marker, is commonly increased in cancer cells, which provides a mechanism for transendothelial migration [35]. The study revealed that CoQ0 prevented migration and invasion and reversed EMT by upregulating E-cadherin and downregulating N-cadherin in OECM-1 and SAS cells under normoxia and hypoxia. Twist, which is an EMT modulator, is necessary for the development of HNSCC (OECM-1 and SAS) cells. In metastatic carcinomas, Twist is frequently overexpressed or its promoter is methylated. The mechanisms underlying EMT include activated Twist, which enhances N-cadherin and reduces E-cadherin expression. Twist expression is regulated by HIF-1α through a direct interaction with the hypoxia-response element in the proximal promoter [55]. HIF-1α and Twist coexpression are linked to HNSCC metastasis and indicate a poor prognosis in patients [56]. In many malignancies, EMT involves NFκB-mediated Snail expression, which promotes cell invasion and migration. Snail acts as a transcriptional repressor that directly inhibits E-cadherin expression [34]. Matrix metalloproteinases (MMPs), which are important for the degradation of the cellular basement membrane, are critical players in invasion and migration. Twist has been associated with MMP activation [57]. The data showed that CoQ0 inhibited EMT/metastasis by attenuating Twist, Snail, and MMP-9/-2 expression in OECM-1 and SAS cells under normoxia and hypoxia. In addition, HIF-1α knockdown exerted a combinatorial effect with CoQ0, which enhanced the inhibition of N-Cadherin, Snail, and MMP-9 expression under hypoxia, confirming the hypothesis that CoQ0 exerted anti-metastasis/EMT effects via HIF-1α inhibition in HNSCC cells.
Next, we investigated whether CoQ0 modulated metabolic reprogramming and the Warburg effect in HNSCC cells. HIF-1α activation regulates critical enzymes that are associated with aerobic glycolysis, which alternately feed into the Warburg effect [58]. We found that CoQ0 decreased glucose absorption and L-lactate accumulation in OECM-1 cells. An increase in glucose absorption and a preference for lactate accumulation in the presence of oxygen are indications of the Warburg effect [36]. Lactate, which is one of the products of aerobic glycolysis, can alter the cancer microenvironment and impact tumor progression [36]. The data confirmed that CoQ0 suppressed glucose uptake, lactate accumulation, GLUT1 expression, and the HIF-1α-regulated expression of glycolysis-related genes (HK-2, PFK-1, and LDH-A) in OECM-1 and SAS cells. Moreover, HIF-1α knockdown exerted a combinatorial effect with CoQ0, enhancing the inhibition of GLUT1 and HK-2 expression under hypoxic conditions, confirming the hypothesis that CoQ0 promoted metabolic reprogramming via HIF-1α inhibition in HNSCC cells. It is generally recognized that the Warburg effect is characterized by the dominance of aerobic glycolysis over mitochondrial oxidative phosphorylation. This study discovered that CoQ0 diminished the ECAR as well as the glycolytic capacity, glycolytic reserve, and glycolysis under normoxia and hypoxia (CoCl2) in OECM-1 cells. CoCl2 artificially induces hypoxia, leading to the stabilization of HIF-1α. LC-ESI-MS metabolomic analysis revealed that CoQ0 attenuated the Warburg effect and decreased the levels of the glycolytic intermediates lactate, 2/3-PG, FBP, PEP, and pyruvate. CoQ0, on the other hand, led to an increase in the OCR, ATP production, maximal respiration, basal respiration, and spare capacity in OECM-1 cells under normoxic and hypoxic conditions (CoCl2). After CoQ0 treatment, the levels of the TCA cycle intermediate isocitrate, citrate, α-ketoglutarate, and oxaloacetate were markedly enhanced. The increased levels of these TCA cycle metabolites are consistent with improvements in the Warburg effect. Our findings confirmed that CoQ0 altered the Warburg effect (improved mitochondrial oxidative phosphorylation and suppressed aerobic glycolysis) via HIF-1α inhibition under normoxia and hypoxia in HNSCC cells.
The sensor of hypoxia HIF-1α also regulates the characteristics of cancer stem cells, including their ability to undergo EMT, differentiation, and self-renewal. CD24low and CD44high expression are commonly associated with cancer stem cells [41]. Our findings showed that CoQ0 upregulated CD24 expression and downregulated CD44 expression in a concentration-dependent manner, shifting the CD24/CD44 ratio in favor of suppressing the cancer stem-like properties of OECM-1 and SAS cells under normoxia and hypoxia. Similarly, CoQ0 reduced ALDH1 and OCT4 expression in OECM-1 and SAS cells. ALDH1 and OCT4 are markers of cancer stem cells that participate in the differentiation and self-renewal of tumor cells [59, 60]. Our data demonstrated that CoQ0 treatment decreased ALDH1, and OCT4 prevented the EMT, differentiation, and self-renewal in OECM-1 and SAS cells under normoxia and hypoxia.
A recent study revealed that IL-6 causes EMT in carcinoma cells [61]. EMT is a key factor in the pathophysiology of fibrosis, and Collagen I is a key pathogenic factor in fibrosis [62]. The pathological progression of EMT is decisively influenced by the presence of a persistent inflammatory microenvironment [42]. TGF-β is a key modulator of fibrogenesis, regulates fibroblast phenotype and activity, induces myofibroblast transdifferentiation, and promotes matrix preservation [63]. TGF-β is increased and activated in fibrotic disorders and is frequently associated with chronic inflammatory diseases, leading to compromised functions of vital organs. Our results confirmed that CoQ0 attenuated fibrosis (TGF-β and Collagen I) by inhibiting migration and EMT (increased E-cadherin and decreased Slug) in IL-6-treated SG cells.
The in vivo anticancer efficacy of CoQ0 (1.5 mg/kg) was confirmed using OECM-1 xenograft-bearing nude mice. In response to CoQ0, both tumor size and weight were dramatically decreased. In addition, body weight measurements and histological analysis of important organs were used in this investigation to determine the in vivo toxicity of CoQ0. No overt signs of harmful effects were found. The in vivo study data showed that CoQ0 therapy was efficient in preventing the onset of tumors and slowing tumor growth in OECM-1 xenograft-bearing mice.
This investigation found that noncytotoxic CoQ0 inhibited ROS (H2O2)-mediated HIF-1α expression in HNSCC (OECM-1 and SAS) cells. NLRP3 inflammation, metastasis (invasion or migration), and EMT were considerably reduced by CoQ0 treatment. Furthermore, CoQ0 decreased the Warburg effect by reducing aerobic glycolysis and enhancing mitochondrial oxidative phosphorylation in OECM-1 cells. Our study showed that the suppression of HIF-1α by CoQ0 played a pivotal role in the inhibition of the NLRP3 inflammasome, EMT/metastasis, and Warburg effect in HNSCC cells under both normoxia and hypoxia. CoQ0 attenuated fibrosis by inhibiting TGF-β and Collagen I production in IL-6-treated SG cells. Moreover, the anticancer efficacy of CoQ0 was confirmed in vivo due to the decreased tumor growth and size in OECM-1 xenograft-bearing athymic nude mice. The current investigation highlighted the therapeutic significance of CoQ0 in HNSCC cells and warrants further preclinical and clinical investigations to ascertain the benefits of CoQ0 treatment for head and neck squamous cell carcinoma patients.
Acknowledgements
This study was supported by the National Science and Technology Council, Asia University, and China Medical University, Taiwan (grants NSTC-109-2320-B-039-057-MY3, MOST-110-2320-B-039-046-MY3, and CMU112-ASIA-09). This work was financially supported by the “Chinese Medicine Research Center, China Medical University” from The Featured Areas Research Center Program within the framework of the Higher Education Sprout Project by the Ministry of Education (MOE) in Taiwan (CMRC-CHM-1).
Author contributions
Conceived and designed the experiments: HLY and YCH conceived the idea. CWC, SJC, and JHH, performed the experiments. CWC, SP, CCL, and JHH, analyzed the data. CV, SP, HLY, and YCH, wrote and revised the manuscript. All authors read and approved the final manuscript.
Competing Interests
The authors have declared that no competing interest exists.
References
1. Fialová A, Koucký V, Hajdušková M, Hladíková K. Špíšek R. Immunological network in head and neck squamous cell carcinoma—a prognostic tool beyond HPV status. Frontiers in oncology. 2020 10, 1701
2. Cimmino F, Avitabile M, Lasorsa VA, Montella A, Pezone L, Cantalupo S. et al. HIF-1 transcription activity: HIF1A driven response in normoxia and in hypoxia. BMC medical genetics. 2019;20:1-15
3. McCabe A, Martin S, Rowe S, Shah J, Morgan PS, Borys D. et al. Oxygen-enhanced MRI assessment of tumour hypoxia in head and neck cancer is feasible and well tolerated in the clinical setting. Eur Radiol Exp. 2024;8:27
4. Chen YR, Yeh HC, Chiu FY, Wu HE, Fang HC. Li CY. The role of HIF-1α in regulating NLRP3 inflammasome activation in bladder cancer. 2020;38:e17028-e17028
5. Huang Y, Xu W. Zhou R. NLRP3 inflammasome activation and cell death. Cellular & Molecular Immunology. 2021;18:2114-2127
6. Chen L, Huang CF, Li YC, Deng WW, Mao L, Wu L. et al. Blockage of the NLRP3 inflammasome by MCC950 improves anti-tumor immune responses in head and neck squamous cell carcinoma. Cellular and Molecular Life Sciences. 2018;75:2045-2058
7. Kisoda S, Mouri Y, Kitamura N, Yamamoto T, Miyoshi K. Kudo Y. The role of partial-EMT in the progression of head and neck squamous cell carcinoma. J Oral Biosci. 2022;64:176-182
8. van der Heijden M, Essers PB, Verhagen CV, Willems SM, Sanders J, de Roest RH. et al. Epithelial-to-mesenchymal transition is a prognostic marker for patient outcome in advanced stage HNSCC patients treated with chemoradiotherapy. Radiotherapy and Oncology. 2020;147:186-194
9. Kappler M, Pabst U, Weinholdt C, Taubert H, Rot S, Kaune T. et al. Causes and consequences of a glutamine induced normoxic HIF1 activity for the tumor metabolism. International journal of molecular sciences. 2019;20:4742
10. Liu C, Jin Y. Fan Z. The Mechanism of Warburg Effect-Induced Chemoresistance in Cancer. Front Oncol. 2021;11:698023
11. Zhao H, Shi C, Han W, Luo G, Huang Y, Fu Y. et al. Advanced progress of spatial metabolomics in head and neck cancer research. Neoplasia. 2024;47:100958
12. Blatt S, Voelxen N, Sagheb K, Pabst AM, Walenta S, Schroeder T. et al. Lactate as a predictive marker for tumor recurrence in patients with head and neck squamous cell carcinoma (HNSCC) post radiation: a prospective study over 15 years. Clin Oral Investig. 2016;20:2097-2104
13. Geethangili M. Tzeng YM. Review of Pharmacological Effects of Antrodia camphorata and Its Bioactive Compounds. Evid Based Complement Alternat Med. 2011;2011:212641
14. Hseu YC, Huang HC. Hsiang CY. Antrodia camphorata suppresses lipopolysaccharide-induced nuclear factor-κB activation in transgenic mice evaluated by bioluminescence imaging. Food and Chemical Toxicology. 2010;48:2319-2325
15. Armstrong JS, Whiteman M, Rose P. Jones DP. The coenzyme Q10 analog decylubiquinone inhibits the redox-activated mitochondrial permeability transition: Role of mitochondrial respiratory complex III. Journal of Biological Chemistry. 2003;278:49079-49084
16. Suarez-Rivero JM, Pastor-Maldonado CJ, Povea-Cabello S, Alvarez-Cordoba M, Villalon-Garcia I, Munuera-Cabeza M. et al. Coenzyme Q(10) Analogues: Benefits and Challenges for Therapeutics. Antioxidants (Basel). 2021 10
17. Yang HL, Lin MW, Korivi M, Wu JJ, Liao CH, Chang CT. et al. Coenzyme Q0 regulates NF κB/AP-1 activation and enhances Nrf2 stabilization in attenuation of LPS-induced inflammation and redox imbalance: Evidence from in vitro and in vivo studies. Biochim Biophys Acta. 2016;1859:246-61
18. Chung CH, Yeh SC, Chen CJ. Lee KT. Coenzyme Q0 from Antrodia cinnamomea in Submerged Cultures Induces Reactive Oxygen Species-Mediated Apoptosis in A549 Human Lung Cancer Cells. Evid Based Complement Alternat Med. 2014;2014:246748
19. Hseu YC, Thiyagarajan V, Tsou HT, Lin KY, Chen HJ, Lin CM. et al. In vitro and in vivo anti-tumor activity of CoQ0 against melanoma cells: inhibition of metastasis and induction of cell-cycle arrest and apoptosis through modulation of Wnt/beta-catenin signaling pathways. Oncotarget. 2016;7:22409-26
20. Hseu YC, Tsai TJ, Korivi M, Liu JY, Chen HJ, Lin CM. et al. Antitumor properties of Coenzyme Q(0) against human ovarian carcinoma cells via induction of ROS-mediated apoptosis and cytoprotective autophagy. Sci Rep. 2017;7:8062
21. Yang HL, Lin PY, Vadivalagan C, Lin YA, Lin KY, Hseu YC. Coenzyme Q(0) defeats NLRP3-mediated inflammation, EMT/metastasis, and Warburg effects by inhibiting HIF-1α expression in human triple-negative breast cancer cells. Arch Toxicol. 2023;97:1047-1068
22. Yang HL, Lin YA, Pandey S, Liao JW, Way TD, Yeh YL. et al. In vitro and in vivo anti-tumor activity of Antrodia salmonea against twist-overexpressing HNSCC cells: Induction of ROS-mediated autophagic and apoptotic cell death. Food Chem Toxicol. 2023;172:113564
23. Hseu JH, Chan CI, Vadivalagan C, Chen SJ, Yen HR, Hseu YC. et al. Tranexamic acid improves psoriasis-like skin inflammation: Evidence from in vivo and in vitro studies. Biomed Pharmacother. 2023;166:115307
24. Yang HL, Lin CP, Vudhya Gowrisankar Y, Huang PJ, Chang WL, Shrestha S. et al. The anti-melanogenic effects of ellagic acid through induction of autophagy in melanocytes and suppression of UVA-activated α-MSH pathways via Nrf2 activation in keratinocytes. Biochem Pharmacol. 2021;185:114454
25. Liang CC, Park AY. Guan JL. In vitro scratch assay: a convenient and inexpensive method for analysis of cell migration in vitro. Nat Protoc. 2007;2:329-33
26. Yang HL, Chang YH, Pandey S, Bhat AA, Vadivalagan C, Lin KY. et al. Antrodia camphorata and coenzyme Q(0), a novel quinone derivative of Antrodia camphorata, impede HIF-1α and epithelial-mesenchymal transition/metastasis in human glioblastoma cells. Environ Toxicol. 2023;38:1548-1564
27. Jin J, Qiu S, Wang P, Liang X, Huang F, Wu H. et al. Cardamonin inhibits breast cancer growth by repressing HIF-1α-dependent metabolic reprogramming. Journal of Experimental & Clinical Cancer Research. 2019;38:1-16
28. Hseu JH, Lin YA, Pandey S, Vadivalagan C, Ali A, Chen SJ. et al. Antrodia salmonea suppresses epithelial-mesenchymal transition/metastasis and Warburg effects by inhibiting Twist and HIF-1κ expression in Twist-overexpressing head and neck squamous cell carcinoma cells. J Ethnopharmacol. 2023;318:117030
29. Baris MM, Serinan E, Calisir M, Simsek K, Aktas S, Yilmaz O. et al. Xenograft tumor volume measurement in nude mice: estimation of 3D ultrasound volume measurements based on manual caliper measurements. Journal of Basic and Clinical Health Sciences. 2020;4:90-95
30. Yang HL, Chiu LW, Lin YA, Pandey S, Vadivalagan C, Liao JW. et al. In vitro and in vivo anti-tumor activity of Coenzyme Q(0) against TWIST1-overexpressing HNSCC cells: ROS-mediated inhibition of EMT/metastasis and autophagy/apoptosis induction. Toxicol Appl Pharmacol. 2023;465:116453
31. Siddiqui FA, Prakasam G, Chattopadhyay S, Rehman AU, Padder RA, Ansari MA. et al. Curcumin decreases Warburg effect in cancer cells by down-regulating pyruvate kinase M2 via mTOR-HIF1α inhibition. Scientific reports. 2018;8:1-9
32. Hughes MM. O'Neill LA. Metabolic regulation of nlrp 3. Immunological reviews. 2018;281:88-98
33. Sisto M, Lorusso L, Ingravallo G, Tamma R, Ribatti D, Lisi S. The TGF-β1 signaling pathway as an attractive target in the fibrosis pathogenesis of Sjögren's syndrome. Mediators of inflammation. 2018. 2018
34. Wu Y, Deng J, Rychahou PG, Qiu S, Evers BM, Zhou BP. Stabilization of Snail by NF- κB Is Required for Inflammation-Induced Cell Migration and Invasion. Cancer Cell. 2009;15:416-428
35. Quiroz Reyes AG, Lozano Sepulveda SA, Martinez-Acuna N, Islas JF, Gonzalez PD, Heredia Torres TG. et al. Cancer Stem Cell and Hepatic Stellate Cells in Hepatocellular Carcinoma. Technol Cancer Res Treat. 2023;22:15330338231163677
36. Ganapathy-Kanniappan S. Molecular intricacies of aerobic glycolysis in cancer: current insights into the classic metabolic phenotype. Critical reviews in biochemistry and molecular biology. 2018;53:667-682
37. Hassanein M, Weidow B, Koehler E, Bakane N, Garbett S, Shyr Y. et al. Development of high-throughput quantitative assays for glucose uptake in cancer cell lines. Mol Imaging Biol. 2011;13:840-52
38. Nikonovas T, Spessa A, Doerr SH, Clay GD. Mezbahuddin S. Near-complete loss of fire-resistant primary tropical forest cover in Sumatra and Kalimantan. Communications Earth & Environment. 2020;1:1-8
39. TeSlaa T. Teitell MA. Techniques to monitor glycolysis. Methods Enzymol. 2014;542:91-114
40. Rana NK, Singh P. Koch B. CoCl2 simulated hypoxia induce cell proliferation and alter the expression pattern of hypoxia associated genes involved in angiogenesis and apoptosis. Biological research. 2019;52:1-13
41. Ghuwalewala S, Ghatak D, Das P, Dey S, Sarkar S, Alam N. et al. CD44highCD24low molecular signature determines the cancer stem cell and EMT phenotype in oral squamous cell carcinoma. Stem cell research. 2016;16:405-417
42. Sisto M, Ribatti D. Lisi S. Organ fibrosis and autoimmunity: The role of inflammation in TGFβ-dependent EMT. Biomolecules. 2021;11:310
43. Khan A, Siddiqui S, Husain SA, Mazurek S. Iqbal MA. Phytocompounds Targeting Metabolic Reprogramming in Cancer: An Assessment of Role, Mechanisms, Pathways, and Therapeutic Relevance. Journal of Agricultural and Food Chemistry. 2021;69:6897-6928
44. Aral K, Milward MR, Gupta D. Cooper PR. Effects of Porphyromonas gingivalis and Fusobacterium nucleatum on inflammasomes and their regulators in H400 cells. Mol Oral Microbiol. 2020;35:158-167
45. Yao Y, Shen X, Zhou M. Tang B. Periodontal Pathogens Promote Oral Squamous Cell Carcinoma by Regulating ATR and NLRP3 Inflammasome. Front Oncol. 2021;11:722797
46. Feng X, Luo Q, Zhang H, Wang H, Chen W, Meng G. et al. The role of NLRP3 inflammasome in 5-fluorouracil resistance of oral squamous cell carcinoma. J Exp Clin Cancer Res. 2017;36:81
47. Wang H, Luo Q, Feng X, Zhang R, Li J. Chen F. NLRP3 promotes tumor growth and metastasis in human oral squamous cell carcinoma. BMC Cancer. 2018;18:500
48. Bae JY, Lee SW, Shin YH, Lee JH, Jahng JW. Park K. P2X7 receptor and NLRP3 inflammasome activation in head and neck cancer. Oncotarget. 2017;8:48972-48982
49. Huang CF, Chen L, Li YC, Wu L, Yu GT, Zhang WF. et al. NLRP3 inflammasome activation promotes inflammation-induced carcinogenesis in head and neck squamous cell carcinoma. J Exp Clin Cancer Res. 2017;36:116
50. Scuderi SA, Casili G, Basilotta R, Lanza M, Filippone A, Raciti G. et al. NLRP3 Inflammasome Inhibitor BAY-117082 Reduces Oral Squamous Cell Carcinoma Progression. Int J Mol Sci. 2021 22
51. Guzy RD, Hoyos B, Robin E, Chen H, Liu L, Mansfield KD. et al. Mitochondrial complex III is required for hypoxia-induced ROS production and cellular oxygen sensing. Cell Metab. 2005;1:401-8
52. Hseu YC, Tseng YF, Pandey S, Shrestha S, Lin KY, Lin CW. et al. Coenzyme Q0 Inhibits NLRP3 Inflammasome Activation through Mitophagy Induction in LPS/ATP-Stimulated Macrophages. Oxidative medicine and cellular longevity. 2022. 2022
53. Yang HL, Korivi M, Lin MW, Chen SC, Chou CW. Hseu YC. Anti-angiogenic properties of coenzyme Q0 through downregulation of MMP-9/NF-κB and upregulation of HO-1 signaling in TNF-α-activated human endothelial cells. Biochem Pharmacol. 2015;98:144-56
54. Klück V, Tim L, Janssen M, Comarniceanu A, Efdé M, Tengesdal IW. et al. Dapansutrile, an oral selective NLRP3 inflammasome inhibitor, for treatment of gout flares: an open-label, dose-adaptive, proof-of-concept, phase 2a trial. The Lancet Rheumatology. 2020;2:e270-e280
55. Barriga EH, Maxwell PH, Reyes AE. Mayor R. The hypoxia factor Hif-1α controls neural crest chemotaxis and epithelial to mesenchymal transition. Journal of Cell Biology. 2013;201:759-776
56. Yang MH, Wu MZ, Chiou SH, Chen PM, Chang SY, Liu CJ. et al. Direct regulation of TWIST by HIF-1α promotes metastasis. Nature cell biology. 2008;10:295-305
57. Okamura H, Yoshida K. Haneji T. Negative regulation of TIMP1 is mediated by transcription factor TWIST1. International journal of oncology. 2009;35:181-186
58. An F, Chang W, Song J, Zhang J, Li Z, Gao P. et al. Reprogramming of glucose metabolism: Metabolic alterations in the progression of osteosarcoma. J Bone Oncol. 2024;44:100521
59. Tomita H, Tanaka K, Tanaka T. Hara A. Aldehyde dehydrogenase 1A1 in stem cells and cancer. Oncotarget. 2016;7:11018-32
60. Walcher L, Kistenmacher AK, Suo H, Kitte R, Dluczek S, Strauss A. et al. Cancer Stem Cells-Origins and Biomarkers: Perspectives for Targeted Personalized Therapies. Front Immunol. 2020;11:1280
61. Gyamfi J, Lee YH, Eom M. Choi J. Interleukin-6/STAT3 signalling regulates adipocyte induced epithelial-mesenchymal transition in breast cancer cells. Scientific reports. 2018;8:1-13
62. Li Y, Zhao J, Yin Y, Li K, Zhang C. Zheng Y. The role of il-6 in fibrotic diseases: Molecular and cellular mechanisms. International Journal of Biological Sciences. 2022;18:5405-5414
63. Hosokawa H, Romero-Wolf M, Yang Q, Motomura Y, Levanon D, Groner Y. et al. Cell type-specific actions of Bcl11b in early T-lineage and group 2 innate lymphoid cells. Journal of Experimental Medicine. 2020 217
Author contact
![]() Corresponding authors: Dr. You-Cheng Hseu, Professor, Department of Cosmeceutics, College of Pharmacy, China Medical University, Shui-Nan Campus, No. 100, Sec. 1, Jingmao Road, Taichung 406040, Taiwan. Phone: +886-4 22053366-7503; Fax: +886-4 2207 8083; E-mail address: ychseucmu.edu.tw. Dr. Jhih-Hsuan Hseu, Department of Dermatology, Chang Gung Memorial Hospital, No. 123, Dapi Road, Niaosong District, Kaohsiung 83301, Taiwan. Tel.: 886-4-2205-3366 ext 7503; Fax: 886-4-22062891; E-mail: shirleyshirley19970311com.
Corresponding authors: Dr. You-Cheng Hseu, Professor, Department of Cosmeceutics, College of Pharmacy, China Medical University, Shui-Nan Campus, No. 100, Sec. 1, Jingmao Road, Taichung 406040, Taiwan. Phone: +886-4 22053366-7503; Fax: +886-4 2207 8083; E-mail address: ychseucmu.edu.tw. Dr. Jhih-Hsuan Hseu, Department of Dermatology, Chang Gung Memorial Hospital, No. 123, Dapi Road, Niaosong District, Kaohsiung 83301, Taiwan. Tel.: 886-4-2205-3366 ext 7503; Fax: 886-4-22062891; E-mail: shirleyshirley19970311com.