Impact Factor ISSN: 1449-2288

 Global reach, higher impact
Int J Biol Sci 2025; 21(10):4450-4466. doi:10.7150/ijbs.112824 This issue Cite
Research Paper
Nanog overexpression enhances the therapeutic efficacy of ADMSCs in AMI rats via the upregulation of JAK/STAT3 signaling and cyclin-mitochondrial expression
Hsu-Ting Yen1,2#, David Kwan Ru Huang1#, Xian-Wu Lan3, Jui-Ning Yeh3,4, Yi-Ling Chen5,6, Chi-Ruei Huang6,7, Yi-Ting Wang5,6, Hon-Kan Yip5,6,7,8,9* ![]() , Pei-Hsun Sung5,6,7*
, Pei-Hsun Sung5,6,7* ![]() , Sheung-Fat Ko10*
, Sheung-Fat Ko10* ![]()
1. Division of Thoracic and Cardiovascular Surgery, Department of Surgery, Kaohsiung Chang Gung Memorial Hospital and Chang Gung University College of Medicine, Kaohsiung 833401, Taiwan.
2. Kaohsiung Municipal Fong-Shan Hospital, Kaohsiung 830025, Taiwan.
3. Department of Cardiology, the First Hospital of Jinan University, GuangZhou 510630, China.
4. Institute of Nephrology and Blood Purification, the First Affiliated Hospital of Jinan University, Jinan University, Guangzhou 510632, China.
5. Division of Cardiology, Department of Internal Medicine, Kaohsiung Chang Gung Memorial Hospital and Chang Gung University College of Medicine, Kaohsiung 833401, Taiwan.
6. Institute for Translational Research in Biomedicine, Kaohsiung Chang Gung Memorial Hospital, Kaohsiung 833401, Taiwan.
7. Center for Shockwave Medicine and Tissue Engineering, Kaohsiung Chang Gung Memorial Hospital, Kaohsiung 833401, Taiwan.
8. Department of Medical Research, China Medical University Hospital, China Medical University, Taichung 404333, Taiwan.
9. School of Medicine, College of Medicine, Chang Gung University, Taoyuan 333323, Taiwan.
10. Department of Radiology, Kaohsiung Chang Gung Memorial Hospital and Chang Gung University College of Medicine, Kaohsiung 833401, Taiwan.
#: equal contribution
*: equal contribution
Received 2025-2-25; Accepted 2025-6-16; Published 2025-7-4
Abstract

Background: This study investigated whether Nanog-overexpressing adipose-derived mesenchymal stem cells (NanogOE-ADMSCs) are superior to unmodified ADMSCs in improving the left ventricular ejection fraction (LEVF) in acute myocardial infarction (AMI) patients.
Methods: We utilized silencing and overexpression of Nanog gene in ADMSCs and performed a wound healing assay/transwell migration assay/MTT cell viability assay/left coronary artery ligation for AMI induction. Additionally, we categorized the cells into three classes [i.e., (ADMSCs and NanogOE-ADMSCs); A1 (ADMSCs)/A2 (ADMSCs + CoCl2)/A3 (NanogOE-ADMSCs + CoCl2)/A4 (siRNA-Nanog-ADMSCs) + CoCl2); B1 (ADMSCs)/B2 (ADMSCs + H2O2)/B3 (NanogOE-ADMSCs + H2O2)/B4 (siRNA-Nanog gene in ADMSCs + H2O2)], and the rats (n=50) were evenly divided into Groups 1 (sham-operated control)/2 (AMI)/3 (AMI+ADMSCs)/4 (AMI+NanogOE-ADMSCs)/5 (AMI+siRNA-Nanog-ADMSCs). The hearts were harvested on Day 35.
Results: In vitro experiments revealed significantly higher ATP, relative mitochondrial DNA/Nonog gene expression, mitochondrial cytochrome C+ cell, angiogenesis and exosome-specific marker (Alix/CD81/CD63/CD9) levels in NanogOE-ADMSCs than in ADMSCs. The cell viability, wound healing, and migration were highest in A1, lowest in A4, and significantly greater in A3 than in A2, whereas early/late apoptosis and intracellular and mitochondrial ROS displayed the opposite pattern of cell viability among the groups (all P<0.001). Additionally, the proteins expressions of phosphorylation (p) of the PI3K/Akt/mTOR, p-JAK2/p-STAT3, and Ras/Raf/MEK1/2/ERK1/2 signaling pathways were highest in A3, lowest in A4 and significantly greater in A1 than in A2 (all P<0.001). The levels of cell cycle proteins and mitochondrial electron transport train (ETC) complex I/II/III/IV components exhibited identical patterns as PI3K/Akt/mTOR among the groups B1 to B4 (all P<0.001). On Day 35, the LVEF was highest in Group 1, lowest in Group 2, significantly greater in Group 4 than in Groups 3 and 5, and significantly greater in Group 3 than in Group 5, with the opposite pattern for the LV remodeling index, infarct and fibrosis areas, and LV chamber size (all P < 0.0001). The p-AK/p-STAT3, p-PI3K/p-Akt/p-mTOR, and Ras/Raf/MEK1/2/ERK1/2 protein levels displayed the same pattern as the LVEF among the groups (all P < 0.001).
Conclusion: NanogOE-ADMSCs rescued LVEF by upregulating JAK/STAT3-mediated cell proliferation/cell stress pathways and accelerating the cell cycle.
Keywords: acute myocardial infarction, Nanog gene overexpression in adipose-derived mesenchymal stem cells, cell stress signaling
Introduction
The short-term and long-term mortality of acute myocardial infarction (AMI) is linearly correlated with the infarct area and myocardial loss [1]. For patients suffering from heart failure (HF) with a left ventricular ejection fraction (LVEF) <40% following AMI, the estimated 30-day mortality is greater than 40% [1]. Furthermore, mortality is even higher than 70% for victims who develop cardiogenic shock in the context of AMI, regardless of the degree of hemodynamic support [1]. A core concept in the survival chain of AMI is “time is muscle” [2], meaning that survival following AMI depends on how quickly the patient arrives to the emergency department and how much myocardium is preserved by reperfusion therapy [3]. Nevertheless, despite the widely-used catheterization management methods and antithrombotic and cardioprotective treatments, effective therapies aimed at the recovery of damaged cardiomyocytes are lacking [4].
Increasing evidence has shown that mesenchymal stem cells (MSCs) have anti-inflammatory, immunomodulatory, and regenerative functions [5]. MSCs also undergo angiogenesis and neovascularization after they differentiate into endothelial lineage cells [6], resulting in the restoration of blood flow in the ischemic zone, improvement of left ventricular (LV) function, alleviation of LV remodeling, and a reduction in recurrent hospitalization for heart failure [7]. However, the occurrence of myocardial necrosis in the occluded vascular territory accompanied by excessive hypoxia and oxidative stress consistently leads to detrimental effects on the age and senescence of MSCs, consequently resulting in dysfunction of the implanted or infused stem cells [8]. Furthermore, increased reactive oxygen species (ROS) inhibit MSCs proliferation, increase senescence, reduce osteogenic differentiation, and inhibit immunomodulatory function [9]. These conflicting effects could partially explain why the results from blinded clinical trials of cell therapy for AMI are inconsistent and why the relevant benefits are inconclusive [10]. Thus, identifying a method to increase implanted cell function to salvage the injured myocardium is highly important.
Our previous experimental studies demonstrated that the utilization of cell therapy with epigenetic modification effectively protects vital organs against functional/structural damage from AMI, dilated cardiomyopathy and acute kidney ischemia‒reperfusion injury [11-13]. The therapeutic mechanisms involved in organ protection [11-13] include immunomodulation, reducing oxidative stress, alleviating DNA and mitochondrial damage, inhibiting upstream and downstream inflammatory signaling pathways, decreasing apoptosis and fibrosis, preserving organ architecture, and improving organ functions. On the basis of the results of these experiments in epigenetically and genetically modified cytotherapy, we hypothesized that cell may be possible to increase the efficacy of stem cell therapy in the context of myocardial infarction.
Nanog is a primitive/pluripotent stem cell marker and is considered a crucial regeneration factor during tissue repair [14]. After AMI, Nanog is positively expressed at both the mRNA and protein levels in myocardial cells, fibroblasts and small round cells in different myocardial zones at different stages [14]. All cardiomyocytes, fibroblasts and small round cells are involved in myocardial reconstruction following AMI. Nanog-positive cardiomyocytes may be responsible for early myocardial repair [14]. Similarly, Nanog-positive fibroblasts and small round cells are the main sources for myocardial reconstruction. Taken together, Nanog expression in heart tissues following AMI demonstrates spatiotemporal and dynamic changes in tissue repair and cardiac regeneration, especially in the infarct zone [15]. Accordingly, we have sufficient evidence to believe that Nanog overexpression in MSCs used to treat the infarcted/peri-infarcted myocardium not only enhances implanted cell function but also accelerates cardiac regeneration in the context of AMI. On the basis of these findings, Nanog gene overexpression in adipose-derived mesenchymal stem cells (NanogOE-ADMSCs therapy may be better than ADMSCs therapy alone for improving heart function in rodents after AMI.
Materials and Methods
Ethical approval
All animal procedures were approved by the Institute of Animal Care and Use Committee at Kaohsiung Chang Gung Memorial Hospital (Affidavit of Approval of Animal Use Protocol No. 2022090101) and performed in accordance with the Guide for the Care and Use of Laboratory Animals. This work has been reported in accordance with the ARRIVE guidelines (Animals in Research: Reporting In vivo Experiments) [16].
The animals were housed in an Association for Assessment and Accreditation of Laboratory Animal Care International (AAALAC; Frederick, MD, USA)-approved animal facility in our hospital with a controlled temperature and light cycle (24 °C and 12/12 light cycle).
Isolation of allogenous ADMSCs
To obtain adequate numbers of ADMSCs for individual studies, an additional twelve SD rats were utilized. Briefly, adipose tissues around the epididymis and abdomen were harvested meticulously as we have previously described [17, 18]. After 14 days of culture, approximately 2.5-3.5 × 10⁶ ADMSCs were obtained from each rat.
Hypoxia induction by cobalt chloride (CoCl2)
The procedure and protocol used to induce hypoxia were described in our previous report [19], and CoCl2 was obtained from Sigma‒Aldrich. Briefly, ADMSCs treated with or without CoCl2 (0 or 200 μM) as a hypoxic stimulus for 48 h in DMEM were collected for experiments.
Transfection of ADMSCs with plasmids for Nanog gene overexpression
The procedure and protocol for this transfection have been previously described in our recent study [20]. Briefly, the NANOG expression vector (pcDNA3.1-NANOG) was purchased from Genomics, Inc. (New Taipei City, Taiwan). Plasmid transfection was performed using Lipofectamine 3000 according to the manufacturer's instructions. First, 15 µg of the Nanog expression vector and 30 µl of Lipofectamine 3000 were incubated at room temperature for 15 minutes, followed by overnight incubation at 37 °C in a humidified atmosphere of 5% CO2 and Lipofectamine. Additional experiments were subsequently performed.
Procedure and protocol for siRNA Nanog gene-transfected ADMSCs
siRNA-Nanog was purchased from Ambion, Inc. The siRNA 1 sequences were as follows: sense, 5'-CCCUGAUUCUUCUAGCAAUTT-3', and antisense, 5'-AUUGCUAGAAGAAUCAGGGCT-3'. The siRNA 2 sequences were as follows: sense, 5'-GAACGCGUCUGGAAACCUUTT-3', and antisense, 5'-AAGGUUUCCAGACGCGUUCAT-3'. Transient transfection of cells with the siRNA mixture (siRNA1+siRNA2) was conducted with Lipofectamine™ RNAiMAX Transfection Reagent (Invitrogen, Life Technologies, Carlsbad, CA, USA) according to the manufacturer's instructions with slight modifications. The cells were replated 24 h before transfection at a density of 1 × 10⁶ cells in 7 ml of fresh culture medium in a 10-cm plastic dish. The next day, the cells were incubated with 100 pmol of the indicated siRNA at room temperature for 15 minutes with Lipofectamine™ RNAiMAX Transfection Reagent. The cells were incubated with the siRNA/liposome complex at 37 °C in a humidified atmosphere of 5% CO2 before being harvested. Western blotting and RT‒PCR were performed to verify the efficiency of gene silencing.
MTT cell viability assay
The procedure and protocol for this assay have been described in our previous report [21]. Briefly, cell proliferation/growth was determined by the MTT assay. Approximately 2 × 10³ cells in 100 µL of medium were seeded into the wells of a 96-well plate and incubated for the indicated duration. At the end of the incubation, MTT solution was added to each well, and the purple crystalline sediment was dissolved in DMSO. The absorbance was read at 540 nm using an ELISA reader. The absorbance value was used to represent the cell number indicating cell viability.
Wound healing assay
The procedure and protocol for this assay have been described in our previous report [21]. Briefly, for the wound healing assay, 3.5 × 10⁴ cells were seeded in 12 wells with linear spacer inserts. Following overnight cell culture, a regular and defined “wound” within the cell monolayer was created by removing the linear spacer inserts. After washing with phosphate-buffered saline, the wells were either left untreated or treated with or without Mel (100.0 μM) or cisplatin (6.0 µM). After a 24-h incubation, the migration of the cells into the denuded areas in the marked region was monitored. Migration was captured with microphotography, and the total migration distance was determined using ImageJ software (National Institutes of Health, Bethesda, MD, USA).
Transwell migration assay for assessment of ADMSCs migratory capacity
The procedure and protocol for this assay have been described in our previous report [21]. Briefly, the cells were first trypsinized, and then 3.5 × 10⁴ cells were added to the Boyden chambers (8 μm pore size; Millipore, Billerica, MA, USA) with 0.5% FBS-containing medium, and assay media containing 10% FBS was added to the culture plates. After 24 h of incubation, the nonmotile ADMSCs/NanogOE-ADMSCs located at the top of the filter were removed, and the motile cells at the bottom of the filter were fixed with methanol and stained with a one-tenth dilution of Giemsa (Sigma Corporation, Cream Ridge, NJ, USA). The number of migrated cells in each chamber was carefully counted in five randomly chosen fields under a microscope for three independent experiments.
Animal model of acute myocardial infarction (AMI)
The AMI induction protocol was performed as described in our previous studies [22, 23]. In brief, all the rats were anesthetized, and the heart of each rat was exposed via a left thoracotomy. Sham-operated rats (SCs) underwent thoracotomy only, whereas AMI was induced in the other groups via left coronary artery (LCA) ligation. After the procedure, the thoracotomy wound was closed, and all the rats recovered from anesthesia.
The animals (n = 50) were equally categorized into Group 1 [sham-operated control (SC)], Group 2 [AMI (i.e., induction by left coronary artery (LCA) ligation], Group 3 [AMI + allogenic ADMSCs (6.0 × 10⁵ cells intramyocardial injection + 1.2 × 10⁶ cells by intravenous administration 3 h after AMI induction)], Group 4 [AMI + NanogOE-ADMSCs (6.0 × 10⁵ cells intramyocardial injection + 1.2 × 10⁶ cells by intravenous administration 3 h after AMI induction)] and Group 5 [AMI + siRNA-Nanog-ADMSCs (6.0 × 10⁵ cells intramyocardial injection + 1.2 × 10⁶ cells by intravenous administration 3 h after AMI induction)]. The dose and the route of administration of ADMSCs in the present study were based on our previous report with some modification [24].
Euthanasia of animals
On Day 35 after AMI induction, the animals in each group were euthanized. Specifically, the animals were euthanized under anesthesia with 2.0% isoflurane inhalation at a steady respiratory rate, after which more than 10 ml of blood was exsanguinated by a needle puncture into the LV chamber to draw the cardiac blood to achieve euthanasia. This procedure usually requires five minutes (i.e., 2.0% isoflurane inhalation was maintained for five minutes). The heart of each animal was harvested after respiratory arrest for use in subsequent experiments.
Functional assessment by echocardiography
The protocol for transthoracic echocardiography was conducted on the basis of our previous studies [22, 23]. In each experimental group, transthoracic echocardiography was performed using a Vevo 2100 (Visualsonics, Toronto, Ontario, Canada) prior to AMI induction and at Days 14 and 35 after AMI induction. M-mode standard two-dimensional (2D) left parasternal long-axis echocardiographic examination was conducted. Left ventricular internal dimensions, including the left ventricular end-systolic diameter (LVESd) and left ventricular end-diastolic diameter (LVEDd), were measured at the mitral valve and papillary levels of the left ventricle during at least three consecutive cardiac cycles. The left ventricular ejection fraction (LVEF) was evaluated as follows: LVEF (%) = [(LVEDd3-LVESd3)/LVEDd3] × 100%. Transthoracic echography was performed on Day 0 prior to and on Days 14 and 35 after AMI induction before the animals were euthanized.
Western blot analysis
The protocol for this analysis has been described in our previous and recent reports [18, 20-22]. Briefly, equal amounts (30 µg) of protein extracts from heart tissues were separated via 8-12% SDS‒PAGE. After electrophoresis, the separated proteins were transferred onto a polyvinylidene difluoride (PVDF) membrane (Amersham Biosciences, Amersham, UK). Nonspecific sites were blocked by incubation of the membrane in blocking buffer [5% nonfat dry milk in T-TBS (TBS containing 0.05% Tween 20)] at room temperature for one hour. The membranes were subsequently incubated with the indicated primary antibodies [phosphorylated (p)-Akt (1:1,000, Cell Signaling), Akt (1:1,000, Cell Signaling), p-mTOR (1:3,000, Abcam), mTOR (1:3,000, Abcam), p-PI3K (1:1,000, Cell Signaling), PI3K (1:1,000, Cell Signaling), NOX1 (1:1,000, Sigma), NOX2 (1:1,000, Sigma), p-JAK2 (1:3,000, Abcam), p-STAT3 (1:3,000, Abcam), cleaved caspase3 (1:1,000, Cell Signaling), cleaved caspase 9 (1:1,000, Abcam), RAS (1:1,000, Cell Signaling), RAF (1:1,000, Cell Signaling), p-MEK (1:1,000, Cell Signaling), p-ERK (1:3,000 Millipore), OXPHOX (mitochondria complexes) (1:5,000, Abcam), cyclin D (1:3,000, Abcam), Cyclin E (1:3,000, Abcam), CDK2 (1:3,000, Abcam), CDK4 (1:3,000, Abcam), Alix (1:3,000, Abcam), CD81 (1:3,000, Arrigo), CD63 (1:3,000, Arrigo), CD9 (1:3,000, Arrigo), Nanog (1:1,000, Abcam), and actin (1:10,000, Merck)] for 1 hour at room temperature. Horseradish peroxidase-conjugated anti-rabbit or anti-mouse immunoglobulin IgG (1:2,000, Cell Signaling, Danvers, MA, USA) was used as a secondary antibody for one hour of incubation at room temperature. After being washed, the immunoreactive membranes were visualized using enhanced chemiluminescence (ECL; Amersham Biosciences, Amersham, UK) and exposed to medical X-ray film (FUJI).
Immunohistochemical (IHC) staining
This staining procedure has been described in our recent reports [18, 20-22]. Briefly, for IHC staining, rehydrated paraffin sections were first treated with 3% H2O2 for 30 minutes and then incubated with Immuno-Block reagent (BioSB, Santa Barbara, CA, USA) for 30 minutes at room temperature. Five sections of heart specimens from each rat were analyzed. For quantification, three randomly chosen HPFs (400x for the IHC study) were analyzed in each section.
Flow cytometric analysis for detecting apoptosis and ROS levels in cultured ADMSCs
The percentages of viable and apoptotic cells were determined using flow cytometry (Beckman Coulter Life Sciences) with double staining with annexin V and propidium iodide (PI). The early phase of apoptosis was defined as annexin V+/PI-, whereas the late phase of apoptosis was defined as annexin V+/PI+. Flow cytometric analyses for intracellular and mitochondrial reactive oxygen species (ROS) were conducted for total cellular ROS (i.e., by H2DCFDA assay) and mitochondrial ROS (i.e., by MitoSOX assay), respectively.
Statistical analysis
The quantitative data are expressed as the means ± SDs. Statistical analysis was performed by one-way ANOVA followed by the Bonferroni multiple comparison post hoc test. SAS statistical software for Windows version 8.2 (SAS Institute, Cary, NC, USA) was utilized. A probability value < 0.05 was considered statistically significant.
Results
NanogOE-ADMSCs promote ADMSCs proliferation in a hypoxic environment (Figure 1)
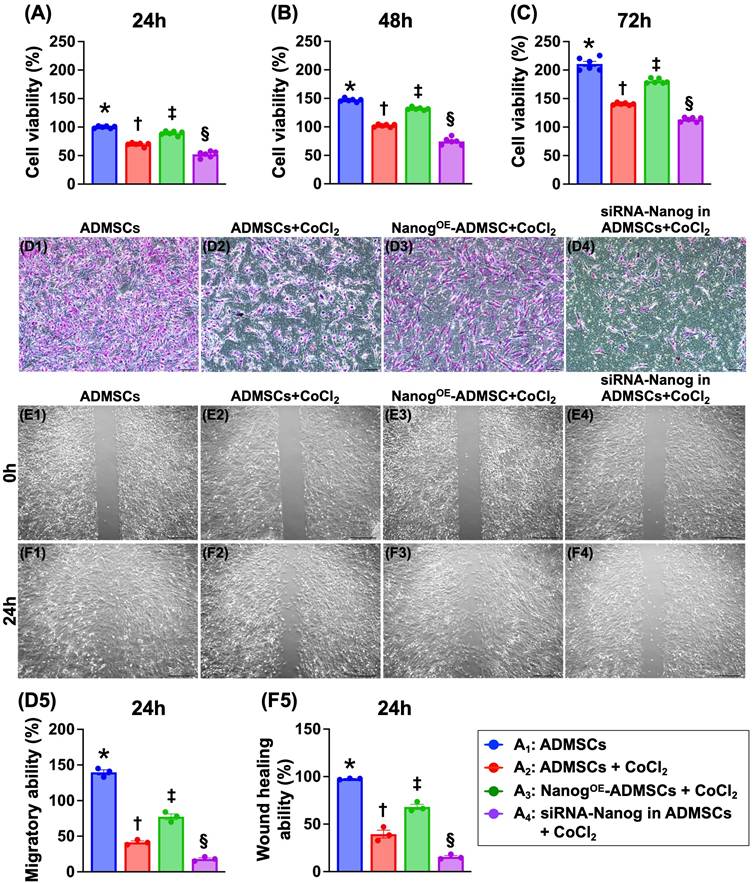
To address the ability of Nanog gene overexpression in ADMSCs (NanogOE-ADMSCs) to protect ADMSCs against hypoxia-induced damage, the cells were categorized as follows: A1 (ADMSCs only), A2 (ADMSCs + CoCl2), A3 (NanogOE-ADMSCs + CoCl2) and A4 (silencing the Nanog gene in ADMSCs (i.e., siRNA-Nanog-ADMSCs) + CoCl2]). The cells were collected after different time points of cell culture for analysis. The results demonstrated that the cell viability at 24, 48 and 72 h was highest in A1, lowest in A4, and significantly greater in A3 than in A2. Additionally, the migratory assay demonstrated that the cell migratory ability displayed an identical pattern as the cell viability among the groups. Furthermore, the wound healing ability also displayed a pattern identical to that of cell viability among the groups. Our findings indicate that NanogOE-ADMSCs were more favorable than ADMSCs for cell survival and proliferation under hypoxic conditions.
NanogOE-ADMSCs ensured the AMDMSCs survival in hypoxic environment. A) MTT assay for identification of cell viability at 24 h, * vs. other groups with different symbols (†, ‡, §), P<0.0001. B) MTT assay for identification of cell viability at 48 h, * vs. other groups with different symbols (†, ‡, §), P<0.0001. C) MTT assay for identification of cell viability at 48 h, * vs. other groups with different symbols (†, ‡, §), P<0.0001. D1 to D4) Illustrating the microscopic finding (100x) for identification of cell migratory ability (pink color). Scale bar in right lower corner represents 50µm. D5) Analytical result of cell migratory ability, * vs. other groups with different symbols (†, ‡, §), P<0.0001. E1 to E4) Illustrating the wound healing process at baseline. Analytical result, P>0.5. F1 to F4) Illustrating the wound healing process at 24 h. F5) Analytical result of wound healing ability, * vs. other groups with different symbols (†, ‡, §), P<0.0001. Note: * indicated the control group. All statistical analyses were performed by one-way ANOVA, followed by Bonferroni multiple comparison post hoc test (n=3-6) for each group). Symbols (*, †, ‡, §) indicate significance (at 0.05 level). Cell grouping: A1 = ADMSCs, A2 = ADMSCs + CoCl2, A3 = NanogOE-ADMSCs + CoCl2, A4 = siRNA-Nanog in ADMSCs + CoCl2. ADMSCs = adipose-derived mesenchymal stem cells; NanogOE = overexpression of Nanog gene. CoCl2 serviced as a hypoxia condition.
NanogOE in ADMSCs suppresses cell apoptosis and ROS production in a hypoxic environment (Figure 2)
To address whether NanogOE-ADMSCs are better able to mitigate the effects of hypoxia than ADMSCs, ADMSCs and NanogOE-ADMSCs were utilized and categorized into A1 to A4, as shown in Figure 1. Flow cytometric analysis revealed that early and late apoptosis and intracellular and mitochondrial ROS levels were highest in A4, lowest in A1 and significantly lower in A3 than in A2. These findings demonstrate that NanogOE-ADMSCs ensure cell survival in hypoxic environments.
Impact of NanogOE in ADMSCs ensured cell survival in hypoxia environments. A1 to A4) Illustrating the flow cytometric analysis for identification of early (V+/PI-) and late (V+/PI+) apoptosis. A5) Analytical result of early apoptosis, * vs. other groups with different symbols (†, ‡, §), P<0.0001. A6) Analytical result of late apoptosis, * vs. other groups with different symbols (†, ‡, §), P<0.0001. B1 to B4) Illustrating the flow cytometric analysis for identification of total intracellualr reactive oxygen species (ROS) (i.e., by H2DCFDA dye stain). B5) Analytical result of the total intracellular ROS, * vs. other groups with different symbols (†, ‡), P<0.001. C1 to C4) Showing the flow cytometric analysis for identification of mitochondrial ROS (by mitoSOX dye stain). C5) Analytical result of mitochondrial ROS by 72h, * vs. other groups with different symbols (†, ‡), P<0.001. Note: * indicated the control group. D) Protein level of Nanog, * vs. other groups with different symbols (†, ‡, §), P<0.001. All statistical analyses were performed by one-way ANOVA, followed by Bonferroni multiple comparison post hoc test (n=6) for each group. Symbols (*, †, ‡, §) indicate significance (at 0.05 level). Cell grouping: A1 = ADMSCs, A2 = ADMSCs + CoCl2, A3 = NanogOE-ADMSCs + CoCl2, A4 = siRNA-Nanog in ADMSCs + CoCl2. ADMSCs = adipose-derived mesenchymal stem cells; NanogOE = overexpression of Nanog gene.
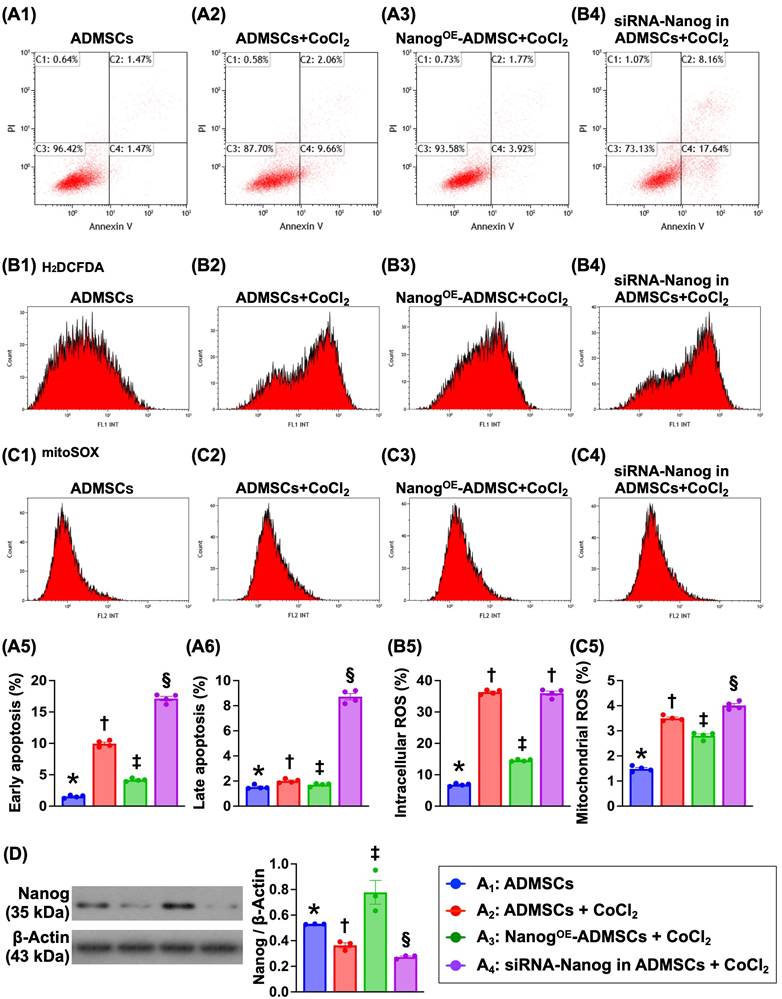
Nanog protein levels were highest in A3, lowest in A4 and significantly higher in A1 than in A2, indicating that the gene modulation procedure was successful in our in vitro study.
ATP concentration, mitochondrial DNA expression, mitochondrial cytochrome-C and angiogenesis are increased by Nanog gene overexpression (Figure 3)
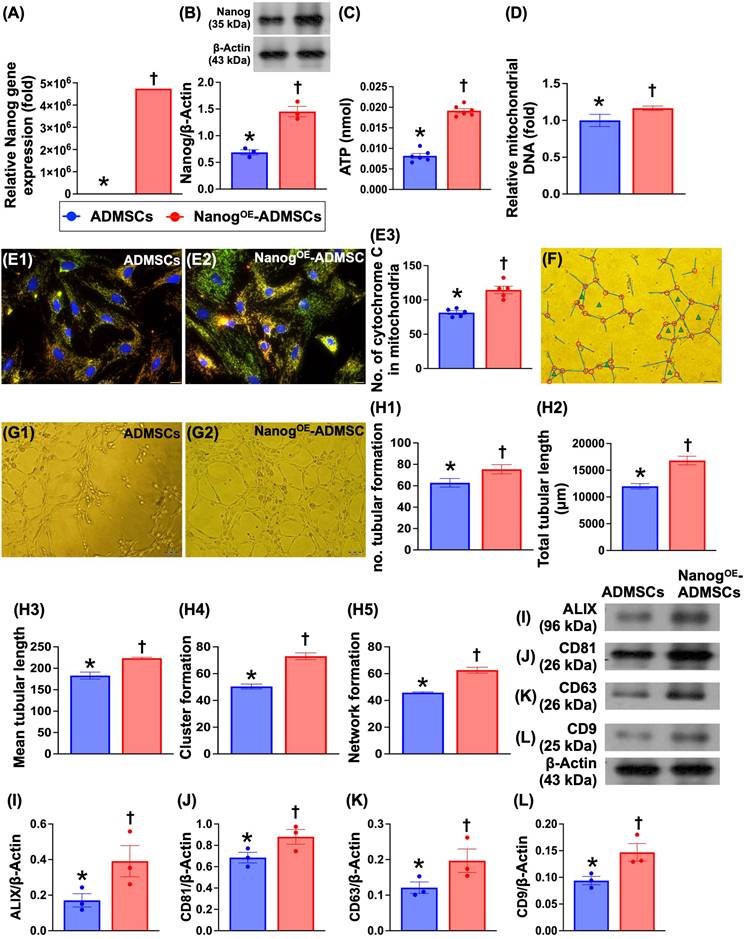
To evaluate whether Nanog gene overexpression in ADMSCs enhances cellular biological activity and mitochondrial biogenesis, the cells were classified as ADMSCs only or NanogOE-ADMSCs. Compared with those in the ADMSCs group, Nanog gene and protein expression and ATP concentrations significantly increased in the NanogOE-ADMSCs group. Additionally, relative mitochondrial DNA expression and the number of mitochondrial cytochrome C+ cells were significantly greater in NanogOE-ADMSCs than in ADMSCs. Moreover, a Matrigel assay demonstrated that angiogenesis was significantly greater in rat circulatory-derived endothelial progenitor cells (EPCs) treated with NanogOE-ADMSCs-derived conditioned medium (i.e., supernatant) than in EPCs treated with ADMSCs-derived conditioned medium. The culture medium was also collected for isolation of exosomes, followed by Western blot analysis. We found that typical exosome biological markers, including Alix, CD81, CD63 and CD9, were significantly more abundant in NanogOE-ADMSCs than in ADMSCs, indicating that exosomes might, at least in part, participate in enhancing EPC angiogenesis. Accordingly, our findings indicate that Nanog gene manipulation in ADMSCs was successful, resulting in increased cellular biological activity and increased mitochondrial biogenesis and ATP energy.
ATP concentration, relative mitochondria DNA expression, mitochondrial cytochrome-C, and angiogenesis were upregulated by Nanog gene overexpression. A) Relative gene expression of Nanog in ADMSCs with and without Nanog overexpression, * vs. †, P<0.001. B) Protein expression of Nanog in ADMSCs with and without Nanog overexpression, * vs. †, P<0.001. C) ATP concentration in ADMSCs with and without Nanog overexpression, * vs. †, P<0.001. D) Relative mitochondrial DNA expression, * vs. †, P<0.0001. E1 and E2) Illustrating the immunofluorescent (IF) microscopic finding (400x) for identification of mitochondrial cytochrome C (yellow-green color of a merge picture of double stains including red-color Hsp60 stain and green color cytochrome C stain). The scale bars in right lower corner represent 20 µm. E3) Analytical result of number of mitochondrial cytochrome C in ADMSCs with and without Nanog overexpression, * vs. †, P < 0.0001. F) Illustrating the interpretation of Matrigel assay for identification of angiogenesis, including tubular formation (blue length), cluster formation (red circle) network formation (green triangle). G1 and G2) Illustrating one sample of Matrigel assay for identification of rat circulatory derived endothelial progenitor cells (EPCs)-formed angiogenesis in ADMSCs-derived medium treated EPCs (G1) and NanogOE-ADMSCs-derived medium treated EPCs (G2). H1) Number of tubular formation, * vs. †, P < 0.001. H2) Total tubular length, * vs. †, P<0.001. H3) Mean tubular length, * vs. †, P<0.001. H4) Cluster formation, * vs. †, P<0.001. H5) Network formation. I) Protein expression of Alix, * vs. †, P<0.001. J) Protein expression of CD81, * vs. †, P < 0.001. K) Protein expression of CD63, * vs. †, P<0.001. L) Protein expression of CD9, * vs. †, P<0.001. Note the typical specific biomarkers, including ALIX, CD81, CD63 and C9 were identified from those of ADMSCs- or NanogOE-ADMSCs-derived exosomes. All statistical analyses were performed by one-way ANOVA, followed by Bonferroni multiple comparison post hoc test (n = 3-6) for each group. Symbols (*, †, ‡, §) indicate significance (at 0.05 level). ADMSCs = adipose-derived mesenchymal stem cells; NanogOE = overexpression of Nanog gene.
Nanog gene overexpression in ADMSCs suppresses the levels of proteins related to oxidative stress and cellular apoptosis and upregulates the expression of proteins related to cell stress signaling (Figure 4)
To investigate the impact of Nanog gene overexpression on the regulation of cell stress/proliferation signaling and oxidative stress/apoptosis, the cell groups were categorized as described in Figure 1 (A1 to A4). The protein expression levels of NOX-1 and NOX-2, two indices of oxidative stress, and the protein expression levels of cleaved caspase 3 and cleaved caspase 9 were significantly lower in A1 and A3 than in A2 and A4 and significantly greater than those in A4 and A2. However, these levels did not differ between A1 and A3.
Nanog gene overexpression in ADMSCs suppressed oxidative stress and cellular apoptosis and upregulated cell stress signaling. A) Protein expression of NOX-1, * vs. other groups with different symbols (†, ‡), P < 0.001. B) Protein expression of NOX-2, Analytical result of wound healing ability, * vs. other groups with different symbols (†, ‡), P < 0.001. C) Protein expression of cleaved caspase 3 (c-Casp3), * vs. other groups with different symbols (†, ‡), P < 0.001. D) Protein expression of c-Casp9, * vs. other groups with different symbols (†, ‡), P<0.0001. E) Protein expression of phosphorylated (p)-JAK2, * vs. other groups with different symbols (†, ‡, §), P<0.001. F) Protein expression of p-STAT, * vs. other groups with different symbols (†, ‡, §), P<0.001. G) Protein expression of p-m-TOR, * vs. other groups with different symbols (†, ‡, §), P < 0.001. H) Protein expression of p-PI3K, * vs. other groups with different symbols (†, ‡, §), P < 0.0001. I) Protein expression of p-Akt, * vs. other groups with different symbols (†, ‡, §), P < 0.001. J) Protein expression of Ras, * vs. other groups with different symbols (†, ‡, §), P<0.001. K) Protein expression of Raf, * vs. other groups with different symbols (†, ‡, §), P<0.0001. L) Protein expression of p-MEK1/2, * vs. other groups with different symbols (†, ‡, §), P<0.001. M) Protein expression of p-ERK1/2, * vs. other groups with different symbols (†, ‡, §), P < 0.001. Note: * indicated the control group. All statistical analyses were performed by one-way ANOVA, followed by Bonferroni multiple comparison post hoc test (n = 3) for each group. Symbols (*, †, ‡, §) indicate significance (at 0.05 level). Cell grouping: A1 = ADMSCs, A2 = ADMSCs + CoCl2, A3 = NanogOE-ADMSCs + CoCl2, A4 = siRNA-Nanog in ADMSCs + CoCl2. ADMSCs = adipose-derived mesenchymal stem cells; NanogOE = overexpression of Nanog gene.
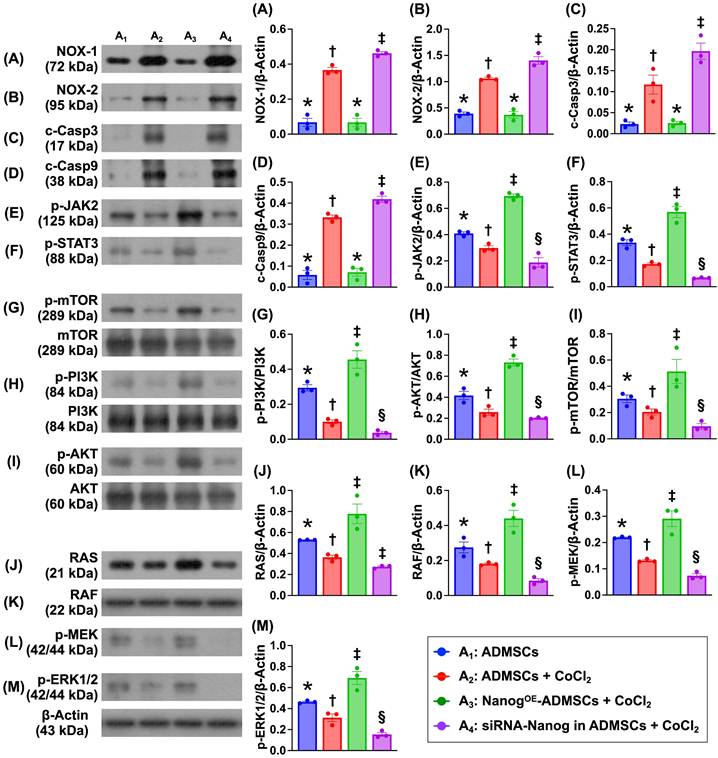
It is well known that the tyrosine-phosphorylated JAK/STAT signaling pathway mediates downstream events, including cell stress signals that are transported into the nucleus through the nuclear membrane to regulate specific genes. Our in vitro results revealed that the protein expression levels of phosphorylated JAK/STAT3 and its downstream signaling proteins, including p-PI3K, p-Akt, p-m-TOR (cell proliferation signaling), and Ras, Raf, MEK1/2 and ERK1/2 (cell stress signaling), were significantly lower in A4, highest in A3 and significantly lower in A1 than in A2. These findings suggest that Nanog gene overexpression promotes cell proliferation and cell stress signaling.
Nanog gene expression activates the cell cycle and upregulates the mitochondrial electron transport chain (ETC) under oxidative stress conditions (Figure 5)
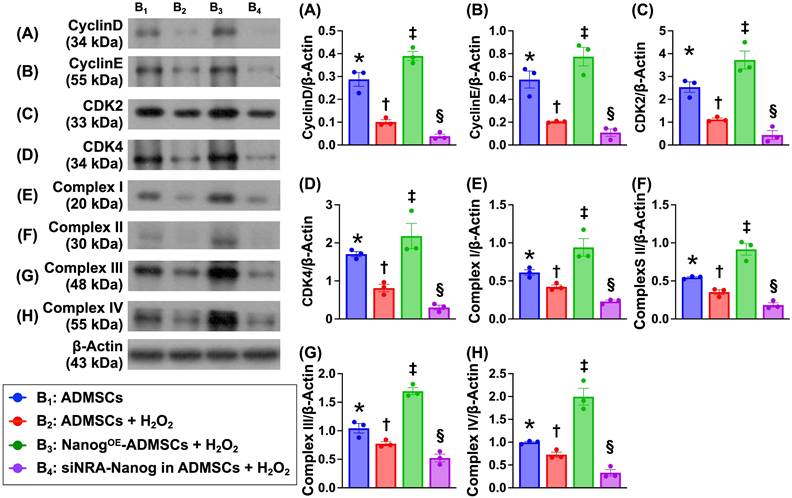
To verify whether Nanog gene expression activates ETC complexes I-IV and accelerates the cell cycle, the cells were categorized into B1 (ADMSCs only), B2 (ADMSCs + H2O2 (150 μM)), B3 (NanogOE-ADMSCs + H2O2 (150 μM)), and B4 (siRNA-Nanog gene in ADMSCs + H2O2 (150 μM)). Western blot analysis revealed that the protein expression levels of Cyclin D, Cyclin E, CKD2 and CKD4, which are four indices of cell cycle biomarkers, and the protein expression levels of ETC complexes I to IV were lowest in A4, highest in A3 and significantly greater in A1 than in A2.
Nanog gene expression activated cell cycle and upregulated mitochondrial electron transport chain (ETC) in oxidative stress condition. A) Protein expression of Cyclin D, * vs. other groups with different symbols (†, ‡, §), P < 0.0001. B) Protein expression of Cyclin E, * vs. other groups with different symbols (†, ‡, §), P < 0.001. C) Protein expression of CKD2, * vs. other groups with different symbols (†, ‡, §), P < 0.0001. D) Protein expression of CKD4, * vs. other groups with different symbols (†, ‡, §), P<0.0001. E) Protein expression of complex I, * vs. other groups with different symbols (†, ‡, §), P < 0.001. F) Protein expression of complex II, * vs. other groups with different symbols (†, ‡, §), P < 0.001. G) Protein expression of complex III, * vs. other groups with different symbols (†, ‡, §), P < 0.001. H) Protein expression of complex IV, * vs. other groups with different symbols (†, ‡, §), P < 0.0001. Note: * indicated the control group. All statistical analyses were performed by one-way ANOVA, followed by Bonferroni multiple comparison post hoc test (n = 6) for each group. Symbols (*, †, ‡, §) indicate significance (at 0.05 level). Cell grouping: B1 = ADMSCs, B2 = ADMSCs + H2O2, B3 = NanogOE-ADMSCs + H2O2, B4 = siRNA-Nanog gene in ADMSCs + H2O2. ADMSCs = adipose-derived mesenchymal stem cells; NanogOE = overexpression of Nanog gene.
Time courses of the LVEF and left ventricular remodeling index (LVRI) (Figure 6)
At baseline, the LVEF, LVRI and LVEDd did not differ among the groups. However, at 14 days after AMI induction, the LVEF was highest in Group 1 (i.e., SC), lowest in Groups 2 (AMI only) and 5 (AMI + siRNA-Nanog in ADMSCs) and significantly greater in Group 4 (AMI + NanogOE-ADMSCs) than in Group 3 (AMI + ADMSCs). On the other hand, the LVRI (i.e., the ratio between the left ventricular mass and end-diastolic volume) and LVEDd, two indices of LV remodeling, exhibited the opposite pattern of LVEF among the groups.
Time courses of LVEF, LVRI and LVEDd, and LV chamber area by day 35. A1 to A5) Illustrating the M-mode findings of transthoracic echocardiographic study at the time point of day 35 after AMI induction in each group of the animal. The left ventricular end diastolic dimension (LVEDd) was notably increased in groups 2 and 5 than in other groups by day 35 after AMI induction. B1) left ventricular ejection fraction (LVEF) at baseline, P > 0.5. B2) LVRI at baseline, P > 0.5. B3) LVEDd at baseline, P > 0.5. C1) LVEF at day 14 after AMI induction, * vs. other groups with different symbols (†, ‡, §), P < 0.0001. C2) LVRI at day 14 after AMI induction, * vs. other groups with different symbols (†, ‡), P < 0.0001. C3) LVEDd at day 14 after AMI induction, * vs. other groups with different symbols (†, ‡, §, ¶), P < 0.0001. D1) LVEF at day 35 after AMI induction, * vs. other groups with different symbols (†, ‡, §, ¶), P < 0.0001. D2) LVRI at day 35 after AMI induction, * vs. other groups with different symbols (†, ‡, §, ¶), P < 0.0001. D3) LVEDd at day 35 after AMI induction, * vs. other groups with different symbols (†, ‡, §, ¶), P < 0.0001. E1 to E5) Illustrating the vertical microscopic (cross sections) finding (12.5x) of H.E., stain for identification of LV chamber area. All scale bars in right lower corner represents 12.5 mm. E6) Analytical result of LV chamber area, * vs. other groups with different symbols (†, ‡, §, ¶), P < 0.0001. Note: * indicated the control group. All statistical analyses were performed by one-way ANOVA, followed by Bonferroni multiple comparison post hoc test (n = 8-10) for each group. Symbols (*, †, ‡, §, ¶) indicate significance (at 0.05 level). Group 1 = sham-operated control (SC), group 2 = AMI, group 3 = AMI + ADMSCs, group 4 = AMI + NanogOE in ADMSCs, 5 = AMI + siRNA-Nanog in ADMSCs. LV = left ventricular; AMI = acute myocardial infarction; ADMSCs = adipose-derived mesenchymal stem cells; NanogOE = overexpression of Nanog gene.
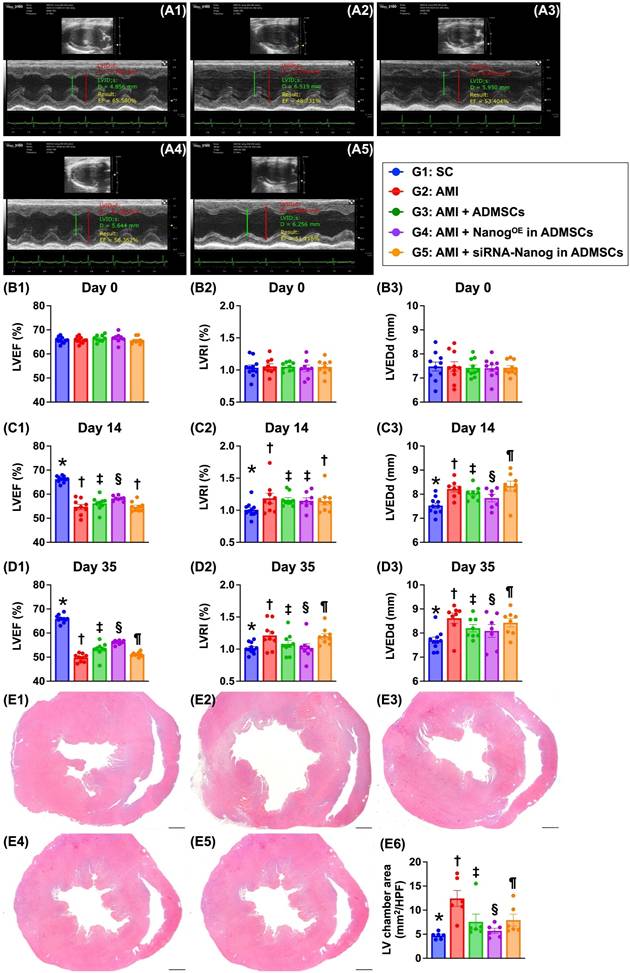
Additionally, on Day 35 after AMI induction, the LVEF remained highest in Group 1, lowest in Group 2, significantly lower in Group 5 than in Groups 3 and 4, and significantly greater in Group 4 than in Group 3. On the other hand, the LVRI and LVEDd displayed the opposite pattern of LVEF in this experiment. Our findings indicate that NanogOE-ADMSCs treatment was superior to ADMSCs treatment in preserving LV function and attenuating LV remodeling.
Levels of proteins related to cell proliferation and cell-stress signaling are altered in the LV myocardium on Day 35 after AMI induction (Figure 7)
The protein expression levels of p-JAK and p-STAT3, members of a common pathway for the transduction of signals from the extracellular level to the intracellular environment, were significantly lower in Group 2 than in Group 1, and these proteins were significantly upregulated in Group 3 and further significantly upregulated in Group 4. However, these parameters were significantly lower in Group 5 than in Groups 3 and 4.
Protein levels of cell proliferation and cell-stress signalings in LV myocardium by day 35 after AMI induction. A) Protein expression of phosphorylated (p)-JAK, * vs. other groups with different symbols (†, ‡, §, ¶), P<0.0001. B) Protein expression of p-STAT3, * vs. other groups with different symbols (†, ‡, §, ¶), P<0.0001. C) Protein expression of p-PI3K, * vs. other groups with different symbols (†, ‡, §, ¶), P<0.0001. D) Protein expression of p-Akt, * vs. other groups with different symbols (†, ‡, §, ¶), P<0.0001. E) Protein expression of p-mTOR, * vs. other groups with different symbols (†, ‡, §, ¶), P<0.0001. F) Protein expression of RAS, * vs. other groups with different symbols (†, ‡, §, ¶), P<0.0001. G) Protein expression of RAF, * vs. other groups with different symbols (†, ‡, §, ¶), P<0.0001. H) Protein expression of p-MEK1/2, * vs. other groups with different symbols (†, ‡, §, ¶), P<0.0001. I) Protein expression of ERK1/2, * vs. other groups with different symbols (†, ‡, §, ¶), P<0.0001. Note: * indicated the control group. All statistical analyses were performed by one-way ANOVA, followed by Bonferroni multiple comparison post hoc test (n=6) for each group. Symbols (*, †, ‡, §, ¶) indicate significance (at 0.05 level). LV = left ventricular; SC = sham-operated control; AMI = acute myocardial infarction; ADMSCs = adipose-derived mesenchymal stem cells; NanogOE = overexpression of Nanog gene.
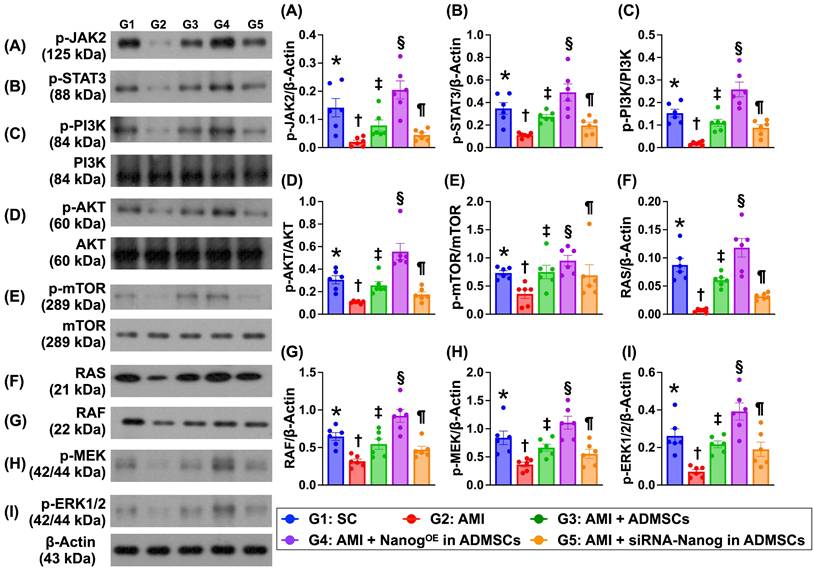
Additionally, the protein expression levels of p-PI3K, p-Akt and p-mTOR, which are three indicators of cell proliferation signaling, and the protein expression levels of RAS, RAF, p-MEK1/2 and ERK1/2, which are four biomarkers of cell stress signaling, displayed patterns similar to those of p-JAK/p-STAT3 signaling proteins among the groups.
Protein expression of the cell cycle and mitochondrial ETC complexes is altered in the LV myocardium by Day 35 after AMI induction (Figure 8)
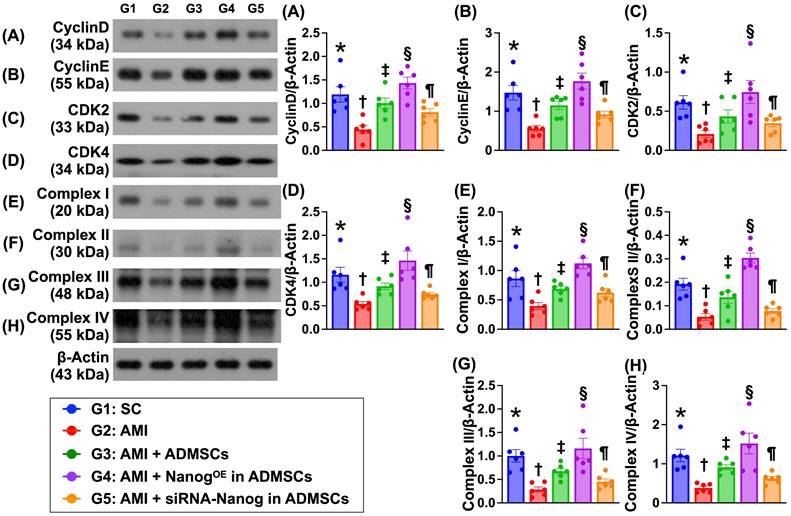
The protein expression levels of cyclin D, cyclin E, CDK2 and CDK4, which are four indices of cell cycle biomarkers, were significantly lower in Group 2 than in Group 1. In addition, the expression levels of these proteins were significantly greater in Group 3 and significantly greater in Group 4 than in Group 1. However, these parameters were significantly lower in Group 5 than in Groups 3 and 4. Additionally, the protein expression levels of mitochondrial ETC complexes I to IV also displayed a pattern identical to that of the cell cycle proteins among the groups.
Protein expressions of cell cycle and mitochondrial ETC complexes in LV myocardium by day 35 after AMI induction. A) Protein expression of cyclin D, * vs. other groups with different symbols (†, ‡, §, ¶), P < 0.0001. B) Protein expression of cyclin E, * vs. other groups with different symbols (†, ‡, §, ¶), P < 0.0001. C) Protein expression of CDK2, * vs. other groups with different symbols (†, ‡, §, ¶), P < 0.0001. D) Protein expression of CDK4, * vs. other groups with different symbols (†, ‡, §, ¶), P < 0.0001. E) Protein expression of complex I, * vs. other groups with different symbols (†, ‡, §, ¶), P < 0.0001. F) Protein expression of complex II, * vs. other groups with different symbols (†, ‡, §, ¶), P < 0.0001. G) Protein expression of complex III, * vs. other groups with different symbols (†, ‡, §, ¶), P < 0.0001. H) Protein expression of complex IV, * vs. other groups with different symbols (†, ‡, §, ¶), P < 0.0001. Note: * indicated the control group. All statistical analyses were performed by one-way ANOVA, followed by Bonferroni multiple comparison post hoc test (n = 6) for each group. Symbols (*, †, ‡, §, ¶) indicate significance (at 0.05 level). LV = left ventricular; SC = sham-operated control; AMI = acute myocardial infarction; ADMSCs = adipose-derived mesenchymal stem cells; NanogOE = overexpression of Nanog gene.
Protein expression is associated with oxidative stress and apoptosis, the LV myocardial infarct area and cardiomyocyte size (Figure 9)
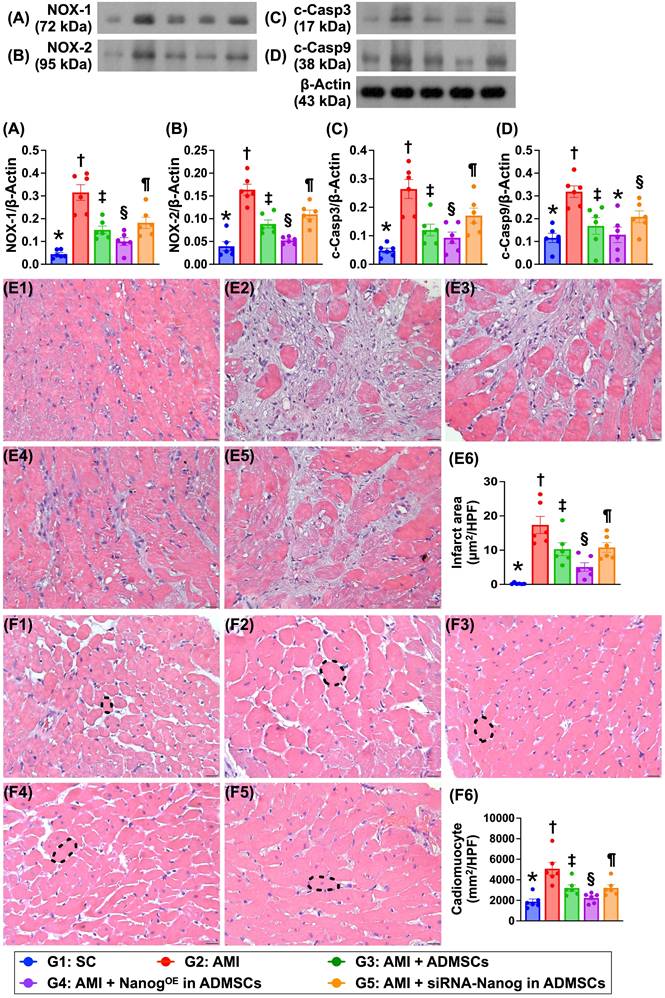
The protein expression levels of NOX-1 and NOX-2, which are two indicators of oxidative stress, and the protein expression levels of cleaved caspase 3 and cleaved caspase 9, which are two indicators of apoptosis, were significantly greater in Group 2 than in Group 1 but were significantly lower in Group 3 and significantly lower in Group 4. However, these parameters were significantly reversed in Group 5 compared with Groups 3 and 4. H&E staining revealed that the LV infarct area was lowest in Group 1, highest in Group 2, significantly lower in Group 4 than in Groups 3 and 5 and significantly lower in Group 3 than in Group 5. Additionally, the cardiomyocyte size of the LV myocardium exhibited an identical pattern of infarct area among the groups.
Protein expressions of oxidative stress and apoptosis, cardiomyocyte size and LV myocardial infarct area. A) Protein expression of NOX-1, * vs. other groups with different symbols (†, ‡, §, ¶), P < 0.0001. B) Protein expression of NOX-2, * vs. other groups with different symbols (†, ‡, §, ¶), P < 0.0001. C) Protein expression of cleaved caspase 3 (c-Casp3, * vs. other groups with different symbols (†, ‡, §, ¶), P < 0.0001. D) Protein expression of c-Casp9, * vs. other groups with different symbols (†, ‡, §, ¶), P < 0.0001. E1 to E5) Illustrating the microscopic finding (200x) of H.E., stain for identification of infarct area of LV myocardium (white color). All scale bar in right lower corner represents 50 µm. E6) Analytical result of infarct area, * vs. other groups with different symbols (†, ‡, §, ¶), P < 0.0001. F1 to F5) Showing the microscopic finding (400x) of H.E., stain for identification of cardiomyocyte size (black dotted line) of LV myocardium. F6) Analytical result of cardiomyocyte size, * vs. other groups with different symbols (†, ‡, §, ¶), P < 0.0001. All scale bar in right lower corner represents 20.0 µm. Note: * indicated the control group. All statistical analyses were performed by one-way ANOVA, followed by Bonferroni multiple comparison post hoc test (n = 6) for each group. Symbols (*, †, ‡, §, ¶) indicate significance (at 0.05 level). LV = left ventricular; SC = sham-operated control; AMI = acute myocardial infarction; ADMSCs = adipose-derived mesenchymal stem cells; NanogOE = overexpression of Nanog gene.
Discussion
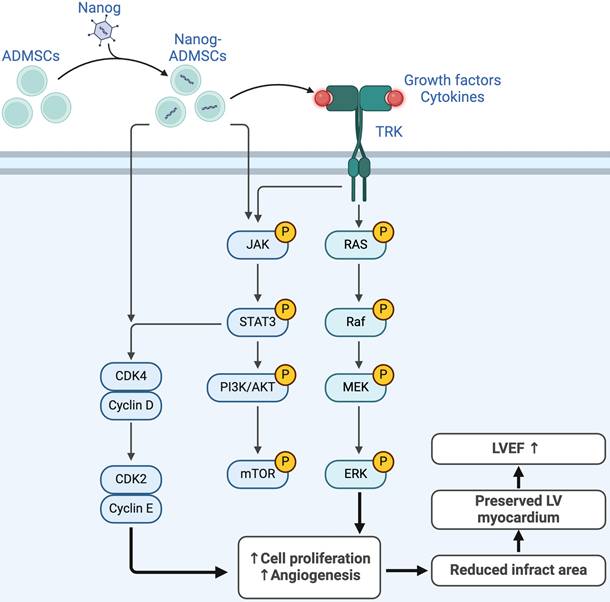
This study investigated the therapeutic impact of NanogOE-ADMSCs on preserving heart function and suppressing molecular‒cellular perturbations, which has several notable implications. First, the in vitro study results demonstrated that Nanog gene overexpression enhanced cell proliferation, migration and wound healing, which was also observed in the histological examinations as part of the in vivo study. Second, the cell cycle, mitochondrial number/ATP biogenesis and mitochondrial ETC complexes were also increased in ADMSCs after Nanog gene overexpression. Third, LV function was strongly preserved in AMI animals after receiving NanogOE-ADMSCs. Fourth, the results of the present study revealed that the coordinated axis of the Nanog gene upregulated cell survival and proliferation signaling (Figure 10), resulting in LV tissue regeneration along with a reduction in LV remodeling and an improvement in heart function.
Underlying mechanism of Nanog gene on affecting the outcomes of AMI. Figure 10 illustrates the overexpression of Nanog gene on ADMSCs (i.e., NanogOE-ADMSCs) on upregulating the cell stress/cell proliferation signalings, resulting on improving the outcomes in setting of AMI. ADMSCs = adipose-derived mesenchymal stem cells; AMI = acute myocardial infarction; LVEF = left ventricular ejection fraction.
Numerous studies have shown that cell therapies, especially those involving MSCs and ADMSCs, significantly improve ischemia-related LV dysfunction [7, 10, 22, 25-28]. The most important finding in the present study was that, compared with AMI animals without treatment, the LVEF was significantly improved in AMI animals after receiving ADMSCs therapy and further significantly improved in those of AMI animals after receiving NanogOE-ADMSCs therapy. Additionally, two imaging parameters, LVRI and LVEDd, and anatomical parameters of the LV chamber size were assessed. These three indices of LV remodeling were significantly lower in the ADMSCs-treated AMI animals and more significantly reduced in the NanogOE-ADMSCs-treated AMI animals than in the untreated AMI animals and the animals treated with siRNA-Nanog in ADMSCs. Furthermore, the pathological findings demonstrated that the infarct area and fibrotic area were identical to the LV chamber size among the groups. Importantly, when the Nanog gene was silenced in ADMSCs, all the abovementioned parameters were markedly reversed in the in vivo study. Our findings, in addition to extending the findings of previous studies [7, 10, 22, 25-28], highlight that the Nanog gene, which is involved in tissue regeneration and preservation of heart function, potentially plays a crucial role in the AMI setting. Accordingly, the results of the present study encourage to consider the clinical application of this regimen for AMI patients if the ethical issue is no longer taken into consideration.
Overexpressing and silencing the Nanog gene helped to verify its crucial role in cellular biological effects, leading to the discovery of several noteworthy phenomena. First, Nanog overexpression increased cell proliferation, migration and the wound healing rate. Second, Nanog gene overexpression upregulated the cell cycle and accelerated the rate of mitochondrial ETC complex formation. These findings were observed not only in vitro but also in vivo. Third, these findings were notably reversed by silencing the Nanog gene in ADMSCs, indicating that manipulation of the Nanog gene is fundamental for regenerative medicine in ischemia-related organ dysfunction.
We next explored the underlying mechanism by which NanogOE-ADMSCs treatment preserves heart function in rodents after AMI. The principal findings of the in vitro and in vivo studies were that, compared with that in the controls, the expression of JAK/STAT3, a critical transporter of extracellular signals to the intracellular environment, was markedly suppressed in the AMI model. In addition, its expression was markedly increased in the AMI model treated with ADMSCs and markedly increased in the AMI model treated with NanogOE-ADMSCs. Additionally, both cell proliferation (i.e., PI3K/Akt/mTOR) and cell stress signaling (i.e., RAS/RAF/MEK1/2/ERK1/2) also exhibited similar patterns of JAK/STAT3 signaling among the groups. On the basis of the findings from in vitro and in vivo studies, we propose that Nanog gene overexpression may activate JAK/STAT3-mediated cell proliferation and cell stress signaling, as schematically illustrated in Figure 10.
The links between LV myocardial damage and oxidative stress/apoptosis have been extensively explored in previous studies [18, 20, 22, 23, 26]. Our in vitro and in vivo studies revealed that, compared with those in H2O2-treated ADMSCs and AMI animals, oxidative stress and cellular apoptosis were substantially suppressed by Nanog gene overexpression. Our findings, in addition to being consistent with the findings of previous studies [18, 20, 22, 23, 26], partially explain why the LV infarction area was mostly reduced by NanogOE-ADMSCs treatment.
Study limitations
Our study has several limitations. First, although the results of this study are promising, the study period was relatively short (i.e., only 35 days from AMI induction to the end of the study period). Accordingly, the long-term impact of NanogOE-ADMSCs therapy on improving LV function remains uncertain. Second, although JAK/STAT3-mediated cell survival and cell stress signaling pathways were identified as important for the recovery of heart function after AMI, it remains unclear whether these are the only signaling pathways activated by the Nanog gene after AMI.
In conclusion, NanogOE-ADMSCs therapy activates the JAK/STAT3 pathway-mediated upregulation of cell proliferation and cell stress signaling, which further activates the expression of downstream proteins related to the cell cycle and mitochondrial ETC complexes to improve heart function in AMI rats.
Abbreviations
NanogOE-ADMSCs: NANOG gene overexpression on adipose-derived mesenchymal stem cells; siRNA-Nanog-ADMSCs: small interfering RNA (i.e., silencing) Nanog gene in ADMSCs; AMI: acute myocardial infarction; MTT: (3-(4,5-Dimethylthiazol-2-yl)-2,5-diphenyltetrazolium bromide); CoCl2: Cobalt chloride; MSCs: mesenchymal stem cells; LV: left ventricle; ROS: reactive oxygen species; LVEF: left ventricular ejection fraction; HF: heart failure; LCA: left coronary artery; LVESd: left ventricular end-systolic diameter; LVEDd: left ventricular end-diastolic diameter; IHC: immunohistochemical; ETC: electron transport chain; LVRI: left ventricular remodeling index.
Acknowledgements
This study was supported by a project grant from Chang Gung Memorial Hospital, Chang Gung University [CMRPG8N0201].
The authors declare that they have not used AI-generated work in this manuscript in this section.
Author contributions
Investigation: H. -T. Y., D. K. -R. H., X. -W. L., J. -N. Y., Y. -L. C., C. -R. H. and Y. -T. W. Methodology: C. -R. H. Funding acquisition: P. -H. S. Supervision: S. -F. K., P. -H. S. and H. -K. Y. Writing - review & editing, S. -F. K., P. -H. S. and H. -K. Y.
All authors read and approved the final manuscript in the last statement.
Ethics approval and consent to participate
The Guide for the Care and Use of Laboratory Animals performed all animal procedures. The details of ethics approvals are shown below:
Title of the approved project: Overexpression of Nanog enhances the therapeutic efficacy of adipose tissue-derived mesenchymal stem cells in acute myocardial infarction via upregulating JAK/STAT3 signaling and cyclin-mitochondrial expressions.
Name of the institutional approval committee: Institute of Animal Care and Use Committee at Kaohsiung Chang Gung Memorial Hospital.
Approval number: 2022090101.
Date of approval: 2022/10/18.
Availability of data and materials
Availability of data and materials' statement all additional files are included in the manuscript.
The datasets of present study can be available from the corresponding author upon request.
Competing Interests
The authors have declared that no competing interest exists.
References
1. Ibanez B, James S, Agewall S, Antunes MJ, Bucciarelli-Ducci C, Bueno H. et al. 2017 ESC Guidelines for the management of acute myocardial infarction in patients presenting with ST-segment elevation: The Task Force for the management of acute myocardial infarction in patients presenting with ST-segment elevation of the European Society of Cardiology (ESC). Eur Heart J. 2018;39:119-77
2. Antman EM. Time is muscle: translation into practice. J Am Coll Cardiol. 2008;52:1216-21
3. Redfors B, Mohebi R, Giustino G, Chen S, Selker HP, Thiele H. et al. Time Delay, Infarct Size, and Microvascular Obstruction After Primary Percutaneous Coronary Intervention for ST-Segment-Elevation Myocardial Infarction. Circ Cardiovasc Interv. 2021;14:e009879
4. Writing Committee M, Gulati M, Levy PD, Mukherjee D, Amsterdam E, Bhatt DL. et al. 2021 AHA/ACC/ASE/CHEST/SAEM/SCCT/SCMR Guideline for the Evaluation and Diagnosis of Chest Pain: A Report of the American College of Cardiology/American Heart Association Joint Committee on Clinical Practice Guidelines. J Am Coll Cardiol. 2021;78:e187-e285
5. Zhou Y, Yamamoto Y, Xiao Z, Ochiya T. The Immunomodulatory Functions of Mesenchymal Stromal/Stem Cells Mediated via Paracrine Activity. J Clin Med. 2019;8:1025
6. Wang C, Li Y, Yang M, Zou Y, Liu H, Liang Z. et al. Efficient Differentiation of Bone Marrow Mesenchymal Stem Cells into Endothelial Cells in vitro. Eur J Vasc Endovasc Surg. 2018;55:257-65
7. Yu J, Zhang RF, Mao YL, Zhang H. Efficacy and Safety of Mesenchymal Stem Cell Therapy in Patients with Acute Myocardial Infarction: A Systematic Review and Meta-analysis of Randomized Controlled Trials. Curr Stem Cell Res Ther. 2022;17:793-807
8. Vono R, Jover Garcia E, Spinetti G, Madeddu P. Oxidative Stress in Mesenchymal Stem Cell Senescence: Regulation by Coding and Noncoding RNAs. Antioxid Redox Signal. 2018;29:864-79
9. Denu RA, Hematti P. Effects of Oxidative Stress on Mesenchymal Stem Cell Biology. Oxid Med Cell Longev. 2016;2016:2989076
10. Carbone RG, Monselise A, Bottino G, Negrini S, Puppo F. Stem cells therapy in acute myocardial infarction: a new era? Clin Exp Med. 2021;21:231-7
11. Sung PH, Luo CW, Chiang JY, Yip HK. The combination of G9a histone methyltransferase inhibitors with erythropoietin protects heart against damage from acute myocardial infarction. Am J Transl Res. 2020;12:3255-71
12. Lee MS, Yip HK, Yang CC, Chiang JY, Huang TH, Li YC. et al. Overexpression of miR-19a and miR-20a in iPS-MSCs preserves renal function of chronic kidney disease with acute ischaemia-reperfusion injury in rat. J Cell Mol Med. 2021;25:7675-89
13. Sheu JJ, Chai HT, Sung PH, Chiang JY, Huang TH, Shao PL. et al. Double overexpression of miR-19a and miR-20a in induced pluripotent stem cell-derived mesenchymal stem cells effectively preserves the left ventricular function in dilated cardiomyopathic rat. Stem Cell Res Ther. 2021;12:371
14. Luo H, Li Q, Pramanik J, Luo J, Guo Z. Nanog expression in heart tissues induced by acute myocardial infarction. Histol Histopathol. 2014;29:1287-93
15. Guo ZK, Guo K, Luo H, Mu LM, Li Q, Chang YQ. The expression analysis of nanog in the developing rat myocardial tissues. Cell Physiol Biochem. 2015;35:866-74
16. Kilkenny C, Browne WJ, Cuthill IC, Emerson M, Altman DG. Improving bioscience research reporting: the ARRIVE guidelines for reporting animal research. PLoS Biol. 2010;8:e1000412
17. Sun CK, Yen CH, Lin YC, Tsai TH, Chang LT, Kao YH. et al. Autologous transplantation of adipose-derived mesenchymal stem cells markedly reduced acute ischemia-reperfusion lung injury in a rodent model. J Transl Med. 2011;9:118
18. Chen YT, Chiang HJ, Chen CH, Sung PH, Lee FY, Tsai TH. et al. Melatonin treatment further improves adipose-derived mesenchymal stem cell therapy for acute interstitial cystitis in rat. J Pineal Res. 2014;57:248-61
19. Chen YL, Sheu JJ, Sun CK, Huang TH, Lin YP, Yip HK. MicroRNA-214 modulates the senescence of vascular smooth muscle cells in carotid artery stenosis. Mol Med. 2020;26:46
20. Sheu JJ, Chai HT, Chiang JY, Sung PH, Chen YL, Yip HK. Cellular Prion Protein Is Essential for Myocardial Regeneration but Not the Recovery of Left Ventricular Function from Apical Ballooning. Biomedicines. 2022;10:167
21. Chen YT, Huang CR, Chang CL, Chiang JY, Luo CW, Chen HH. et al. Jagged2 progressively increased expression from Stage I to III of Bladder Cancer and Melatonin-mediated downregulation of Notch/Jagged2 suppresses the Bladder Tumorigenesis via inhibiting PI3K/AKT/mTOR/MMPs signaling. Int J Biol Sci. 2020;16:2648-62
22. Yip HK, Chang LT, Wu CJ, Sheu JJ, Youssef AA, Pei SN. et al. Autologous bone marrow-derived mononuclear cell therapy prevents the damage of viable myocardium and improves rat heart function following acute anterior myocardial infarction. Circ J. 2008;72:1336-45
23. Lee FY, Luo CW, Wallace CG, Chen KH, Sheu JJ, Yin TC. et al. Direct implantations of erythropoietin and autologous EPCs in critical limb ischemia (CLI) area restored CLI area blood flow and rescued remote AMI-induced LV dysfunction. Biomed Pharmacother. 2019;118:109296
24. Yang CC, Chen YL, Sung PH, Chiang JY, Chen CH, Li YC. et al. Repeated administration of adipose-derived mesenchymal stem cells added on beneficial effects of empagliflozin on protecting renal function in diabetic kidney disease rat. Biomed J. 2024;47:100613
25. Lee FY, Chen YL, Sung PH, Ma MC, Pei SN, Wu CJ. et al. Intracoronary Transfusion of Circulation-Derived CD34+ Cells Improves Left Ventricular Function in Patients with End-Stage Diffuse Coronary Artery Disease Unsuitable for Coronary Intervention. Crit Care Med. 2015;43:2117-32
26. Sheu JJ, Lee MS, Wallace CG, Chen KH, Sung PH, Chua S. et al. Therapeutic effects of adipose derived fresh stromal vascular fraction-containing stem cells versus cultured adipose derived mesenchymal stem cells on rescuing heart function in rat after acute myocardial infarction. Am J Transl Res. 2019;11:67-86
27. Song Y, Wang B, Zhu X, Hu J, Sun J, Xuan J. et al. Human umbilical cord blood-derived MSCs exosome attenuate myocardial injury by inhibiting ferroptosis in acute myocardial infarction mice. Cell Biol Toxicol. 2021;37:51-64
28. Clavellina D, Balkan W, Hare JM. Stem cell therapy for acute myocardial infarction: Mesenchymal Stem Cells and induced Pluripotent Stem Cells. Expert Opin Biol Ther. 2023;23:951-67
Author contact
![]() Corresponding author: Hon-Kan Yip, MD. E-mail: han.gunghinet.net; Pei-Hsun Sung, MD. E-mail: e12281org.tw; Sheung-Fat Ko, MD. E-mail: kosheungfatcom; Address: 123, Dapi Road, Niaosung Dist., Kaohsiung, 833401, Taiwan. Tel.: +886-7-7317123, Fax: +886-7-7322813.
Corresponding author: Hon-Kan Yip, MD. E-mail: han.gunghinet.net; Pei-Hsun Sung, MD. E-mail: e12281org.tw; Sheung-Fat Ko, MD. E-mail: kosheungfatcom; Address: 123, Dapi Road, Niaosung Dist., Kaohsiung, 833401, Taiwan. Tel.: +886-7-7317123, Fax: +886-7-7322813.