Impact Factor ISSN: 1449-2288
- Issue 12; 2026
- Issue 11; 2026
- Issue 10; 2026
- Issue 9; 2026
- Issue 8; 2026
- Volume 22; 2026
- Past Issues
- Advance Articles
- Editorial Board
- Cover Images
- Index & Coverage
- Cover Suggestion
- Special Issues
Introduction
Materials and Methods
Results
Discussion
Abbreviations
Supplementary Material
Acknowledgements
References

 Global reach, higher impact
Int J Biol Sci 2025; 21(12):5428-5443. doi:10.7150/ijbs.115672 This issue Cite
Research Paper
WTAP Maintains Alternative Activation of Macrophages by Promoting IDH1-Mediated α-ketoglutarate Production
Qianqian Xu1†, Jing Zhang1†, Yuan Zou2†, Longmin Chen2, Fei Sun1, Xi Luo1, Ting Wang1, Yang Li1, Shu Zhang1, Fei Xiong1, Qilin Yu1, Ping Yang1, Quan Gong3, Shi-Wei Liu4 ![]() , Cong-Yi Wang4,5,6
, Cong-Yi Wang4,5,6 ![]()
1. Department of Respiratory and Critical Care Medicine, the Center for Biomedical Research, NHC Key Laboratory for Respiratory Diseases, Tongji Hospital, Tongji Medical College, Huazhong University of Science and Technology, Wuhan, China.
2. Department of Rehabilitation, Tongji Hospital, Tongji Medical College, Huazhong University of Science and Technology, Wuhan, China.
3. Department of Immunology, School of Medicine, Yangtze University, Jingzhou, China.
4. Shanxi Bethune Hospital, Shanxi Academy of Medical Science, Tongji Shanxi Hospital, Third Hospital of Shanxi Medical University, the Key Laboratory of Endocrine and Metabolic Diseases of Shanxi Province, Taiyuan, China.
5. The Center for Biomedical Research, Tongji Hospital Research Building, Tongji Hospital, Tongji Medical College, Huazhong University of Science and Technology, Wuhan, China.
6. Diabetes Research Center, Qatar Biomedical Research Institute, Hamad Bin Khalifa University, Doha, Qatar.
† These authors contributed equally to this work.
Received 2025-4-13; Accepted 2025-8-5; Published 2025-8-22
Abstract

Background: N6-methyladenosine (m6A) modification plays a crucial role in various physiological processes by regulating mRNA biology. However, the exact impact of m6A modification on macrophages in adipose tissues under obese settings remains to be further elucidated.
Methods: We established macrophage-specific Wtap-deficient mice to explore the effects of Wtap on obesity and metabolic disorders induced by high-fat diet (HFD) in mice. The molecular targets were explored by MeRIP-qPCR, and the metabolomic assays were performed to detect the alteration of relevant metabolites.
Results: Wilms tumor 1-associated protein (WTAP), one of the m6A “writers”, was downregulated in adipose tissue macrophages (ATMs) from obese individuals and negatively correlated with clinical metabolic traits. Depletion of Wtap in mouse macrophages exacerbated the metabolic consequences of high-fat diet (HFD) induced obesity. Additionally, energy expenditure and adipose beiging were considerably lower in Wtap-deficient mice in response to cold exposure. Mechanistic study revealed that WTAP-mediated m6A modification of isocitrate dehydrogenase 1 (Idh1) transcripts enhanced its stability and translation in macrophages leading to α-ketoglutarate (α-KG) production. Alpha-KG further supported alternative activation of macrophages by metabolic reprogramming.
Conclusions: Our data support that Wtap modulates HFD-induced macrophages through interfering with the IDH1-α-KG axis, and highlight the importance of WTAP-mediated m6A modification in maintaining alternative macrophage activation, proposing potential targets for the regulation of obesity and related metabolic diseases.
Keywords: obesity, macrophage, WTAP, m6A modification, IDH1, α-ketoglutarate
Introduction
Chronic inflammation in adipose tissue is a crucial factor predisposing to the development of obesity and its related metabolic disorders [1], which is featured by the infiltration and activation of immune cells coupled with secretion of pro-inflammatory mediators [2]. Particularly, macrophages are the most abundant immune cells in adipose tissues [3]. In response to metabolic cues, adipose tissue macrophages (ATMs) present in a spectrum of heterogeneous activation states, exerting significant modulatory effects on metabolic outcomes [4]. During obesity progression, macrophages accumulate in crown-like structures (CLSs) surrounding the dying adipocytes, adopt an inflammatory phenotype and mediate the development of insulin resistance. In contrast, lean fat ATMs are uniformly dispersed, typically express alternatively activated markers and release anti-inflammatory cytokines, by which they maintain the homeostasis of adipose tissue by resolving inflammation [5]. In addition to the anti-inflammatory properties, previous studies including ours also support that alternatively activated macrophages may enhance adipose browning and beiging process, thereby regulating adaptive thermogenesis and energy expenditure [6, 7]. In this respect, shifting macrophages toward alternatively activated phenotype may help to establish a healthy metabolic state.
N6-methyladenosine (m6A) is the most common and abundant messenger RNA (mRNA) modification and defined as one layer of the epitranscriptomes [8]. In mammals, the m6A modification is deposited by the methyltransferase complex known as “writers”, composed of methyltransferase-like 3 (METTL3), methyltransferase-like 14 (METTL14), and Wilms tumor-1-associating protein (WTAP), among which METTL3 is responsible for catalyzing m6A formation, METTL14 is in charge of binding target mRNA, and WTAP is involved in the localization of the complex into nuclear speckles [9]. By contrast, the methylation can be removed by two demethylases (erasers): fat mass and obesity-associated gene (FTO) and AlkB homolog 5 (ALKBH5). These modifications are recognized and interpreted by “readers”, including the YT521-B homology domain family (YTHDF) proteins and the insulin-like growth factor 2 mRNA binding proteins (IGF2BPs) [10]. m6A participates in the regulation of various cellular phenotypes and biological processes, with a broad influence in mRNA splicing, stability, nuclear export, and translation [11]. Therefore, a growing number of studies revealed that alterations in m6A contribute to the dysfunction of adipose tissue, liver, islets, and cardiovascular system, thereby exacerbating the incidence and development of metabolic disorders [12-15]. However, unlike other m6A effectors, the role of WTAP in pathological conditions is relatively less appreciated, particularly in the setting of metabolic disorders.
Herein in this report, we noted that ATMs originated from obese subjects and high-fat diet (HFD) challenged mice are featured by the repressed WTAP expression. Macrophages deficient in Wtap significantly exacerbated adipose inflammatory responses along with metabolic dysfunction following the insult of metabolic stress. Mechanistically, loss of Wtap in macrophages dampened isocitrate dehydrogenase 1 (IDH1) mRNA stability and protein expression by decreasing m6A modification. The reduced IDH1 expression then led to the decreased production of α-ketoglutarate (α-KG), a critical metabolite that governs the macrophage alternative phenotype and energy balance [16, 17]. Collectively, our findings shed new light on the epitranscriptomic regulation of macrophage program in obese settings via WTAP-mediated m6A modification.
Materials and Methods
Mouse models
The Wtapflox/flox (Wtapf/f) mice in the C57BL/6 background were generated by targeting exon 3 using the CRISPR/Cas9 technique as described (Fig. 2A). The LysM-Cre transgenic mice in the C57BL/6 background were purchased from the Jackson's Laboratory (Bar Harbor, ME, USA). LysM-Cre Wtapf/f mice were generated by crossing the LysM-Cre mice with Wtapf/f mice for specific deletion of Wtap in macrophages. All mice were bred under specific pathogen-free (SPF) conditions with a 12-hour light/dark cycle, at a temperature of 20-24 °C and humidity of 45-65% in the Experimental Animal Center of Tongji Hospital. In the HFD model, 8-week-old LysM-Cre Wtapf/f mice and their littermates were continuously provided with a high-fat diet (60% kcal fat; D112492, Research Diet, Gardners, USA) for 12 weeks. All tissues and blood samples were collected at the same time. In the cold stimulation model, one mouse per cage was exposed to a consistent temperature of 4 °C at 8 weeks of age, and the initial changes of the body temperatures were recorded. All experimental procedures were approved by the Animal Care and Use Committee of Tongji Hospital (TJH-202206021) in accordance with the guidelines of the National Institutes of Health (NIH).
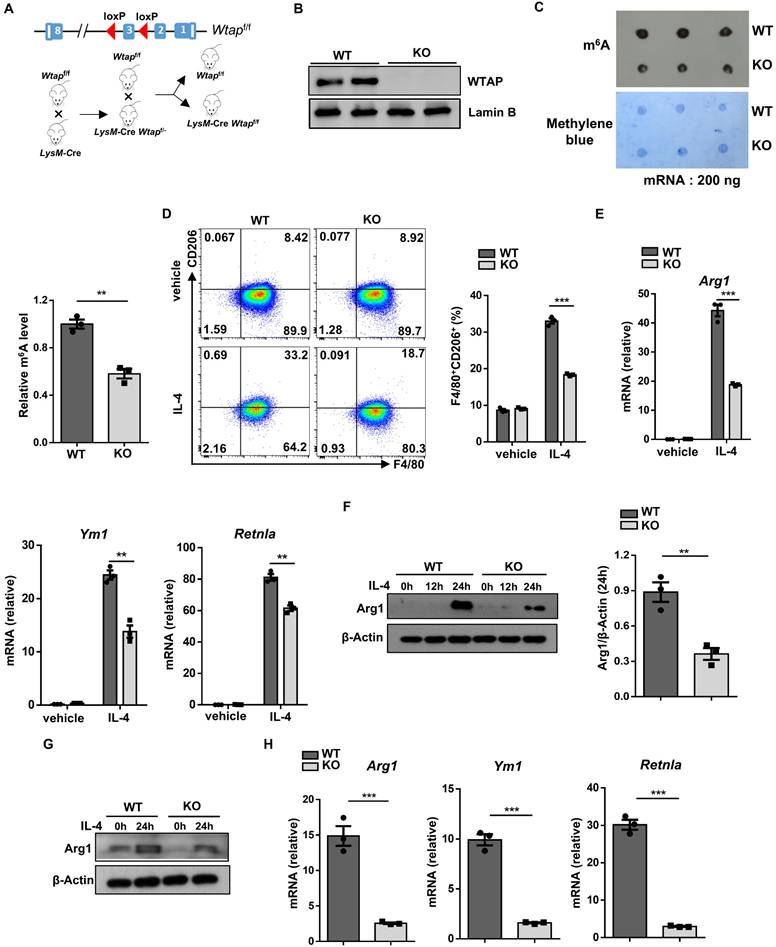
Wtap depletion in macrophages downregulates alternative macrophage activation. A A WTAP-specific knockout mouse model was constructed. LoxP sites were inserted flanking exon 3 of the Wtap gene. Crossing these mice with LysM-Cre mice resulted in the generation of LysM-Cre-Wtapf/f mice. B Western blot analysis of WTAP protein levels in WT and KO BMDMs. C m6A dot blot results (top) and methylene blue staining (bottom) in WT and KO BMDMs (200 ng mRNA). Quantitative bar graph was also shown. D Representative flow cytometry plots and the percentage of F4/80+CD206+ macrophages in WT and KO BMDMs with or without IL-4 treatment. E RT-qPCR analysis of alternatively activated macrophage-related genes Arg1, Ym1, and Retnla with or without IL-4 stimulation. F Arg1 protein expression in IL-4 stimulated BMDMs at 0 h, 12 h and 24 h. G Western blot analysis of Arg1 protein levels in peritoneal macrophages with stimulation of IL-4 at 0 h and 24 h. H RT-qPCR analysis of Arg1, Ym1 and Retnla expressions in IL-4 stimulated peritoneal macrophages. The results are representative of 3 independent replications (B and F-G). n = 3 for each group (C, E and H). Data were exhibited as mean ± SEM and analyzed by unpaired Student's t test. *P < 0.05; **P < 0.01; ***P < 0.001.
Human samples
The adipose tissues used in this study were derived from non-obese and obese individuals. Detailed information regarding clinically relevant indicators was provided in Table S1. All subjects exhibited no apparent chronic infection, or history of myocardial infarction. Informed consent was obtained from all the study participants. The human studies were conducted following the NIH guidelines and received approval from the Institutional Review Board (IRB) of Tongji Hospital (TJ-IRB20160601 and TJ-IRB20160602), as well as the Ethics Committee (2022-S-62) of Chengdu Third Hospital.
Western blot and RT-qPCR analysis
Adipose tissues and cultured cells were lysed on ice using the RIPA buffer (Beyotime, Shanghai, China) containing protease inhibitor cocktail (Roche, Indianapolis, IN, USA). The homogenized proteins were separated by 10% SDS-PAGE gels and transferred onto the PVDF membranes. The membranes were then incubated with specific antibodies at a 1:1000 dilution to analyze the protein levels. The primary antibodies used in the research were purchased from Proteintech (Wuhan, China), which included WTAP (10200-1-AP), Arg1 (16001-1-AP), IDH1 (12332-1-AP), IGF2BP1 (22803-1-AP), IGF2BP2 (11601-1-AP), IGF2BP3 (14642-1-AP), Ucp1 (23673-1-AP), Lamin B (12987-1-AP) and β-Actin (66009-1-Ig). The relative gray values of the western blot bands were quantified using ImageJ software (version 1.46r).
Quantitative real-time PCR was performed using the SYBR Premix Ex Taq (TaKaRa, Tokyo, Japan) as previously described [18]. The relative expression levels were calculated for each target gene using the 2-ΔΔCt method. All primers in this study were listed in Table S2.
Flow cytometry analysis
The cells were washed with PBS and incubated with indicated antibodies for 30 min on ice for surface staining. For intracellular markers, the cells were fixed at 4 °C for 30 min using Transcription Factor Buffer Set (562574; BD Biosciences, San Diego, CA, USA). The cells were than stained in Permeabilization Wash Buffer (421002; Biolegend, San Diego, CA, USA) with the relevant antibodies at 4 °C for 30 min. The following antibodies were used for the studies: PE anti-mouse F4/80 (123110), FITC anti-mouse CD11c (117306), APC anti-mouse CD206 (141708), PE/Cyanine7 anti-mouse CD86 Antibody (105014), FITC anti-mouse CD4 (100406), PerCP anti-mouse CD8a (100732), AlexaFluor 647 anti-mouse/rat/human Foxp3 (320014), PE anti-mouse/human CD44 (103008), and APC anti-mouse CD62L (104412), and Pacific Blue anti-mouse I-A/I-E (107620) from Biolegend (San Diego, CA, USA), and PE-Cy7 anti-mouse CD11b (552850) from BD Biosciences (San Diego, CA, USA). The antibody was at 1:200 dilution. The Flow cytometry data were obtained from MACSQuantTM (Miltenyi Biotec, Auburn, CA, USA) and analyzed by the FlowJo software (v10.5.3).
Histological and immunostaining analysis
The tissues were fixed in 4% paraformaldehyde for 24 h at room temperature, and then embedded in paraffin and cut into sections. Deparaffinization and Hematoxylin and Eosin staining were performed following previously established methods [19]. For immunostaining, the sections were dipped in antigen retrieval buffer (10 mM sodium citrate, 0.05% Tween-20, pH 6.0) after deparaffinization, and subjected to high-pressure treatment for 7 min. The sections were then washed with PBS. The tissue sections were subsequently blocked with 5% donkey serum for 1 h at room temperature, followed by incubating with F4/80 (sc-377009; Santa Cruz Biotechnology, Santa Cruz, CA, USA) antibody for 16 h at 4 °C. On the following day, the sections were stained with an AlexaFluor 488-conjugated anti-mouse IgG antibody (Jackson ImmunoResearch Laboratories, West Grove, PA). Images were captured under a fluorescence microscope (OLYMPUS Upright microscope BX53, Olympus Corporation). For Oil Red O staining, the frozen liver sections were handled according to the established techniques [20].
Seahorse assay
After the stimulation of mature BMDMs, metabolic activity was measured for OCR by a Seahorse XFe24 analyzer (Agilent Technologies, Santa Clara, CA, USA). Before conducting the experiment, the cell handling method remained consistent with previous practices. The OCR was measured after treatment with 1.5 μM oligomycin, 1.0 μM FCCP, and 0.5 μM antimycin A/rotenone. Subsequently, the data were normalized by protein concentration, and in-depth analysis was conducted using the XFe Wave software (Agilent Technologies, Santa Clara, CA, USA) as instructed.
MeRIP-qPCR and RIP-qPCR
Two hundred μL of total RNA was sheared into fragments by incubating at 94 °C for 4 min, and then purified on ice after termination with EDTA. Next, the fragmented RNAs were incubated with an m6A antibody- or mouse IgG-conjugated Protein A/G Magnetic Beads at 4 °C for 16-19 h. Finally, the bound methylated RNA on the magnetic beads was competitively eluted out using a high concentration of ethanol at low temperature. All reagents and consumables should be guaranteed to be free of any RNA enzymes. The precipitated RNA was then subjected to qPCR analysis using specific primers. The m6A-IP results were normalized by the corresponding inputs in each sample based on the Cq values. The primer sequences for the m6A site of Idh1 were as follows: forward 5'-GCT TGA TAA CAA TAC TGA GCT CAG C-3'; and reverse 5'-TTA AAG TTT GGC CTG AGC TAA TTT G-3'
RNA stability assay
Actinomycin D (HY-17559; MedChemExpress, Shanghai, China) was added to the cells at a final concentration of 5 μM, and the cells were harvested before or at the indicated time points after adding Actinomycin D. Total cellular RNA was extracted using standard protocols and quantified by RT-qPCR analysis as described earlier.
m6A dot blot
The RNA samples (200 μg for each sample) were heated at 95 °C for 3 min to eliminate secondary structures, followed by rapid cooling on ice. Next, 2 μL of each RNA sample was applied to the surface of a nitrocellulose (NC) membrane and allowed to dry. The RNA was then cross-linked to the membrane by exposure to UV light for 30 min. Subsequently, the membrane was incubated overnight at 4 °C with an m6A antibody. The next day, the membrane was washed three times with TBST, each wash lasted 10 min, and then incubated with the appropriate secondary antibody at room temperature for 1 h. The signal spots were detected using an enhanced chemiluminescence (ECL) kit after washing off the secondary antibody. Finally, methylene blue staining was performed as a loading control.
Luciferase reporter assay
HEK293T cells were evenly seeded into a 24-well plate, followed by transfection with the wild-type or mutant Idh1 reporter plasmids using the Lipofectamine 3000 (L3000015; Invitrogen, Carlsbad, CA) according to the instructions. The cells were collected after 48 h of transfection, and the relative luciferase activities were determined with a Dual Luciferase Reporter Gene Assay Kit (11402ES60, Yeasen, Shanghai, China) according to the manufacturer's instructions.
Statistical analysis
All experimental data in this report were presented as mean ± SEM and were processed by the GraphPad Prism 5 software (GraphPad Software Inc., San Diego, CA). Differences between groups were assessed using unpaired two-tailed Student's t tests or one-way ANOVA. A p value less than 0.05 was considered statistical significance.
Results
Reduced WTAP expression in ATMs correlates with poor metabolic parameters
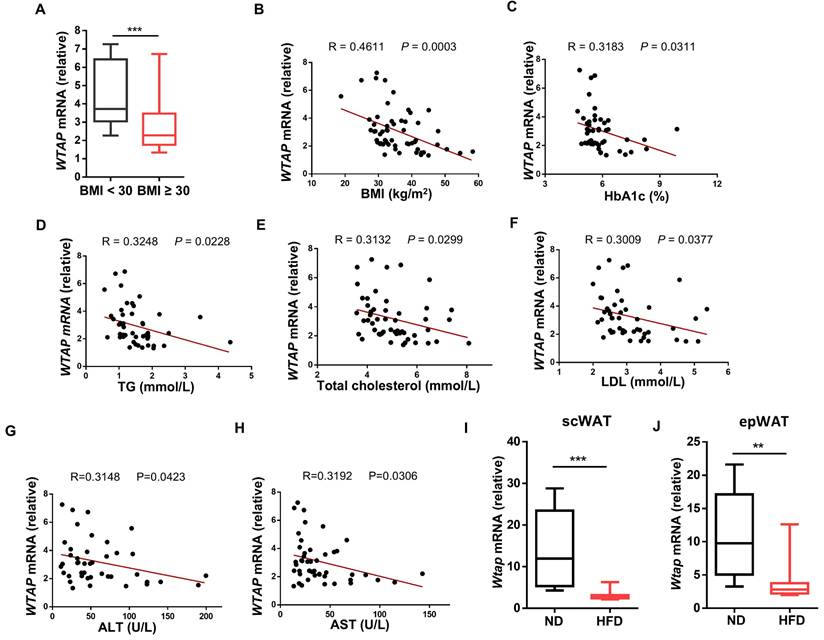
We first examined WTAP expression in ATMs from non-obese (BMI < 30 kg/m2) and obese (BMI ≥ 30 kg/m2) subjects. Notably, obese individuals had a lower expression level of WTAP in ATMs than non-obese individuals (Fig. 1A). We then assessed the correlation between the levels of WTAP and clinical metabolic parameters, and found that WTAP transcriptional levels were inversely associated with BMI (Fig. 1B), serum glycosylated hemoglobin (HbA1c) (Fig. 1C), triglyceride (TG) (Fig. 1D), total cholesterol (Fig. 1E), low-density lipoprotein (LDL) (Fig. 1F), ALT (Fig. 1G), and AST levels (Fig. 1H). To confirm this observation, we fed the C57BL/6 mice with normal diet (ND) or HFD for 12 weeks, and isolated ATMs from subcutaneous white adipose tissue (scWAT) and epididymal white adipose tissue (epWAT) for further analysis. Consistent with the expression profiles in humans, significantly lower Wtap expression was detected in the ATMs from both scWAT and epWAT of obese mice (Fig. 1I, J). Taken together, these results support that ATMs derived from obese subjects and mice are characterized by the decreased WTAP expressions.
WTAP expression is decreased in ATMs and negatively related to clinical metabolic traits. A RT-qPCR analysis of WTAP expression in human ATMs from non-obese and obese individuals. BMI < 30: n = 12 individuals; BMI ≥ 30: n = 46 individuals. B-H Correlation curves between WTAP mRNA expression in human ATMs and clinical metabolic traits: BMI (n = 58), HbA1c (n = 46), TG (n = 49), Total cholesterol (n = 52), LDL (n = 48), ALT (n = 46), and AST (n = 42). I Wtap mRNA expression in ATMs of scWAT from normal (n = 8) and obese (n = 12) mice. J Wtap mRNA expression in ATMs of epWAT from normal (n = 12) and obese (n = 12) mice. Data were exhibited as mean ± SEM and analyzed by unpaired Student's t test and correlation test. **P < 0.01; ***P < 0.001 (A, I-J). Correlation curves were presented by R values and P values (B-H).
Wtap deficiency attenuates the alternatively activated macrophage program
To elucidate the role of WTAP in the development of obesity, we generated a macrophage-specific Wtap knockout mouse model by crossing the Wtapf/f mice with the LysM-Cre mice (the resulting LysM-Cre Wtapf/f mice were defined as KO thereafter), and their Wtapf/f littermates were served as controls (Fig. 2A). Western blot analysis confirmed that WTAP expression was diminished in bone marrow-derived macrophages (BMDMs) from the KO mice relative to their wild-type (WT) littermates (Fig. 2B), and the m6A modification level was significantly decreased in KO BMDMs by dot-blot assays (Fig. 2C). The KO mice survived and grew normally, and displayed similar maturation and activation status of lymphoid cells in the spleen, inguinal lymph nodes (ILNs), and mesenteric lymph nodes (MLNs) (Fig. S1A-D). In addition, the frequencies of dendritic cells (DCs) and macrophages in the bone marrow and spleen from WT and KO mice did not show significant differences, indicating that loss of Wtap did not influence the development and maturation of myeloid cells (Fig. S1E, F).
Next, BMDMs were generated from 8-week-old KO mice and WT controls and subjected to IL-4 stimulation. Wtap deficiency decreased alternative macrophage polarization (Fig. 2D), and Arg1 expression was downregulated in KO BMDMs as compared to WT BMDMs following IL-4 induction (Fig. 2E, F). Similar results were observed for RT-qPCR analysis of Ym1 and Retnla (Fig. 2E). Consistently, the reduced Arg1 expression was also detected in the KO peritoneal macrophages, as well as Ym1 and Retnla mRNA levels (Fig. 2G, H). As obesity is generally associated with increased circulating palmitate, a saturated fatty acid that could activate TLR-mediated pro-inflammatory signaling pathways [21], we further assessed the effect of Wtap deficiency on macrophages in response to palmitate stimulation. Indeed, higher levels of co-stimulatory CD86 expression were noted in KO BMDMs (Fig. S2A). Similarly, an increase of proinflammatory factors was detected in KO BMDMs upon palmitate treatment (Fig. S2B). Furthermore, KO mice demonstrated comparable amounts of total macrophages but CD11c positive ATMs slightly increased in the epWAT as compared to WT controls under normal diet (Fig. S3A-C). Collectively, our data indicate that depletion of Wtap represses the alternative macrophage program in BMDMs.
Loss of Wtap exacerbates HFD-induced obesity and systemic metabolic deterioration
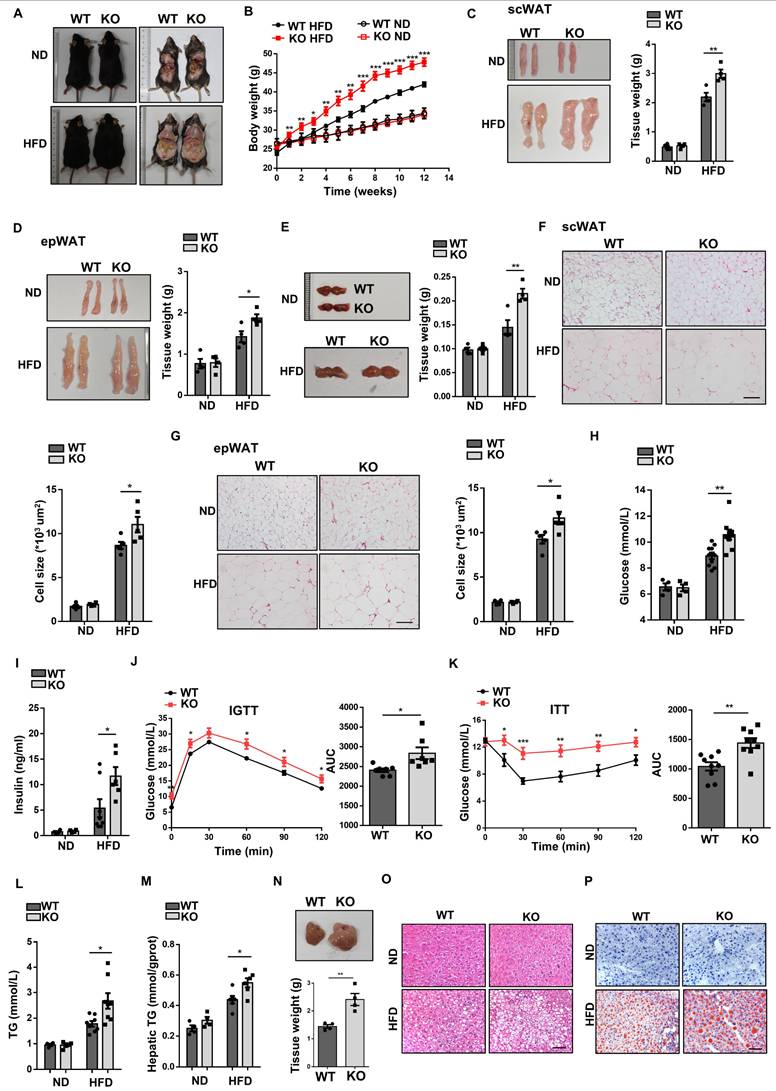
Given the crucial role of macrophages played in the development of obesity, the KO mice and WT littermates were fed with either ND or HFD for 12 weeks. Under ND, no perceptible phenotypical difference was observed between two groups of mice. However, KO mice gained more body weight as compared to WT mice after HFD feeding (Fig. 3A, B), which was correlated with a significant increase of fat-pad weight, including scWAT (Fig. 3C), epWAT (Fig. 3D), and BAT (Fig. 3E). In line with increased fat mass, histological analysis showed larger adipocytes in the WATs of KO mice (Fig. 3F, G). We also observed higher random blood glucose levels and hyperinsulinemia in KO mice (Fig. 3H, I), along with a significant impairment in glucose tolerance (Fig. 3J) and insulin sensitivity (Fig. 3K), although there was no difference between those mice under normal diet (Fig. S4A, B). In addition, we examined the impact of Wtap deficiency on lipid metabolism. The KO mice showed markedly increased plasma and hepatic triglycerides (Fig. 3L, M), higher liver weights (Fig. 3N), as well as higher intrahepatic lipid accumulation as determined by H&E and Oil Red O staining (Fig. 3O, P). Altogether, our results suggest that macrophage-specific Wtap ablation promotes the development of obesity and obesity-associated metabolic deterioration.
Macrophage-specific Wtap ablation exacerbates HFD-induced obesity and systemic metabolic dysfunction. A Physical appearance of WT and KO mice after 12 weeks of feeding on a ND or HFD. Male mice were used. B Body weight changes in every week under ND or HFD conditions (ND: n = 4; HFD: n = 10). C-E Representative images and tissue weights of scWAT (C), epWAT (D) and BAT (E) in WT and KO mice induced by ND or HFD. F-G H&E staining of scWAT and epWAT sections and quantified adipocyte areas. Scale bar: 100 μm. H Random blood glucose levels in WT and KO mice fed with ND or HFD. I Plasma insulin levels in WT and KO mice induced by ND or HFD. J-K Results of intraperitoneal glucose tolerance test (IGTT) and insulin resistance test (ITT) under HFD, including areas under the curves (AUC) analysis. L-M Triglyceride concentrations in plasma (L) and hepatic tissues (M) from WT and KO obese mice. N Representative images and tissue weights of the liver following HFD feeding in WT and KO mice. O-P H&E staining and Oil Red O staining on liver sections from WT and KO mice fed a ND or induced with HFD. Scale bar: 50 μm. Data were presented as mean ± SEM and analyzed by unpaired Student's t test. *P < 0.05; **P < 0.01; ***P < 0.001.
Wtap is required to maintain adipose immune homeostasis in HFD-induced mice
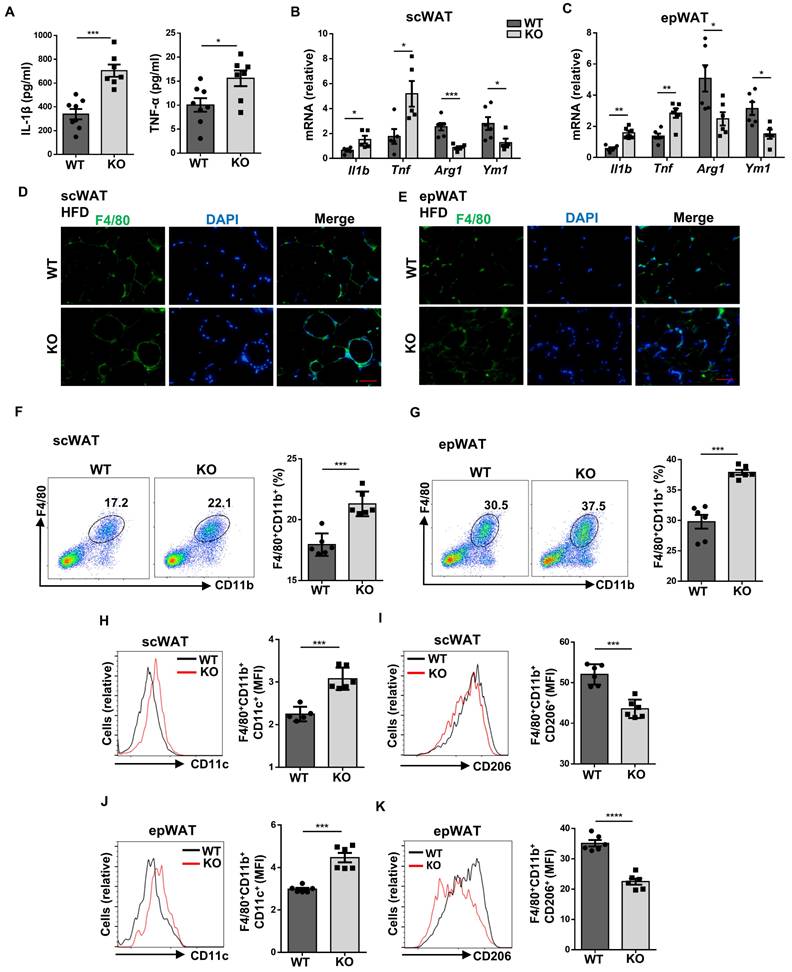
Next, we sought to investigate the effect of Wtap depletion on HFD-induced immune disorders. The levels of pro-inflammatory cytokines IL-1β and TNF-α were significantly higher in the serum of KO mice following HFD challenge (Fig. 4A). Similarly, upregulated Il1b and Tnf, but downregulated Arg1 and Ym1 mRNA levels were detected in the WATs from HFD-fed KO mice (Fig. 4B, C). HFD significantly enhanced the formation of F4/80+ CLSs in the WATs from KO mice as evidenced by the immunostaining (Fig. 4D, E). Flow cytometry analysis of WATs further validated the increased infiltration of macrophages in the KO mice (Fig. 4F, G). Moreover, the KO mice manifested a remarkable reduction of alternatively activated macrophages coupled with an increase of classical activated phenotype both in the scWAT (Fig. 4H, I) and epWAT (Fig. 4J, K). Therefore, Wtap deficiency in macrophages aggravates HFD-induced immune imbalance.
Wtap deficiency causes imbalance of ATMs. A ELISA results of inflammatory cytokines IL-1β and TNF-α in plasma of WT and KO mice under HFD (n = 7). B-C RT-qPCR analysis of presented genes in scWAT and epWAT from WT and KO mice after HFD (n = 5). D-E Immunofluorescence images of F4/80+ crown-like structures in scWAT and epWAT sections. Scale bar: 50 μm. F-G Representative flow cytometry plots and the analysis of total F4/80+CD11b+ macrophages in scWAT and epWAT (n = 6). H-K Expression of CD11c and CD206 in F4/80+CD11b+ macrophages as shown (H, J). The amounts of F4/80+CD11b+CD11c+ and F4/80+CD11b+CD206+ macrophages were quantified and shown as relative mean fluorescence intensity (MFI) (I, K). Data were presented as mean ± SEM and analyzed by unpaired Student's t test. *P < 0.05; **P < 0.01; ***P < 0.001.
Loss of Wtap suppresses energy expenditure and WAT beiging process
Given that ATMs have been well recognized to play a critical role during thermogenesis [22], we thus next examined whether Wtap deficiency in macrophages impacts energy homeostasis. Metabolic assays revealed that HFD challenge rendered the KO mice with significantly lower respiratory exchange ratio (RER) and heat production as compared to that of WT mice (Fig. 5A, B), although they exhibited comparable RER (Fig. S4C) and heat production (Fig. S4D) as control mice once they were under ND condition. Since BAT is the major adipose tissue to dissipate energy, we therefore assumed that the reduced heat production might be attributed to the decline of BAT metabolic activity in the KO mice. Indeed, much higher lipid-droplet content was observed in the BAT of KO mice upon the challenge of HFD (Fig. 5C). Consistently, the KO mice were featured by the decreased expression of the vital thermogenic genes in the BAT, including Cox5a, Cox7a, and Cox8b (Fig. 5D). Notably, similar results were also observed in scWAT (Fig. 5E), suggesting that the beiging process is likely implicated in the repressed energy expenditure conferred by Wtap deficiency as well.
Loss of Wtap downregulates energy expenditure and adipose tissue beiging. A-B Real-time monitoring of RER and heat production in HFD over 24 h for HFD mice, including areas under the curves analysis. C Representative H&E staining images of BAT sections from WT and KO mice with HFD. Scale bar: 100 μm. D-E RT-qPCR results of indicated thermogenesis genes in scWAT and BAT from HFD mice. F Core body temperature records during the initial 6 h of exposure to 4 °C environment (n = 6). G Representative H&E staining images of BAT sections following room temperature or cold stimulation. Scale bar: 50 μm. H-I RT-qPCR and western blot analysis of Ucp1 expression in BAT from WT and KO mice exposed to 4 °C. J Representative H&E staining images of scWAT sections under room temperature or cold condition. Scale bar: 50 μm. K-L RT-qPCR and western blot analysis of Ucp1 expression in scWAT from WT and KO mice with cold stimulation. Male mice were used in cold stimulation mouse model. n = 4 for each group. (I, L) Data were presented as mean ± SEM and analyzed by unpaired Student's t test. *P < 0.05; **P < 0.01; ***P < 0.001.
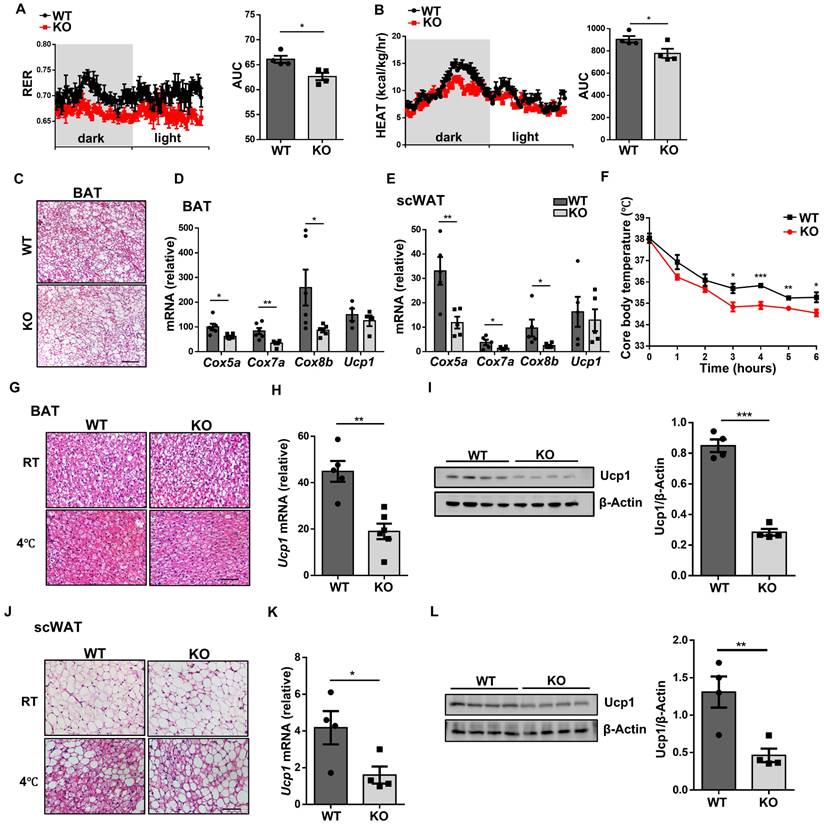
To validate the above assumption, randomly selected KO and WT mice were subjected to cold stimulation (4 °C) as described. It was found that the core body temperatures were lower in KO mice (Fig. 5F), and the KO mice manifested attenuated BAT activity as evidenced by the increased BAT lipid-droplet levels (Fig. 5G) coupled with repressed Ucp1 expressions (Fig. 5H, I). H&E staining of the scWAT sections revealed the formation of multilocular beige adipocytes in WT mice after cold exposure, but it was markedly decreased in the KO mice (Fig. 5J), and scWAT from KO mice displayed a markedly lower Ucp1 expression at both transcriptional and protein levels (Fig. 5K, L). Together, these results demonstrate that Wtap-deficient ATMs limit BAT activity and WAT beiging process during adaptive thermogenesis.
WTAP enhances Idh1 mRNA stability and translation by mediating its m6A modification
To gain insights into the molecular mechanisms by which WTAP modulates ATM program, deep RNA sequencing (RNA-seq) was conducted. As compared to WT BMDMs, the KO BMDMs displayed 1,097 upregulated and 919 downregulated genes (Fig. 6A). Gene ontology (GO) analysis revealed that the differentially expressed genes (DEGs) were enriched in metabolic process (Fig. 6B), among which Idh1 was the most downregulated one, and was then selected for the follow up studies (Fig. 6C). Indeed, RT-qPCR and Western blot confirmed that KO BMDMs were characterized by the attenuated IDH1 expression following IL-4 induction (Fig. 6D, E), but no discernable difference was observed under unstimulated condition. Meanwhile, ATMs from obese individuals had decreased expression of IDH1 as compared to non-obese individuals (Fig. 6F). SRAMP (sequence-based RNA adenosine methylation site predictor) predicted 5 possible m6A modification sites in the Idh1 transcript, with high confidence at sites 3 and 4 (Fig. 6G, H). Therefore, we designed primers covering these two sites to detect the change of m6A levels. Methylated RNA immunoprecipitation (MeRIP)-qPCR analysis revealed that the Idh1 transcripts were effectively enriched by m6A-specific antibody, and m6A modification of Idh1 was remarkably decreased in Wtap deficient BMDMs (Fig. 6I).
Wtap deficiency decreases Idh1 m6A modification and impairs the mRNA stability and translation efficacy. A Heatmap depicting gene expression differences between WT and KO BMDMs. Three biological replicates for each group were included. B GO enrichment analysis of the top six biological process pathways. The abscissa represents the number of enriched genes. C Volcano plot of differential gene expression in metabolic process. D-E RT-qPCR and western blot results of Idh1 expression in WT and KO BMDMs following IL-4 treatment. F RT-qPCR analysis of IDH1 expression in human ATMs from non-obese and obese individuals. BMI < 30: n = 9 individuals; BMI ≥ 30: n = 33 individuals G Five potential predicted Idh1 mRNA modification sites, along with their predicted scores distribution. Red arrows indicate the top-ranked two sites based on the scores. H Schematic representative positions of m6A modification within the transcripts of Idh1. I Abundance of methylated Idh1 transcripts measured in mRNA samples immunoprecipitated with anti-m6A antibody or IgG in WT and KO BMDMs. J RT-qPCR analysis of Idh1 mRNA remaining levels in BMDMs following treatment with 5 μg/ml Actinomycin D for 0 h, 2 h and 4 h. K Wild-type or mutated m6A sequences (A to T mutations) of Idh1 in conjunction with the Renilla luciferase reporter in psiCHECKTM-2 vector. L Relative luciferase activities of HEK293T cells that were transfected with WT or mutant plasmid, and normalized to firefly luciferase activities. M-N RT-qPCR and western blot analysis of IGF2BP1, IGF2BP2 and IGF2BP3 expression in BMDMs. O-P RIP-qPCR analysis of the relative enrichment of Idh1 mRNA combined with IGF2BP2 and IGF2BP3 in WT and KO BMDMs. Results are representative of 3 independent replications (D and N), n = 3 for each group (E, I-J, L-M and O-P) Data were presented as mean ± SEM and analyzed by unpaired Student's t test. *P < 0.05; **P < 0.01; ***P < 0.001.
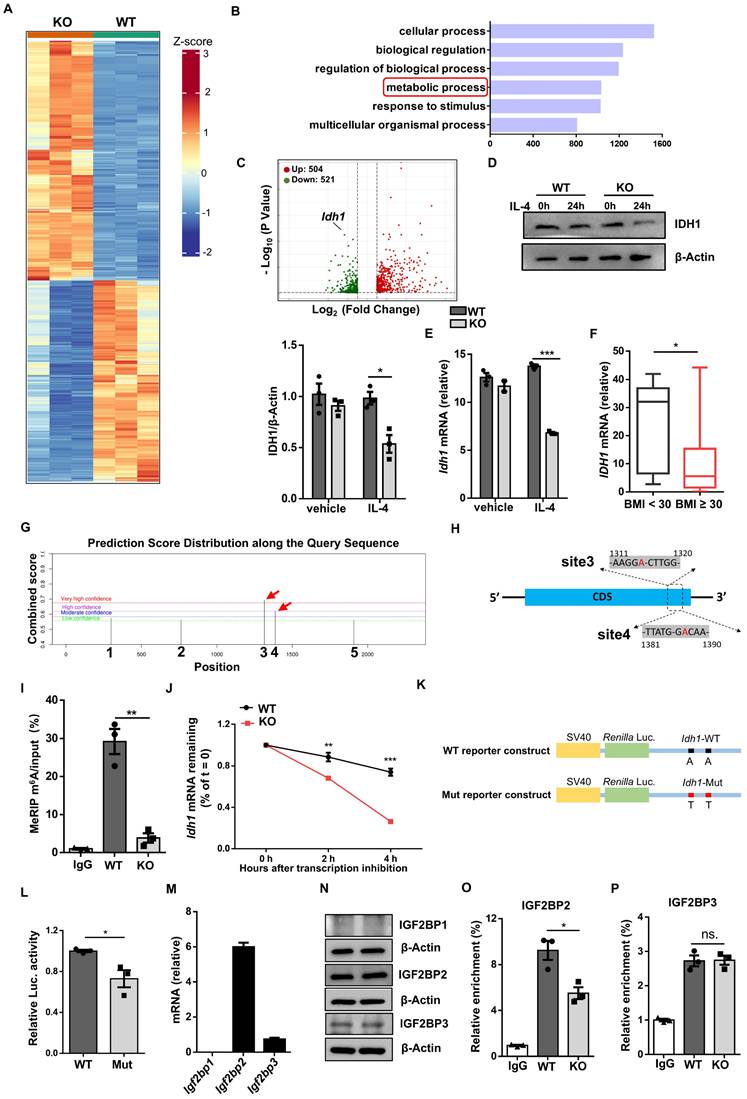
Given that one of the critical features of m6A modification is to regulate mRNA degradation [23], we thus first examined whether WTAP-mediated m6A is involved in Idh1 mRNA stability. Excitingly, RNA decay assays showed that Wtap deficiency significantly decreased the half-life of Idh1 mRNA in BMDMs (Fig. 6J). We then embarked on whether WTAP promotes IDH1 expression at the translational level. For this purpose, we mutated the putative m6A modified adenosines (A) to thymines (T) in the Idh1 mRNA and constructed a reporter plasmid (Fig. 6K). Luciferase reporter assay showed that the luciferase activity of the mutant plasmid was significantly lower than that of WT construct (Fig. 6L), indicating a decreased translation efficiency.
As IGF2BP proteins act as m6A readers to enhance the stability and translation of targeted transcripts [19], we next wondered whether they were associated with the alteration of m6A-modified Idh1. Since IGF2BP1 was almost undetectable in the BMDMs, we thus focused on IGF2BP2/3 (Fig. 6M, N). RIP-qPCR analysis revealed that both IGF2BP2 and IGF2BP3 bound to the regions flanking the above indicated m6A sites, but only IGF2BP2 was associated with Idh1 mRNA less efficiently in KO BMDMs (Fig. 6O, P), suggesting that IGF2BP2 might contribute to m6A-mediated enhancement of Idh1 mRNA stability and translation. To further verify the critical role of IGF2BP2 in these processes, we silenced Igf2bp2 expression in BMDMs (Fig. S5A-B). Notably, the reduced mRNA stability of Idh1 observed in KO BMDMs was effectively rescued upon Igf2bp2 knockdown (Fig. S5C). Meanwhile, when HEK293T cells were co-transfected with either wild-type or mutant plasmids along with IGF2BP2 siRNA, IDH1 translation efficiency exhibited no difference, as demonstrated by the luciferase reporter assay (Fig. S5D-F). Collectively, these results demonstrate that WTAP-mediated m6A regulates Idh1 mRNA stability and translation efficiency to promote its expression.
Wtap promotes IDH1-catalyzed α-KG generation to modulate macrophage program
As GO analysis of RNA-seq data indicated that loss of Wtap resulted in altered pathways relevant to metabolic process, we performed metabolomic assays using WT and KO BMDMs. Consistent with reduced IDH1 expression, a metabolic enzyme responsible for converting isocitrate to α-KG, KO BMDMs were featured by the reduced α-KG levels (Fig. 7A). Although isocitrate and glutamate are both crucial for α-KG production (Fig. S6A) [24], DEGs revealed that other crucial enzymes in generating α-KG were hardly affected between WT and KO BMDMs (Fig. S6B), which were consistent with the RT-qPCR results (Fig. S6C). Alpha-KG assay further confirmed that Wtap deficiency decreased the levels of α-KG both in the cells and culture supernatants (Fig. 7B, C). Moreover, there is feasible evidence that α-KG, as a metabolic regulator, augments fatty acid oxidation (FAO) [25], which would be in favor of alternatively activated macrophage program. We thus next compared oxygen consumption rate (OCR) between WT and KO macrophages. The KO BMDMs displayed markedly lower basal mitochondrial OCR, maximal respiration capability, and spare respiratory capacity (SRC) following IL-4 induction (Fig. 7D, E), indicating a decreased commitment to oxidative phosphorylation (OXPHOS).
Wtap promotes IDH1-catalyzed α-KG generation to modulate macrophage plasticity. A Scatter plot of differential metabolites from metabolomics analysis, with each point representing a single metabolite. Four biological replicates for each group were included. B-C Alpha-KG concentrations in cells and culture supernatants of WT and KO BMDMs. D Oxygen consumption rate (OCR) of BMDMs from WT and KO mice stimulated by IL-4 with treatment of oligomycin, FCCP, rotenone, and antimycin A. E Quantitative statistics of basal mitochondria OCR, maximal respiration capacity and spare respiratory capacity (SRC) in WT and KO BMDMs. F Expression of CD206 in F4/80+ macrophages in WT and KO BMDMs stimulated by IL-4 with or without supplementation of α-KG. G Western blot analysis of Arg1 protein levels in BMDMs with indicated treatment groups. H RT-qPCR analysis of Arg1, Ym1 and Retnla expression in BMDMs under indicated conditions. I OCR of IL-4 stimulated BMDMs from WT and KO mice with addition of α-KG or not under treatment of oligomycin, FCCP, rotenone, and antimycin A. J Quantitative analysis of basal OCR, maximal OCR and SRC in WT and KO BMDMs. n = 3 for each group (B-E and H-J). Results are representative of 3 independent replications (F). Alpha-KG: 100 nmol/ml (F-J). Data were presented as mean ± SEM and analyzed by unpaired Student's t test. ns. no significance; *P < 0.05; **P < 0.01; ***P < 0.001.
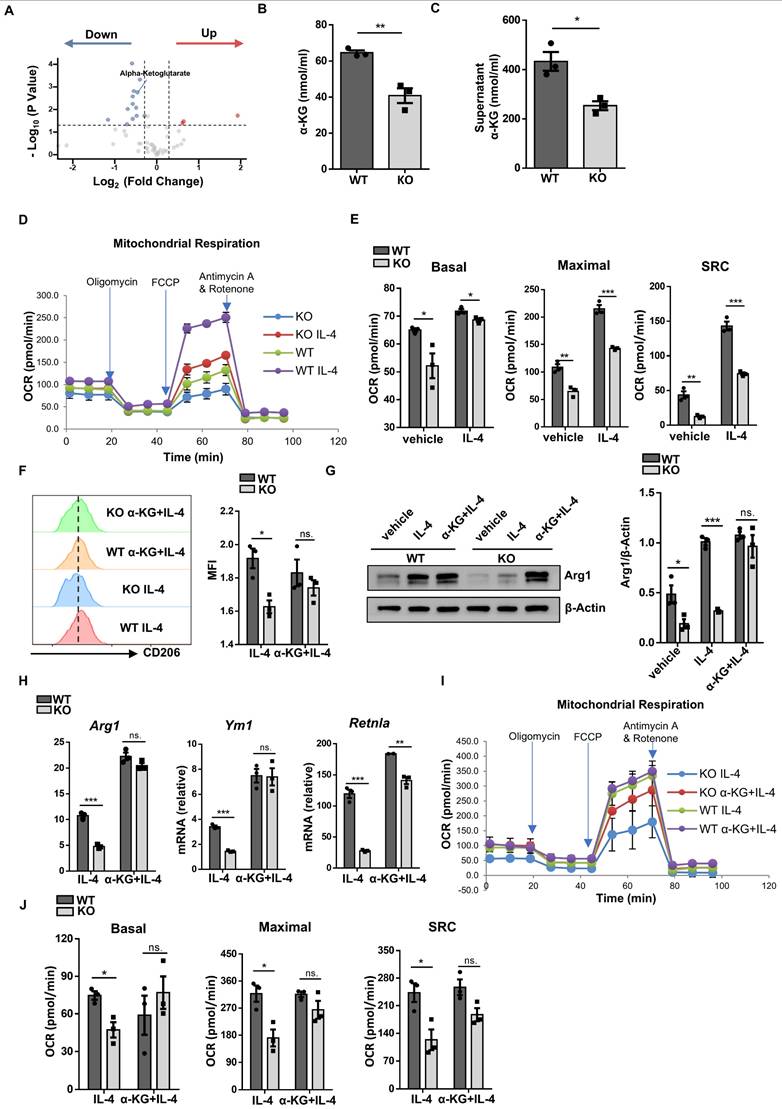
Finally, a rescue experiment was performed by adding α-KG into the BMDM culture supernatants. Supplement of α-KG completely restored the expression of CD206 (Fig. 7F), Arg1 (Fig. 7G, H), and other alternatively activated macrophage markers (Fig. 7H). Consistently, in the presence of α-KG, KO BMDMs manifested comparative basal mitochondrial OCR, maximal respiration capability, and SRC as that of WT BMDMs (Fig. 7I, J). Taken together, these data support that Wtap depletion downregulates IDH1-catalyzed α-KG production, thereby impacting OXPHOS to attenuate IL-4 stimulated macrophage program.
Discussion
m6A is the most prevalent mRNA modification in eukaryotes. Studies on m6A indicate that it has a vital impact on a variety of physiological and pathological processes, including stem-cell pluripotency, brain function, immune response and tumorigenesis [23]. Of note, studies also suggested that METTL3 promotes macrophage activation by modulating STAT1 [26] and IRKAM signaling [27]. However, controversial results were also reported with different stimulation and status. For example, METTL3 was noted capable of inhibiting macrophage M2 program as well once it targets on Trib1/ERK/STAT3 signaling [28]. Given the critical role of macrophages in the maintenance of immune homeostasis in adipose tissues, the exact impact of m6A on adipose macrophages, particularly on their program under obese settings, warrants further investigations. In the present report, we provided convincing evidence demonstrating a role of WTAP-mediated m6A modification in the maintenance of macrophage homeostasis, in which loss of Wtap in macrophages exacerbated HFD-induced obesity.
In general, epitranscriptomic factors and metabolic pathways contribute to the regulation of macrophage polarization and functional plasticity [29], while the mechanisms by which macrophages integrate these intricate networks are still largely unknown. As a regulatory subunit of RNA methyltransferase complex, WTAP-mediated m6A modification constitutes an epitranscriptomic layer of regulation to guarantee the macrophage program. Our RNA-seq data revealed significant changes of many metabolism-related genes in Wtap deficient macrophages. Among those, Idh1 was the most significantly downregulated gene. IDH1 is a crucial enzyme for the tricarboxylic acid (TCA) cycle and catalyzes oxidative decarboxylation of isocitrate to α-KG. Using MeRIP-qPCR, we confirmed that Idh1 mRNA is the target of WTAP-mediated m6A modification. Loss of Wtap reduced Idh1 mRNA stability and its translation efficiency, thereby contributing to the decline of its mRNA and protein expression levels. The recognition and interpretation of m6A modification rely on its reader proteins, YTHDFs and IGF2BPs. The binding of YTHDFs leads to the localization of their target mRNAs from the translatable pool to cellular RNA decay sites [30]. Therefore, mRNA levels tend to be upregulated when m6A abundance is decreased in the YTHDF2-mediated decay pathway. In contrast to the mRNA decay-promoting function of YTHDFs, IGF2BPs preferentially enhance the stability and translation of bound mRNA [19]. In line with these previous reports, the consensus GG(m6A)C sequence-containing regions in the Idh1 transcript were highly bound by IGF2BP2 that decreased remarkably upon Wtap ablation, indicating a role of IGF2BP2 in promoting the stability and translation of Idh1 mRNA.
Metabolomic profiling showed that Wtap deficiency changed the levels of several important metabolic intermediates in macrophages. TCA cycle intermediate α-KG was one of the most significantly downregulated metabolites in macrophages deficient in Wtap, which was in line with the reduced expression of IDH1. Alpha-KG was previously demonstrated to be a cofactor of the JMJD3 histone demethylase that targets H3K27me3 [25]. Moreover, it is important to note that α-KG serves as a metabolic regulator that governs the engagement of OXPHOS. Notably, accumulated evidence indicates that macrophages with an alternatively activated phenotype possess an intact TCA cycle, and prefer oxidative metabolism, particularly FAO, to support their energy demand [31, 32]. Indeed, Wtap deficient macrophages exhibited significantly lower OXPHOS than those of WT macrophages in the presence of IL-4, as evidenced by the decreased OCR. Consistently, α-KG supplementation almost completely rescued the alteration of oxidative metabolism, supporting that Wtap deficiency impairs macrophage program at least in part by hampering IDH1-regulated α-KG production.
Previous studies also suggested a critical role for α-KG in adipocyte activity. Specifically, α-KG was noted capable of facilitating TET-mediated DNA demethylation in the Prdm16 promoter, which is required for the progenitor commitment to brown adipocyte differentiation [33]. Alpha-KG not only increases the expression of thermogenic genes (i.e., Ucp1, Dio2, and Cidea) in the BAT, but also enhances lipolysis in the WATs through OXGR1-dependent adrenal activation, and as a result, administration of exogenous α-KG prevents HFD-induced obesity in mice [34]. In line with these observations, human plasma α-KG levels are inversely associated with several metabolic risk factors, including body weight, BMI, waist circumference, and hip circumference [35]. These published results, together with our data, support that α-KG could be a viable metabolite against obesity in clinical settings. However, population-based studies would be necessary to prove the clinical benefits.
It is worthy of note, we failed to detect a significant difference between WT and KO mice under normal diet, while significant alterations were observed upon HFD challenge. This discrepant outcome suggests that the functional role of WTAP may become critical under metabolic stress. Similar as DNA methylation, RNA methylation levels would not change under physiological conditions, while HFD-induced metabolic stress would be coupled with an RNA methylation turnover as manifested by the change of RNA methylation levels and/or patterns [36]. WTAP acts as a critical cofactor for RNA methylation, its deficiency would significantly impair the HFD-induced RNA methylation turnover, which would, therefore, lead to the presence of related metabolic phenotypes.
In summary, we demonstrated convincing evidence that ATMs originating from obese subjects are characterized by the reduced WTAP expression. Studies in animal models illustrated that loss of Wtap restricts alternatively activated macrophage program. As a result, mice with macrophages deficient in Wtap manifest aggravated obesity following HFD challenge. Mechanistically, WTAP-mediated m6A of Idh1 mRNA promotes its stability and translation efficiency, thereby increasing isocitrate catabolism to produce α-KG. Alpha-KG further modulates metabolic reprogramming essential for macrophage polarization. Our results provide insights into the role of WTAP-mediated m6A modification in macrophage functional plasticity, which may help to identify novel therapeutic targets against obesity and other metabolic diseases in clinical settings.
Abbreviations
m6A: N6-methyladenosine; WTAP: Wilms tumor 1-associated protein; IDH1: isocitrate dehydrogenase 1; ATMs: adipose tissue macrophages; scWAT: subcutaneous white adipose tissue; epWAT: epididymal white adipose tissue; BMDM: bone marrow derived macrophage; HFD: high-fat diet; ND: normal diet; BAT: brown adipose tissue; CLSs: crown-like structures; RER: respiratory exchange ratio; Ucp1: Uncoupling protein1; MeRIP: methylated RNA immunoprecipitation; IGF2BPs: insulin-like growth factor 2 mRNA binding proteins; DEGs: differentially expressed genes; OCR: oxygen consumption rate; SRC: spare respiratory capacity; OXPHOS: oxidative phosphorylation; α-KG: α-ketoglutarate; TCA cycle: tricarboxylic acid cycle.
Supplementary Material
Supplementary figures and tables.
Acknowledgements
We would like to express our gratitude to Danni Song and Wenye Mo from the Center for Biomedical Research, Tongji Hospital, Tongji Medical College, Huazhong University of Science and Technology for their help with our study.
Funding
This work was supported by the Noncommunicable Chronic Diseases-National Science and Technology Major Project (2023ZD0507302), the National Key R&D Program of China (2022YFA0806101), the National Natural Science Foundation of China (81920108009, 82130023, 82470877, 82300929, 82300948, 82301753, 82200923, 82270885, 82200926, 82270893, 82100892, 82270893, 82401031, and 82100823), the Postdoctoral Science Foundation of China (54000-0106540081 and 54000-0106540080), the Research and Innovative Team Project for Scientific Breakthroughs at Shanxi Bethune Hospital (2024AOXIANG03), the Continuous Funding Program for High-Level Research Achievements at Shanxi Bethune Hospital (2024GSPYJ10).
Ethics declarations
All protocols for animal studies were approved by the Tongji Hospital Animal Care and Use Committee (TJH-202206021) in accordance with the National Institutes of Health (NIH) guidelines. All studies in humans were conducted in accordance with the NIH guidelines and were approved by the Institutional Review Board (IRB) of Tongji Hospital (TJ-IRB20160601 and TJ-IRB20160602), as well as the Ethics Committee (2022-S-62) of Chengdu Third Hospital.
Author contributions
QX, JZ and YZ were responsible for the major experiments and data analyses, as well as writing the manuscript. LC and FS assisted western blot, histological analysis, animal breeding, bioinformatic analysis, real-time PCR and immunostaining. XL and TW provided assistances in seahorse experiments. YL, SZ and FX provided help for animal breeding, bioinformatic analysis and real-time PCR. QY, PY and QG were involved in study design and review of the manuscript. SL and C-YW contributed to the study design and manuscript preparation. All authors participated in drafting the article or revising the manuscript critically, and all authors have read and approved the article.
Competing Interests
The authors have declared that no competing interest exists.
References
1. Rohm TV, Castellani Gomes Dos Reis F, Isaac R, Murphy C, Cunha E Rocha K, Bandyopadhyay G. et al. Adipose tissue macrophages secrete small extracellular vesicles that mediate rosiglitazone-induced insulin sensitization. Nat Metab. 2024;6:880-98
2. Wu Y, Wu C, Shi T, Cai Q, Wang T, Xiong Y. et al. FAP expression in adipose tissue macrophages promotes obesity and metabolic inflammation. Proc Natl Acad Sci U S A. 2023;120:e2303075120
3. Weisberg SP, McCann D, Desai M, Rosenbaum M, Leibel RL, Ferrante AW. Obesity is associated with macrophage accumulation in adipose tissue. J Clin Invest. 2003;112:1796-808
4. Shan B, Wang X, Wu Y, Xu C, Xia Z, Dai J. et al. The metabolic ER stress sensor IRE1α suppresses alternative activation of macrophages and impairs energy expenditure in obesity. Nat Immunol. 2017;18:519-29
5. Lumeng CN, Bodzin JL, Saltiel AR. Obesity induces a phenotypic switch in adipose tissue macrophage polarization. J Clin Invest. 2007;117:175-84
6. Chen L, Zhang J, Zou Y, Wang F, Li J, Sun F. et al. Kdm2a deficiency in macrophages enhances thermogenesis to protect mice against HFD-induced obesity by enhancing H3K36me2 at the Pparg locus. Cell Death Differ. 2021;28:1880-99
7. Wang Y-N, Tang Y, He Z, Ma H, Wang L, Liu Y. et al. Slit3 secreted from M2-like macrophages increases sympathetic activity and thermogenesis in adipose tissue. Nat Metab. 2021;3:1536-51
8. Baek A, Lee G-E, Golconda S, Rayhan A, Manganaris AA, Chen S. et al. Single-molecule epitranscriptomic analysis of full-length HIV-1 RNAs reveals functional roles of site-specific m6As. Nat Microbiol. 2024
9. Wang H, Hu X, Huang M, Liu J, Gu Y, Ma L. et al. Mettl3-mediated mRNA m6A methylation promotes dendritic cell activation. Nat Commun. 2019;10:1898
10. Xiong J, He J, Zhu J, Pan J, Liao W, Ye H. et al. Lactylation-driven METTL3-mediated RNA m6A modification promotes immunosuppression of tumor-infiltrating myeloid cells. Mol Cell. 2022 82
11. Zaccara S, Ries RJ, Jaffrey SR. Reading, writing and erasing mRNA methylation. Nat Rev Mol Cell Biol. 2019;20:608-24
12. Berulava T, Buchholz E, Elerdashvili V, Pena T, Islam MR, Lbik D. et al. Changes in m6A RNA methylation contribute to heart failure progression by modulating translation. Eur J Heart Fail. 2020;22:54-66
13. De Jesus DF, Zhang Z, Kahraman S, Brown NK, Chen M, Hu J. et al. m6A mRNA Methylation Regulates Human β-Cell Biology in Physiological States and in Type 2 Diabetes. Nat Metab. 2019;1:765-74
14. Wang Y, Gao M, Zhu F, Li X, Yang Y, Yan Q. et al. METTL3 is essential for postnatal development of brown adipose tissue and energy expenditure in mice. Nat Commun. 2020;11:1648
15. Zhu X, Tang H, Yang M, Yin K. N6-methyladenosine in macrophage function: a novel target for metabolic diseases. Trends Endocrinol Metab. 2023;34:66-84
16. Constant VA, Gagnon A, Yarmo M, Sorisky A. The antiadipogenic effect of macrophage-conditioned medium depends on ERK1/2 activation. Metabolism. 2008;57:465-72
17. Liu S, Yang J, Wu Z. The Regulatory Role of α-Ketoglutarate Metabolism in Macrophages. Mediators Inflamm. 2021;2021:5577577
18. Zhang J, Zou Y, Chen L, Sun F, Xu Q, Zhou Q. et al. Myo9b mutations are associated with altered dendritic cell functions and increased susceptibility to autoimmune diabetes onset. Nat Commun. 2023;14:5977
19. Huang H, Weng H, Sun W, Qin X, Shi H, Wu H. et al. Recognition of RNA N6-methyladenosine by IGF2BP proteins enhances mRNA stability and translation. Nat Cell Biol. 2018;20:285-95
20. Huang T, Song J, Gao J, Cheng J, Xie H, Zhang L. et al. Adipocyte-derived kynurenine promotes obesity and insulin resistance by activating the AhR/STAT3/IL-6 signaling. Nat Commun. 2022;13:3489
21. Huang S, Rutkowsky JM, Snodgrass RG, Ono-Moore KD, Schneider DA, Newman JW. et al. Saturated fatty acids activate TLR-mediated proinflammatory signaling pathways. J Lipid Res. 2012;53:2002-13
22. Rosina M, Ceci V, Turchi R, Chuan L, Borcherding N, Sciarretta F. et al. Ejection of damaged mitochondria and their removal by macrophages ensure efficient thermogenesis in brown adipose tissue. Cell Metab. 2022 34
23. Boulias K, Greer EL. Biological roles of adenine methylation in RNA. Nat Rev Genet. 2023;24:143-60
24. He J, Li F, Zhou Y, Hou X, Liu S, Li X. et al. LncRNA XLOC_006390 promotes pancreatic carcinogenesis and glutamate metabolism by stabilizing c-Myc. Cancer Lett. 2020;469:419-28
25. Liu P-S, Wang H, Li X, Chao T, Teav T, Christen S. et al. α-ketoglutarate orchestrates macrophage activation through metabolic and epigenetic reprogramming. Nat Immunol. 2017;18:985-94
26. Liu Y, Liu Z, Tang H, Shen Y, Gong Z, Xie N. et al. The N6-methyladenosine (m6A)-forming enzyme METTL3 facilitates M1 macrophage polarization through the methylation of STAT1 mRNA. Am J Physiol Cell Physiol. 2019;317:C762-C75
27. Tong J, Wang X, Liu Y, Ren X, Wang A, Chen Z. et al. Pooled CRISPR screening identifies m6A as a positive regulator of macrophage activation. Sci Adv. 2021 7
28. Gou Y, Wang H, Wang T, Wang H, Wang B, Jiao N. et al. Ectopic endometriotic stromal cells-derived lactate induces M2 macrophage polarization via Mettl3/Trib1/ERK/STAT3 signalling pathway in endometriosis. Immunology. 2023;168:389-402
29. Amit I, Winter DR, Jung S. The role of the local environment and epigenetics in shaping macrophage identity and their effect on tissue homeostasis. Nat Immunol. 2016;17:18-25
30. Wang X, Lu Z, Gomez A, Hon GC, Yue Y, Han D. et al. N6-methyladenosine-dependent regulation of messenger RNA stability. Nature. 2014;505:117-20
31. Huang SC-C, Everts B, Ivanova Y, O'Sullivan D, Nascimento M, Smith AM. et al. Cell-intrinsic lysosomal lipolysis is essential for alternative activation of macrophages. Nat Immunol. 2014;15:846-55
32. Vats D, Mukundan L, Odegaard JI, Zhang L, Smith KL, Morel CR. et al. Oxidative metabolism and PGC-1beta attenuate macrophage-mediated inflammation. Cell Metab. 2006;4:13-24
33. Yang Q, Liang X, Sun X, Zhang L, Fu X, Rogers CJ. et al. AMPK/α-Ketoglutarate Axis Dynamically Mediates DNA Demethylation in the Prdm16 Promoter and Brown Adipogenesis. Cell Metab. 2016;24:542-54
34. Yuan Y, Xu P, Jiang Q, Cai X, Wang T, Peng W. et al. Exercise-induced α-ketoglutaric acid stimulates muscle hypertrophy and fat loss through OXGR1-dependent adrenal activation. EMBO J. 2020;39:e103304
35. Tian Q, Zhao J, Yang Q, Wang B, Deavila JM, Zhu M-J. et al. Dietary alpha-ketoglutarate promotes beige adipogenesis and prevents obesity in middle-aged mice. Aging Cell. 2020;19:e13059
36. Cheng J, Song J, He X, Zhang M, Hu S, Zhang S. et al. Loss of Mbd2 Protects Mice Against High-Fat Diet-Induced Obesity and Insulin Resistance by Regulating the Homeostasis of Energy Storage and Expenditure. Diabetes. 2016;65:3384-95
Author contact
![]() Corresponding authors: Dr. Cong-Yi Wang (wangcyTjmu.edu.cn or cwangedu.qa) and Dr. Shi-Wei Liu (lswspring6com).
Corresponding authors: Dr. Cong-Yi Wang (wangcyTjmu.edu.cn or cwangedu.qa) and Dr. Shi-Wei Liu (lswspring6com).