Impact Factor ISSN: 1449-2288

 Global reach, higher impact
Int J Biol Sci 2009; 5(4):351-365. doi:10.7150/ijbs.5.351 This issue Cite
Research Paper
Characterization of the complete mitochondrial genome of the giant silkworm moth, Eriogyna pyretorum (Lepidoptera: Saturniidae)
Shao-Tong Jiang1,#, Gui-Yun Hong1,2,#, Miao Yu1, Na Li1, Ying Yang1,2, Yan-Qun Liu3, Zhao-Jun Wei1 ![]()
1. Department of Biotechnology, Hefei University of Technology, Hefei 230009, People's Republic of China
2. Department of Environmental engineering, Anhui University of Architecture, Hefei 230601, People's Republic of China
3. Department of Sericulture, College of Bioscience and Biotechnology, Shenyang Agricultural University, Shenyang 110161, People's Republic of China
# Co-first authors
Received 2009-2-21; Accepted 2009-5-16; Published 2009-5-22
Abstract
The complete mitochondrial genome (mitogenome) of Eriogyna pyretorum (Lepidoptera: Saturniidae) was determined as being composed of 15,327 base pairs (bp), including 13 protein-coding genes (PCGs), 2 rRNA genes, 22 tRNA genes, and a control region. The arrangement of the PCGs is the same as that found in the other sequenced lepidopteran. The AT skewness for the E. pyretorum mitogenome is slightly negative (-0.031), indicating the occurrence of more Ts than As. The nucleotide composition of the E. pyretorum mitogenome is also biased toward A + T nucleotides (80.82%). All PCGs are initiated by ATN codons, except for cytochrome c oxidase subunit 1 and 2 (cox1 and cox2). Two of the 13 PCGs harbor the incomplete termination codon by T. All tRNA genes have a typical clover-leaf structure of mitochondrial tRNA, with the exception of trnS1(AGN) and trnS2(UCN). Phylogenetic analysis among the available lepidopteran species supports the current morphology-based hypothesis that Bombycoidea, Geometroidea, Notodontidea, Papilionoidea and Pyraloidea are monophyletic. As has been previously suggested, Bombycidae (Bombyx mori and Bombyx mandarina), Sphingoidae (Manduca sexta) and Saturniidae (Antheraea pernyi, Antheraea yamamai, E. pyretorum and Caligula boisduvalii) formed a group.
Keywords: Eriogyna pyretorum, mitochondrial genome, Lepidoptera Saturniidae
1. Introduction
The giant silkworm moth, E. pyretorum is a member of the Saturniidae family (superfamily Bombycoidea), which spread over mainly in Burma, China, India, Malaysia and Vietnam. E. pyretorum has attracted a great deal of attention for its silk-producing character [1]. Economically important silk-producing insects of order Lepidoptera belong mainly to two families, Bombycidae and Saturniidae [2]. Non-mulberry feeding silkmoths belonging to the family Saturniidae are mostly wild silkmoths. Among Saturniids the most well-known species are C. boisduvalii, E. pyretorum, A. pernyi and A. yamamai belonging to the family Saturniidae, which are used for silk production and spread over mainly China, India, and Japan [3]. Phylogenetic relationships of silkmoths have been investigated using several molecular markers, such as of the nuclear arylphorin [4] and rRNA [5] genes, or single [6] and concatenated sets of mitochondrial genes [7], although more species must be evaluated in order to obtain a more complete picture of the relationships among the silkmoths [7].
Mitogenome of metazoan animals is a double-stranded, circular molecule, ranging in size from 14 to 19 kb, which contains 37 genes including 13 PCGs (subunits 6 and 8 of the ATPase [atp6 and atp8], cytochrome c oxidase subunits 1-3 [cox1-cox3], cytochrome B [cob], and NADH dehydrogenase subunits 1-6 and 4L [nad1-6 and nad4L]), 2 ribosomal RNA genes (small- and large-subunit rRNAs [rrnL and rrnS]), and 22 tRNA genes. Additionally, it contains a control region of variable length known as the A+T-rich region in insects [8]. Mitogenomes are very important subject for different scientific disciplines including comparative and evolutionary genomics, molecular evolution, phylogenetics and population genetics [9].
To date, the complete or near-complete mitogenome have been sequenced from 120 insect species (http://www.ncbi.nlm.nih.gov). Within the order Lepidoptera, only 13 complete or near-complete mitogenomes were sequenced [2, 7, 10-19], and the covered taxon-sampling is extremely poor and limited to six superfamiles among the 45-48 known, and to 9 families of the recognized 120 (Table 1). A better understanding of the lepidopteran mitogenome requires an expansion of taxon and genome samplings. In the present study, we have sequenced the complete mitogenome of the giant silkworm moth E. pyretorum (accession number: FJ685653).
List of complete mitochondrial genome of Lepidoptera
| species | length (bp) | accession number | references |
|---|---|---|---|
| Bombyx mori | 15, 656 | AB070264 | [2] |
| Japanese Bombyx mandarina | 15, 928 | NC_003395 | [2] |
| Chinese B. mandarina | 15, 682 | AY301620 | [10] |
| Caligula boisduvalii | 15, 360 | NC_010613 | [7] |
| Antheraea pernyi | 15, 575 | AY242996 | [11] |
| Antheraea yamamai | 15, 338 | EU726630 | [12] |
| Maduca sexta | 15, 516 | EU286785 | [13] |
| Ostrinia furnacalis | 14, 536 | NC_003368 | [14] |
| Ostrinia nubilalis | 14, 535 | NC_003367 | [14] |
| Artogeia melete | 15, 140 | EU597124 | [19] |
| Adoxophyes honmai | 15, 680 | NC_008141 | [15] |
| Coreana raphaelis | 15, 314 | NC_007976 | [16] |
| Ochrogaste lunifer | 15, 593 | AM946601 | [17] |
| Phthonandria atrilineata | 15, 499 | EU569764 | [18] |
In this study, we describe the complete mitogenome sequence of the E. pyretorum, that is compared with those of other lepidopteran species. Furthermore, the concatenated nucleotide and amino acids sequences of 13 PCGs of E. pyretorum were utilized to assess the phylogenetic relationships among lepidopteran superfamilies.
2. Materials and methods
Specimens sampling and mitochondrial DNA extraction
Larval of E. pyretorum was collected from the Sericultural Research Institute of Guangxi provice. DNA was extracted using the TaKaRa Genomic DNA Extraction Kit (TaKaRa Co., Dalian, China) in accordance with the manufacturer's instructions.
Primer design, PCR, cloning and sequencing
Twenty primers (Table 2) were synthesized (Shanghai Sangon Biotechnology Co., Ltd., Shanghai, China) to amplify the whole mitogenome of E. pyretorum. The primers 16SAA and 16SBB were designed followed the description by Hwang et al (2001) [20]. The other degenerate and specific primers were designed based on the conserved nucleotide sequences of the known mitochondrial sequences in Lepidoptera [2, 7, 10-19] or on the known sequence of fragments of the mitogenome of E. pyretorum that we have previously sequenced (accession number: EF206703 and DQ323517). The primers 16SAA and 16SBB were used for the amplification of the long fragment (14 kb) of the mitogenome [20], which were in turn used as template to amplify the fragments of ER1-10. The conditions for the amplification of the long fragment are as follows: an initial denaturation for 2 min at 96 °C, followed by 30 cycles of 10 s at 98 °C and 10 min at 58 °C, and a subsequent 10 min final extension at 72 °C.
The primers used in this study
| Fragment | Region | Primer pair | Primer sequence (5' →3') | Size (kb) |
|---|---|---|---|---|
| ER1 | nad2→cox1 | ER 1F | TGATTTGGDTGTTGAATTGGHYTAGAA | 1.6 |
| ER 1R | GCTCCTAAGATTGAAGAAATACCAGC | |||
| ER 2 | cox1→cox2 | ER 2F | TGGAGCAGGAACAGGATGAAC | 2.0 |
| ER 2R | GAGACCADTACTTGCTTTCAG | |||
| ER 3 | cox2→cox3 | ER 3F | ATTTGTGGAGCTAATCATAG | 1.1 |
| ER 3R | GGTCAGGGWCTATAATCYAC | |||
| ER 4 | cox3→nad3 | ER 4F | TCGACCTGGAACTTTAGC | 1.2 |
| ER 4R | TGGATCAAATCCACATTCA | |||
| ER 5 | nad3→nad5 | ER 5F | GAAGCAGCTGCTTGATATTGACA | 2.0 |
| ER 5R | GCAGCTATAGCCGCTCCTACTCCAGT | |||
| ER 6 | nad5→nad4 | ER 6F | CCCCTGCAGTTACTAAAGTTGAAG | 1.7 |
| ER 6R | CAACCTGAACGTGTACAAGCAGGAA | |||
| ER 7 | nad4→cob | ER 7F | GGAGCTTCTACATGAGCTTTTGG | 2.0 |
| ER 7R | GTCCTCAAGGTAGAACATAACC | |||
| ER 8 | cob→rrnL | ER 8F | CGTACTCTTCATGCAAATGGAGC | 2.2 |
| 16SBBa | CTTATCGAYAAAAAAGWTTGCGACCTC GATGTTG | |||
| ER 9 | rrnL→rrnL | ER 9F | CGGTTTGAACTCAGA TCATGTAAG | 1.1 |
| ER 9R | TATTGTATCTTGTGTATCAGAGTTTA | |||
| ER 10 | rrnL→nad2 | 16SAAa | ATGCTACCTTTGCACRGTCAAGATACYGCGGC | 3.1 |
| ER 10R | TCAAAAATGGAAAGGGGCTGAACCTAT |
a. Primers from Hwang et al [20].
The fragments of ER1-10 that range from 1.1 kb to 3.1 kb (Table 2) were amplified using the TaKaRa LA Taq (TaKaRa Co., Dalian, China) and the following PCR conditions: an initial denaturation for 2 min at 96°C, followed by 30 cycles of 10 s at 98 °C and 2 min at 58 °C, and a subsequent 10 min final extension at 72 °C. The above PCR products were separated by electrophoresis in a 1% agarose gel and purified using a DNA gel extraction kit (TaKaRa Co., Dalian, China). The purified PCR product was ligated into T-vector (TaKaRa Co., Dalian, China) and then transformed into XL-1 blue competent bacteria according to the method of Wei et al. (2008) [21]. The positive recombinant clone with an insert was sequenced using the dideoxynucleotide chain termination method (TaKaRa Co., Dalian, China) at least three times.
Sequence assembly and gene annotation
Protein-encoding genes (PCGs) of the E. pyretorum mitochondrial genes were identified by sequence similarity with A. pernyi [11]. Sequence annotation was performed using the DNAStar package (DNAStar Inc. Madison, USA) and the online blast tools available through the NCBI web site [22]. The nucleotide sequences of PCGs were translated on the basis of invertebrate mitogenome genetic code. Alignments of the PCGs for each of the available lepidopteran mitogenomes were made in MEGA ver 4.0 [23]. Composition skewness was calculated according to the formulas (AT skew=[A−T]/[A+T]; GC skew=[G−C]/[G+C]) [24]. Identification of tRNA genes was verified using the program tRNAscan-SE. The potential stem-loop secondary structures within these tRNA gene sequences were calculated using the tRNAscan-SE Search Server available online (http://lowelab.ucsc.edu/tRNAscan-SE/) [25]. The secondary structures of tRNA genes that could not be predicted using the tRNAscan-SE were analyzed by comparison with the nucleotide sequences of other insect tRNA sequences [2, 7, 10-19].
Phylogenetic analysis
To illustrate the phylogenetic relation of Lepidoptera, the other complete mitochondrial genomes were obtained from GenBank. Drosophila yakuba [26], Drosophila melanogaster [27], Locusta migratoria [28] and Anopheles gambiae [29] were used as outgroups. The alignment of the amino acid sequences of each 13 mitochondrial PCGs was aligned with Clustal X [23, 30] using default settings. Then, the alignment of the nucleotide sequences of 13 individual PCGs was performed using RevTrans ver.1.4 [31], which aligns coding sequences on the basis of protein alignment. These aligned sequences were subjected to GBlocks 0.91b [32] analysis under default conditions in order to select the best-aligned blocks. These were subsequently concatenated into an amino acid (3,507 sites in length, 30 gaps and 308 aligned positions were excluded) and a nucleotide sequence blocks (9,897 sites in length, 66 gaps and 1073 aligned positions were excluded). The concatenated set of nucleotide and amino acids sequences, from the 13 PCGs, was used in phylogenetic analyses performed according to Maximum Likelihood (ML) and Bayesian Inference (BI) methods. ML analyses and bootstrap resampling were performed using the set of programs in the PHYLIP package [33]. BI analyses were carried out using MrBayes 3.1 [34].
For ML analyses (PHYLIP package), the alignment of amino acids and nucleotides sequences were entered into the subprogram SEQBOOT (bootstrap sequence data sets) of the PHYLIP package to create 100 data sets by bootstrap resampling. These 100 data sets were used as input to generate the 100 most parsimonious trees using the subprogram PROML/DNAML, during which all the sequences were randomly entered into each data set 10 times, based on the random number 3. Thus, the resulting output was based on 100×10 runs of all the sequences, with D. yakuba [26], D. melanogaster [27], L. migratoria [28] and A. gambiae [29] used as outgroups. The output of these 100×10 runs of PROML/ DNAML was entered into the program CONSENSE to calculate a majority-rules strict consensus tree with confidence intervals.
For BI analyses, substitution model selection was conducted via comparison of Akaike Information Criterion (AIC) scores [35], calculated using the programs Modeltest ver. 3.7 [36] for nucleotide sequence alignment and ProTest ver.1.4 for amino acid sequence alignment [37]. Bayesian inference (BI) of nucleotide and amino acid datasets were performed using the GTR +I+G [38] and MtRev +I+G [39] model, respectively. The BI analyses for both nucleotide sequences and amino acid were carried out using MrBayes ver. 3.1 [34] under the following conditions: 1,000,000 generations, four chains (one hot chain and three cold chains), and a burn-in step of the first 10,000. The confidence values of the BI tree are expressed as the Bayesian posterior probabilities in percent (BPP).
3. Results and discussion
Genome organization and base composition
The entire E. pyretorum mitogenome is 15, 327 bp long, similar to other sequenced lepidopteran mitogenomes (Table 3). The sequence analysis revealed the typical gene content observed in metazoan mitogenomes (Fig. 1): 13 PCGs (cox1-cox3, cob, nad1-6 and 4L, atp6 and 8), 22 tRNA genes (one for each amino acid, two for Leucine and Serine), the large and small rRNA (rrnL and rrnS) subunits, and a major non-coding region known as the A+T-rich region in insects, as has been detected in other insects [2, 7, 10-19].
Summary of mitogenome of E. pyretorum
| Gene | Direction | Location | Size | Anticodon | Start codon | Stop codon | Intergenic nucleotides* |
|---|---|---|---|---|---|---|---|
| trnM | F | 1-69 | 69 | CAT | 0 | ||
| trnI | F | 70-133 | 64 | GAT | -3 | ||
| trnQ | R | 131-199 | 69 | TTG | 54 | ||
| nad2 | F | 254-1267 | 987 | ATT | TAA | 8 | |
| trnW | F | 1276-1343 | 68 | TCA | -8 | ||
| trnC | R | 1336-1402 | 67 | GCA | 6 | ||
| trnY | R | 1409-1475 | 67 | GTA | 12 | ||
| cox1 | F | 1488-3018 | 1531 | CGA | T | 0 | |
| trnL2(UUR) | F | 3019-3086 | 68 | TAA | 0 | ||
| cox2 | F | 3087-3768 | 682 | GTG | T | 0 | |
| trnK | F | 3769-3839 | 71 | CTT | 23 | ||
| trnD | F | 3863-3934 | 72 | GTC | 0 | ||
| atp8 | F | 3935-4096 | 162 | ATT | TAA | -7 | |
| atp6 | F | 4090-4767 | 678 | ATG | TAA | 10 | |
| cox3 | F | 4778-5566 | 789 | ATG | TAA | 2 | |
| trnG | F | 5569-5633 | 65 | TCC | 0 | ||
| nad3 | F | 5634-5987 | 354 | ATT | TAG | -2 | |
| trnA | F | 5986-6052 | 67 | TGC | 6 | ||
| trnR | F | 6059-6124 | 66 | TCG | -3 | ||
| trnN | F | 6122-6187 | 66 | GTT | 0 | ||
| trnS1(AGN) | F | 6188-6252 | 65 | GCT | 1 | ||
| trnE | F | 6254-6321 | 68 | TTC | 13 | ||
| trnF | R | 6335-6402 | 68 | GAA | -17 | ||
| nad5 | R | 6386-8143 | 1758 | ATT | TAA | 0 | |
| trnH | R | 8144-8209 | 66 | GTG | 1 | ||
| nad4 | R | 8211-9551 | 1341 | ATG | TAA | 2 | |
| nad4L | R | 9554-9844 | 291 | ATG | TAA | 8 | |
| trnT | F | 9853-9917 | 65 | TGT | 0 | ||
| trnP | R | 9918-9981 | 65 | TGG | 0 | ||
| nad6 | F | 9985-10521 | 570 | ATA | TAA | -1 | |
| cob | F | 10521-11672 | 1152 | ATG | TAA | 2 | |
| trnS2(UCN) | F | 11675-11741 | 67 | TGA | 18 | ||
| nad1 | R | 11760-12698 | 939 | ATG | TAA | 1 | |
| trnL1(CUN) | R | 12700-12767 | 68 | TAG | 19 | ||
| rrnL | R | 12787-14124 | 1338 | 0 | |||
| trnV | R | 14125-14191 | 67 | TAC | 0 | ||
| rrnS | R | 14192-14969 | 778 | 0 | |||
| CR | 14970-15327 | 358 | 0 |
* Negative numbers indicate that adjacent genes overlap.
Map of the mitochondrial genome of E. pyretorum. The abbreviations for the genes are as follows: cox1, cox2, and cox3 refer to the cytochrome oxidase subunits, cob refers to cytochrome b, and nad1-6 refers to NADH dehydrogenase components. tRNAs are denoted as one-letter symbol according to the IUPAC-IUB single-letter amino acid codes. The overlapping fragments ER1-10 are shown as single lines within a circle.
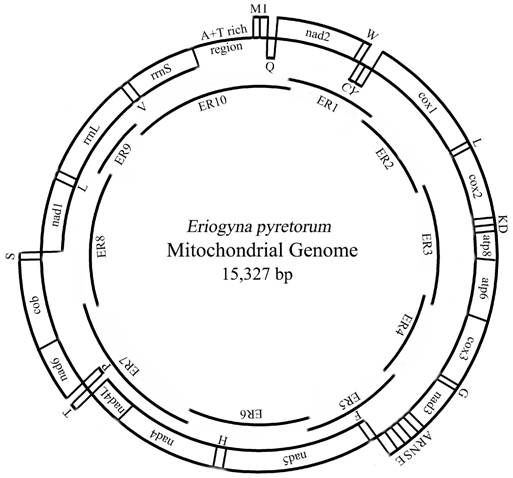
The gene order of the lepidopteran mitogenomes are identical; including those of E. pyretorum (Fig. 1), however, it differs from the most common type found in a variety of insect orders, which was inferred to be ancestral for insects [40]. The difference between the two types is due the translocation of trnM to a position 5'-upstream of trnI, which results in an gene order of trnM, trnI, and trnQ (instead of trnI, trnQ and trnM) observed in the lepidopteran mtDNAs (Fig. 1). This suggests that the lepidopteran insects may have acquired such an orientation and gene order independently after their differentiation from the remaining insects [13].
Gene overlaps in the E. pyretorum mitogenome occur in seven locations (totally 41 bp), with the longest one (17 bp) observed between trnF and nad5 (Table 3). Similarly-sized overlapping sequences are also detected between trnF and nad5 in other sequenced lepidopteran species, such as C. boisduvalii, A. pernyi, Ostrinia furnacalis and Ostrinia nubilalis. The atp8 and atp6 of E. pyretorum are the only PCGs having a seven nucleotides overlap (Table 3). This feature is common to other sequenced lepidopteran mitogenomes [2, 7, 10-19] and is found in many animal mitogenomes [8].
The E. pyretorum mitogenome harbor a total of 186 bp intergenic spacer sequences and these are spread over 17 regions, ranging in size from 1 to 54 bp (Table 3). The longest one of these is present between trnQ and nad2 (Table 3). The intergenic spacer sequences of E. pyretorum mitogenome is shorter than that of Ochrogaste lunifer (371 bp over 20 regions) and C. boisduvalii (194 bp over 16 regions), but longer than that of M. sexta (115 bp over 13 regions), Artogeia melete (118 bp over 10 regions) and Coreana raphaelis (178 bp over 17 regions).
The nucleotide composition of the E. pyretorum mitogenome is biased toward A + T nucleotides (80.82%) (Table 4), which is a lower percentage than that of Phthonandria atrilineata (81.02%), B. mori (81.36%), Japanese B. mandarina (81.68%), M. sexta (81.79%) and C. raphaelis (82.66%), but higher than other eight lepidopterans: A. pernyi (80.16%), A. yamamai (80.29%), C. Boisduvalii (80.62%), O. nubilalis (80.17%), O. furnicalis (80.37%), A. honmai (80.39%), A. melete (79.78%) and O. lunifer (77.84%). Within 13 protein-coding genes (PCGs) in the E. pyretorum mitogenome, the A + T composition is highest in the atp8 gene (93.83%), and lowest in the cox1 gene (72.16%).
Composition and skewness in the lepidopteran mitogenomes*
| Species | Size (bp) | A% | G% | T% | C% | A+T % | ATskewness | GCskewness |
|---|---|---|---|---|---|---|---|---|
| Whole genome | ||||||||
| E. pyretorum | 15327 | 39.17 | 7.63 | 41.65 | 11.55 | 80.82 | -0.031 | -0.204 |
| A. pernyi | 15566 | 39.22 | 7.77 | 40.94 | 12.07 | 80.16 | -0.021 | -0.216 |
| A. yamamai | 15338 | 39.26 | 7.69 | 41.04 | 12.02 | 80.29 | -0.022 | -0.220 |
| C. boisduvalii | 15360 | 39.34 | 7.58 | 41.28 | 11.79 | 80.62 | -0.024 | -0.217 |
| B. mori | 15656 | 43.06 | 7.31 | 38.30 | 11.33 | 81.36 | 0.059 | -0.216 |
| Japanese B. mandarina | 15928 | 43.08 | 7.21 | 38.60 | 11.11 | 81.68 | 0.055 | -0.213 |
| Chinese B. mandarina | 15682 | 43.11 | 7.40 | 38.48 | 11.01 | 81.59 | 0.057 | -0.196 |
| O. nubilalis a | 14535 | 41.36 | 8.02 | 38.81 | 11.82 | 80.17 | 0.031 | -0.192 |
| O. furnicalis a | 14536 | 41.46 | 7.91 | 38.92 | 11.71 | 80.37 | 0.032 | -0.194 |
| A. honmai | 15680 | 40.15 | 7.88 | 40.24 | 11.73 | 80.39 | -0.001 | -0.178 |
| C. raphaelis | 15314 | 39.37 | 7.30 | 43.29 | 10.04 | 82.66 | -0.047 | -0.158 |
| M. sexta | 15516 | 40.67 | 7.46 | 41.11 | 10.76 | 81.79 | -0.005 | -0.181 |
| A. melete | 15140 | 40.38 | 7.87 | 39.41 | 12.35 | 79.78 | 0.012 | -0.221 |
| P. atrilineata | 15499 | 40.78 | 7.67 | 40.24 | 11.31 | 81.02 | 0.007 | -0.192 |
| O. lunifer | 15593 | 40.09 | 7.56 | 37.75 | 14.60 | 77.84 | 0.030 | -0.318 |
| PCG | ||||||||
| E. pyretorum | 11228 | 33.18 | 10.50 | 46.23 | 10.09 | 79.41 | -0.164 | 0.020 |
| A. pernyi | 11204 | 38.50 | 8.56 | 40.02 | 12.92 | 78.52 | -0.019 | -0.203 |
| A. yamamai | 11269 | 33.04 | 10.71 | 45.90 | 10.35 | 78.94 | -0.163 | 0.017 |
| C. boisduvalii | 11227 | 38.83 | 8.32 | 40.31 | 12.53 | 79.15 | -0.019 | -0.202 |
| B. mori | 11187 | 42.91 | 8.15 | 36.68 | 12.26 | 79.58 | 0.078 | -0.201 |
| Japanese B. mandarina | 11193 | 42.78 | 8.14 | 36.86 | 12.22 | 79.64 | 0.074 | -0.200 |
| Chinese B. mandarina | 11196 | 42.83 | 8.26 | 37.04 | 11.87 | 79.87 | 0.072 | -0.179 |
| O. nubilali | 11184 | 41.06 | 8.57 | 38.10 | 12.27 | 79.16 | 0.037 | -0.178 |
| O. furnicalis | 11186 | 41.15 | 8.42 | 38.27 | 12.15 | 79.42 | 0.036 | -0.181 |
| A. honmai | 11245 | 39.65 | 8.77 | 38.83 | 12.74 | 78.48 | 0.010 | -0.181 |
| C. raphaelis | 11145 | 39.10 | 7.94 | 42.40 | 10.55 | 81.51 | -0.04 | -0.141 |
| M. sexta | 11207 | 40.39 | 8.20 | 39.95 | 11.46 | 80.34 | 0.005 | -0.163 |
| A. melete | 11180 | 40.13 | 8.47 | 38.38 | 13.01 | 78.52 | 0.022 | -0.211 |
| P. atrilineata | 11202 | 40.23 | 8.59 | 38.87 | 12.31 | 79.10 | 0.017 | -0.178 |
| O. lunifer | 11266 | 32.47 | 12.08 | 43.26 | 12.19 | 75.73 | -0.142 | -0.004 |
| tRNA | ||||||||
| E. pyretorum | 1424 | 42.59 | 10.61 | 39.35 | 7.45 | 81.94 | 0.039 | 0.174 |
| A. pernyi | 1459 | 40.71 | 8.02 | 40.71 | 10.56 | 81.43 | 0 | -0.137 |
| A. yamamai | 1473 | 41.07 | 8.08 | 40.26 | 10.59 | 81.33 | 0.010 | -0.134 |
| C. boisduvalii | 1466 | 40.38 | 7.78 | 41.61 | 10.23 | 81.99 | -0.015 | -0.136 |
| B. mori | 1461 | 42.20 | 7.80 | 39.70 | 10.47 | 81.72 | 0.031 | -0.146 |
| Japanese B. mandarina | 1463 | 41.90 | 7.79 | 39.71 | 10.59 | 81.61 | 0.026 | -0.152 |
| Chinese B. mandarina | 1472 | 41.78 | 7.81 | 39.95 | 10.46 | 81.73 | 0.022 | -0.145 |
| O. nubilalis | 1425 | 42.11 | 7.86 | 39.58 | 10.46 | 81.68 | 0.031 | -0.142 |
| O. furnicalis | 1424 | 42.21 | 8.01 | 39.12 | 10.67 | 81.32 | 0.038 | -0.142 |
| A. honmai | 1474 | 41.11 | 8.41 | 39.89 | 10.58 | 81.00 | 0.015 | -0.114 |
| C. raphaelis | 1516 | 40.90 | 7.72 | 42.15 | 9.23 | 83.05 | -0.015 | -0.089 |
| M. sexta | 1499 | 41.09 | 8.07 | 40.76 | 10.07 | 81.85 | 0.004 | -0.110 |
| A. melete | 1509 | 41.42 | 11.33 | 38.070 | 8.55 | 80.12 | 0.034 | 0.142 |
| P. atrilineata | 1602 | 41.20 | 8.30 | 40.26 | 10.24 | 81.46 | 0.012 | -0.105 |
| O. lunifer | 1666 | 41.78 | 7.32 | 39.86 | 11.04 | 81.63 | 0.023 | -0.202 |
| rRNA | ||||||||
| E. pyretorum | 2116 | 41.16 | 4.82 | 43.38 | 10.63 | 84.55 | -0.026 | -0.376 |
| A. pernyi | 2144 | 40.86 | 4.90 | 43.10 | 11.15 | 83.96 | -0.027 | -0.390 |
| A. yamamai | 2156 | 40.68 | 5.06 | 43.46 | 10.81 | 84.14 | -0.033 | -0.363 |
| C. boisduvalii | 2165 | 40.60 | 5.13 | 43.93 | 10.44 | 84.53 | -0.039 | -0.341 |
| B. mori | 2162 | 43.73 | 4.58 | 41.09 | 10.60 | 84.82 | 0.031 | -0.397 |
| Japanese B. mandarin | 2160 | 43.89 | 4.63 | 41.30 | 10.19 | 85.19 | 0.030 | -0.375 |
| Chinese B. mandarina | 2134 | 43.86 | 4.78 | 41.05 | 10.31 | 84.91 | 0.028 | -0.366 |
| O. nubilalis | 1773 | 42.41 | 5.13 | 41.79 | 10.66 | 84.21 | 0.007 | -0.350 |
| O. furnicalis | 1774 | 42.39 | 5.07 | 42.05 | 10.48 | 84.44 | 0.004 | -0.348 |
| A. honmai | 2166 | 40.49 | 4.94 | 43.72 | 10.85 | 84.21 | -0.038 | -0.374 |
| C. raphaelis | 2107 | 38.93 | 5.03 | 46.56 | 9.49 | 85.48 | -0.089 | -0.307 |
| M. sexta | 2168 | 41.37 | 4.84 | 44.05 | 9.73 | 85.42 | -0.031 | -0.335 |
| A. melete | 2096 | 40.65 | 5.25 | 43.56 | 10.54 | 84.21 | -0.035 | -0.335 |
| P. atrilineata | 2203 | 42.85 | 4.58 | 43.08 | 9.49 | 85.93 | -0.003 | -0.349 |
| O. lunifer | 2157 | 41.96 | 4.82 | 40.19 | 13.03 | 82.15 | 0.022 | -0.460 |
| A+T-rich region | ||||||||
| E. pyretorum | 358 | 42.18 | 2.51 | 50.00 | 5.31 | 92.18 | -0.085 | -0.358 |
| A. pernyi | 552 | 41.12 | 4.17 | 49.28 | 5.43 | 90.40 | -0.090 | -0.127 |
| A. yamamai | 334 | 41.62 | 3.59 | 47.90 | 6.89 | 90.40 | -0.070 | -0.314 |
| C. boisduvalii | 330 | 42.12 | 2.12 | 49.39 | 6.36 | 91.52 | -0.079 | -0.500 |
| B. mori | 494 | 44.94 | 1.62 | 50.61 | 2.83 | 95.55 | -0.059 | -0.272 |
| Japanese B. mandarina | 747 | 45.52 | 2.41 | 49.67 | 2.41 | 95.18 | -0.043 | 0 |
| Chinese B. mandarina | 484 | 46.49 | 2.69 | 47.93 | 2.89 | 94.42 | -0.015 | -0.036 |
| A. honmai | 489 | 48.47 | 2.86 | 45.81 | 2.86 | 94.27 | 0.028 | 0 |
| C. raphaelis | 375 | 44.27 | 1.33 | 49.87 | 4.53 | 94.13 | -0.059 | -0.545 |
| M. sexta | 324 | 45.00 | 1.54 | 50.31 | 3.29 | 95.37 | -0.055 | -0.334 |
| A. melete | 351 | 43.87 | 3.13 | 45.30 | 7.69 | 89.17 | -0.016 | -0.421 |
| P. atrilineata | 457 | 40.70 | 0.66 | 57.55 | 1.09 | 98.25 | -0.172 | -0.246 |
| O. lunifer | 319 | 44.5 | 1.6 | 48.9 | 5.0 | 93.4 | -0.047 | -0.524 |
* The overlapping regions are excluded in the protein-coding genes (PCGs) and tRNAs.
a, partial mitogenome lacking in the A+T-rich region, partial trnM and rrnS sequence.
The ATskew and GCskew [24] were calculated for all available complete mitogenome of lepidopterans and are presented in Table 4. The AT skewness for the E. pyretorum mitogenome is slightly negative (-0.031), indicating the occurrence of more Ts than As. Similar results are found in C. raphaelis (-0.047), C. boisduvalii (-0.024), A. yamamai (-0.022), A. pernyi (-0.021), M. sexta (-0.005) and Adoxophyes honmai (-0.001). In contrast, the AT skewness is slightly positive in B. mori (0.059), Chinese B. mandarina (0.057), Japanese B. Mandarina (0.055), O. nubilalis (0.031), O. furnicalis (0.032), O. lunifer (0.030), A. melete (0.012) and P. atrilineata (0.007). When considering the 13 PCGs, the bias toward the use of Ts over As is more obvious in the E. pyretorum mitogenome, in which the AT skewness is -0.164. In all sequenced lepidopteran mitogenomes, the GC skewness values are negative (−0.158 to −0.318), meaning that there are more Cs than Gs, similar to the skewness values for dipteran and animal mitogenomes [41, 42]. In E. pyretorum rRNA, the GC skewness is −0.376. This bias is stronger than in the other genes, indicating that there is a heavy bias toward Cs and against Gs in the rRNA.
Protein-coding genes
The mitogenome of E. pyretorum contains the full set of PCGs usually present in metazoan mitogenomes. 13 PCGs are arranged along the genome according to the standard order of insects (Fig. 1). The putative start codons of PCGs are those previously known for metazoan mitogenomes with the typical ATN codon (six with ATG, four with ATT and one with ATA) (Table 3), with the only exceptions represented by the CGA and GTG start codons observed in cox1 and cox2, respectively. Some unusual codons for cox1 have been proposed in lepidopteran mtDNAs. In B. mori [2], B. mandarina [2, 10], A. pernyi [11], A. yamamai [12] and C. raphaelis [16], the tetranucleotide, TTAG, has been designated as a cox1start codon; whereas in Ostrina species it has been proposed the hexanucleotide ATTTAG [14]. Similarly to E. pyretorum, CGA is also used as cox1 start codon in A. melete [19], C. boisduvalii [7], M. sexta [13], A. honmai [15], O. lunifer [17] and P. atrilineata [18].
Eleven of the thirteen PCGs harbor the complete stop codon TAA or TAG, whereas in cox1 and cox2 there are incomplete T stop codons for (Table 3). Incomplete stop codons are found in many lepidopteran mitogenomes sequenced to date [2, 7, 10-18] and more in general in many arthropod mitogenomes [8]. In E. pyretorum, cox1 and cox2 terminated with a single T residue which is directly adjacent to a tRNA gene and to a non-coding region, respectively. The common interpretation of this phenomenon is that TAA termini are created via post-transcriptional polyadenylation [43].
The analysis of the base composition at each codon position of the concatenated 13 PCGs of E. pyretorum mitogenome shows that each codon position has a different AT/GC bias (Table 5). The first codon positions of E. pyretorum are biased toward the use of T and G. The second and third codon positions are biased toward the use of T and C. The analysis of the base composition at each codon position of the concatenated 13 PCGs of E. pyretorum mitogenome demonstrates that the third codon position (91.80%) is considerably higher in A+T content than the first (75.80%) and second (73.20%) ones. The result is agreed with the previous analyses performed in other lepidopteran species (Table 5). A possible explanation for the observed differences in nucleotide composition is that the constraints on A+T content in the first and second codon positions are less relaxed than those in the third codon position, due to degenerated genetic code [44].
Summary of base composition at each codon position of the concatenated 13 protein-coding genes in the lepidopteran mitogenomes
| 1st codon position | 2nd codon position | 3rd codon position | ||||||||||
|---|---|---|---|---|---|---|---|---|---|---|---|---|
| %A | %T | % G | %C | % A | %T | %G | % C | %A | %T | % G | %C | |
| E. pyretorum | 36.9 | 38.9 | 14.4 | 9.8 | 23.2 | 50.0 | 11.7 | 15.1 | 40.4 | 51.4 | 1.9 | 6.3 |
| A. pernyi | 35.4 | 37.5 | 16.6 | 10.5 | 21.7 | 48.5 | 13.3 | 16.6 | 40.9 | 51.4 | 2.8 | 4.9 |
| A. yamamai | 35.6 | 37.2 | 16.5 | 10.7 | 21.6 | 48.7 | 13.2 | 16.5 | 41.4 | 51.9 | 2.6 | 4.1 |
| C. boisduvalii | 35.9 | 37.9 | 16.0 | 10.2 | 22.1 | 48.7 | 13.2 | 16.1 | 41.0 | 51.7 | 3.1 | 4.2 |
| B. mori | 37.3 | 37.6 | 9.4 | 15.7 | 22.2 | 48.6 | 15.9 | 13.3 | 43.6 | 49.2 | 4.5 | 2.7 |
| Japanese B. mandarina | 37.9 | 36.8 | 10.9 | 14.4 | 25.3 | 47.9 | 16.1 | 10.7 | 41.5 | 47.7 | 4.2 | 6.6 |
| Chinese B.mandarina | 38.2 | 36.9 | 16.1 | 8.8 | 22.9 | 50.7 | 13.4 | 13.0 | 40.6 | 52.7 | 3.4 | 3.3 |
| O. nubilalis | 35.8 | 38.3 | 15.1 | 10.8 | 26.0 | 48.6 | 11.2 | 14.2 | 41.0 | 47.6 | 6.3 | 5.1 |
| O. furnicalis | 37.7 | 36.8 | 16.1 | 9.4 | 21.6 | 48.7 | 13.3 | 16.3 | 43.7 | 49.6 | 2.7 | 4.0 |
| A. honmai | 36.4 | 36.6 | 16.5 | 10.5 | 22.4 | 48.0 | 13.4 | 16.3 | 41.2 | 50.7 | 3.3 | 4.8 |
| C. raphaelis | 38.5 | 37.9 | 14.8 | 8.8 | 22.0 | 49.2 | 13.1 | 15.7 | 45.7 | 51.1 | 1.2 | 2.0 |
| M. sexta | 37.1 | 37.7 | 15.7 | 9.5 | 22.2 | 48.8 | 13.1 | 16.0 | 43.7 | 51.3 | 2.5 | 2.6 |
| A. melete | 43.9 | 36.8 | 9.2 | 10.1 | 33.1 | 39.5 | 14.7 | 16.5 | 39.5 | 40.3 | 3.1 | 12.7 |
| P. atrilineata | 42.6 | 36.4 | 10.2 | 10.8 | 34.2 | 42.2 | 9.6 | 14.2 | 45.5 | 41.2 | 3.5 | 9.8 |
| O. lunifer | 37.2 | 36.2 | 15.2 | 11.4 | 23.2 | 48.9 | 12.3 | 15.6 | 38.7 | 46.6 | 5.2 | 9.5 |
Transfer and ribosomal RNA genes
The E. pyretorum tRNA genes structure was predicted using the tRNAscan-SE Search Server [25]. The predicted structure of the 22 E. pyretorum tRNAs is shown in Fig. 2. The tRNA genes size vary from 64 (trnI) to 72 (trnD) bp. All E. pyretorum tRNAs present the typical clover-leaf secondary structure previously found in mitochondrial tRNA genes except for trnS1(AGN) and trnS2(UCN). Similarly to what has been observed in some insects, including lepidopteran species [2, 7, 10-19], and metazoan mitogenomes [8], the E. pyretorum trnS1(AGN) has an unusual shape, lacking a stable DHU arm (Fig. 2). Additionally, the trnS2(UCN) lacks a stable DHU arm (Fig. 2), an unique feature among lepidopteran mtDNAs. The anticodons of E. pyretorum tRNAs are all identical to those observed in lepidopterans [2, 7, 10-19].
Putative secondary structures for the tRNA genes of the E. pyretorum mitogenome.
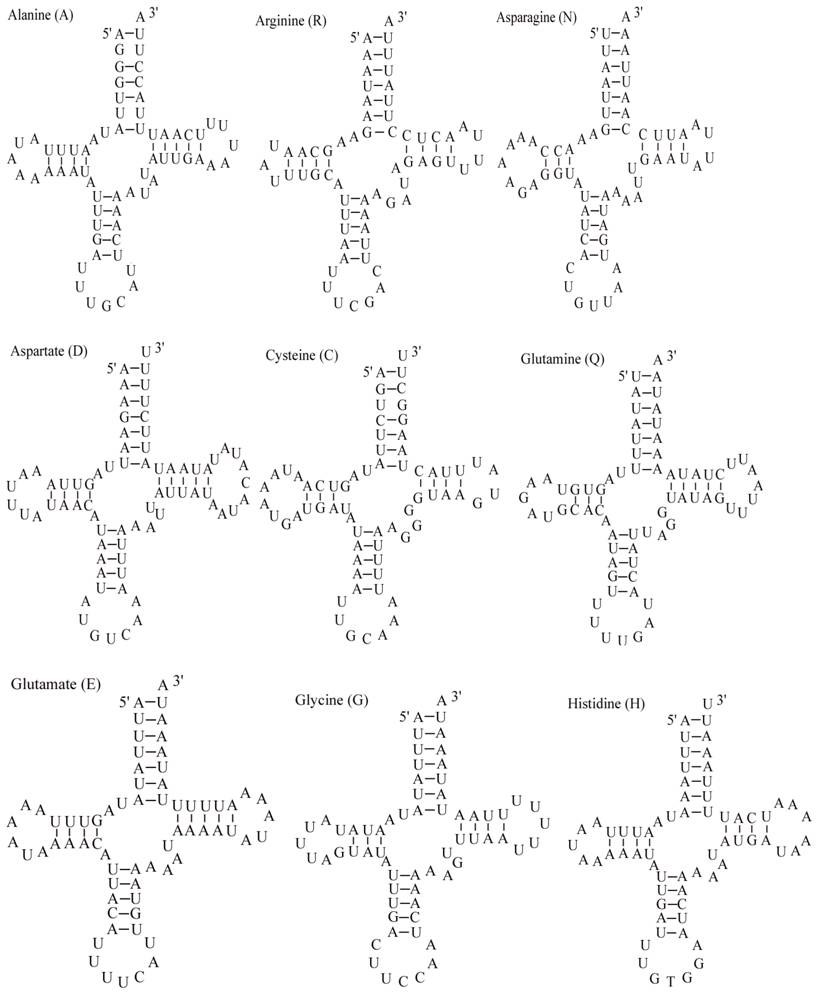
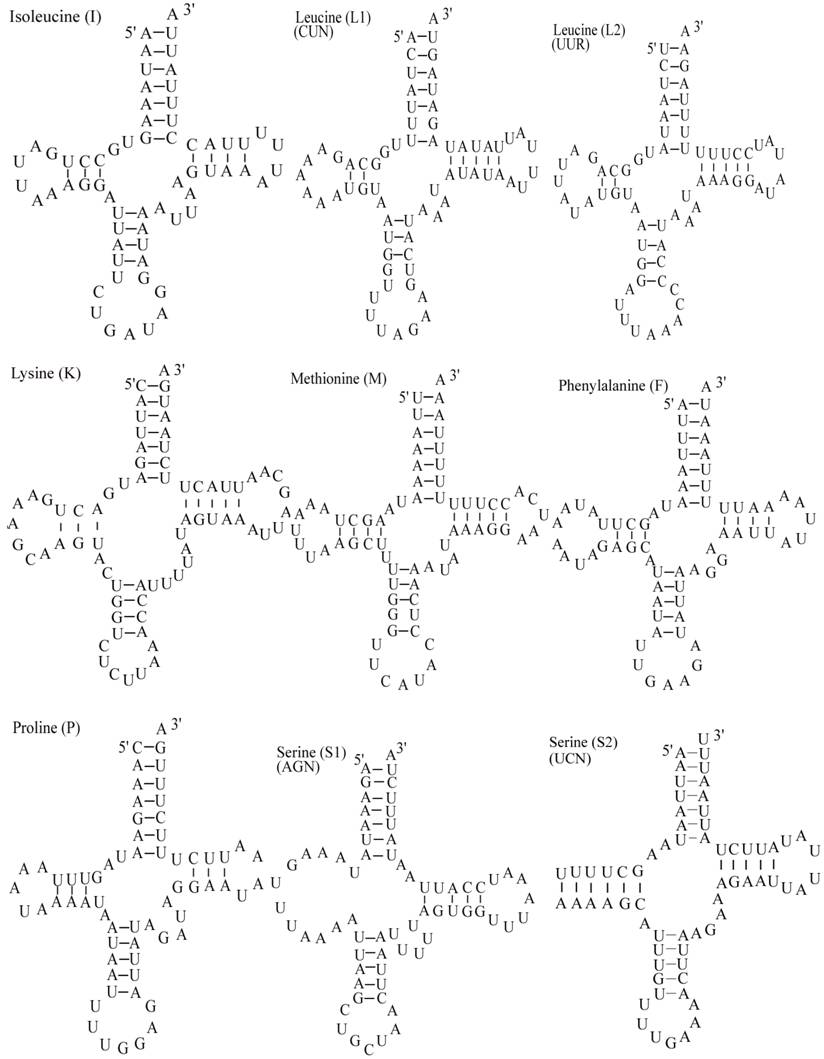
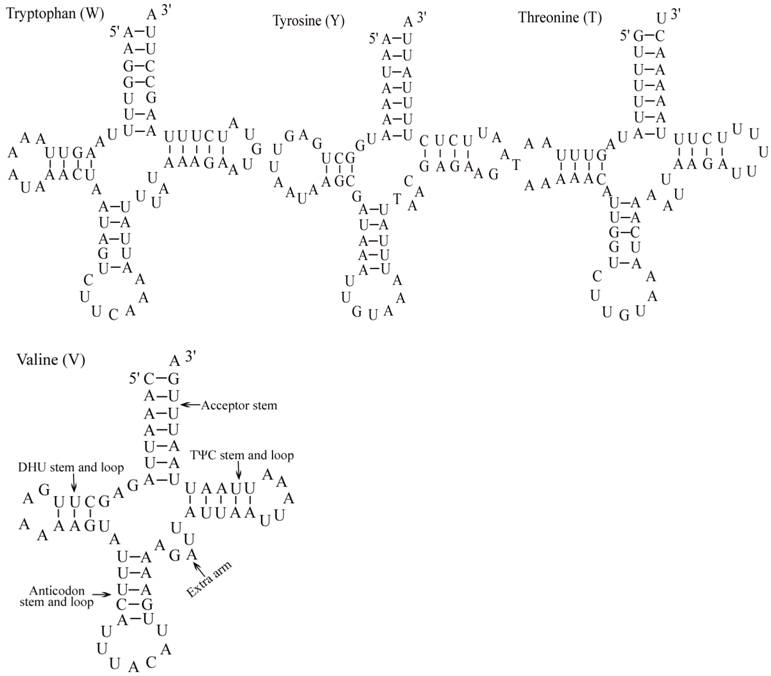
A total of 24 unmatched base pairs occur in the E. pyretorum mitochondrial tRNA genes, 12 of them are G-U pairs, which form a weak bond. The trnS2(UCN) has two U-U mismatch in the anticodon stem, whereas trnL1 (CUN) and trnA contain an U-U mismatch in the acceptor stem,. The mismatches are scattered among 15 of the 22 E. pyretorum tRNA genes, including: trnA, trnC, trnF, trnG, trnI, trnL1 (CUN), trnL2 (UUR), trnM, trnP, trnQ, trnS1 (AGN), trnS2 (UCN), trnT, trnV and trnW (Fig. 2). Mismatches are located mostly in the acceptor, DHU and anticodon stems, with exception represented by trnS1 (AGN) and trnP that exhibits the G-U mismatch on the TΨC stem.
As with all other insect mitogenome sequences, two rRNA (rrnL and rrnS) genes are present in the E. pyretorum mitogenome. These sequences are which located between trnL1 (CUN) and trnV, and between trnV and the A+T-rich region, respectively (Fig. 1). The lengths of rrnL and rrnS are1338 bp and 778 bp, respectively (Table 3), which is well within the size reported for other lepidopteran insects. The A + T content of the rrnL and rrnS genes of E. pyretorum mitogenome are 83.82 % and 84.45 %, respectively. These values are also well within the range reported with other lepidopteran insects (Table 4).
A+T-rich region
The E. pyretorum A+T-rich region extends over 358 bp and is located between rrnS and the trnM-I-Q tRNA cluster. This region is longer than that observed in A. melete (351 bp), A. yamamai (334 bp), C. boisduvalii (330 bp), M. sexta (324 bp) and O. lunifer (319 bp), but shorter than that of C. raphaelis (375 bp), P. atrilineata (457 bp), A. honmai (489 bp), B. mori (494 bp), A. honmai (489 bp), A. pernyi (552 bp) and B. mandarina (747 bp). The region contains the highest A+T content (92.18%), which is also well within the range reported for other lepidopteran insects (Table 4).
In the E. pyretorum A+T-rich region, there are some structures typical of other lepidopteran mitogenomes. From positions 14988 to 15011, there is a DNA fragment that includes the motif 'ATAGA' and a 19-bp poly-T stretch, which is widely conserved in lepidopteran mitogenomes [2, 7, 10-19] and has been suggested as the origin of the minority or light strand DNA replication [45]. A 10-bp poly-A is found immediately upstream of trnM. This poly-T element is a common feature of the A+T region of lepidopteram mtDNAs and is involved in controlling transcription and/or replication initiation or may have some other unknown functions [46, 47]. In Antheraea species (A. pernyi, A. roylei and A. proylei) A+T-rich region, there is a repeat unit that contain an approximately 20 bp core motif, flanked by 9 bp perfect inverted repeats [3]. This character can't be detected in the A+T-rich region of E. pyretorum.
Phylogenetic analyses
Phylogenetic analyses by BI and ML methods, of the concatenated nucleotide dataset (9,897 aligned sites, 66 gaps and 1073 excluded positions) and amino acid dataset (3,507 sites in length, 30 gaps and 308 excluded positions), produced similar tree topologies (Fig. 3 A and B). Both datasets yielded a topology with the relationship: Lepidoptera + ( Diptera + Orthoptera ). Lepidoptera as the sister clade of all other Neoptera is well supported by BI analysis and ML analysis with both nucleotide dataset (Fig. 3A) and amino acid dataset (Fig. 3B).
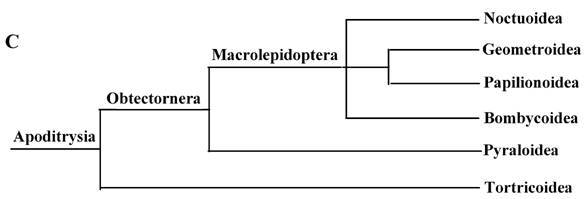
Phylogeny of the lepidopteran species. Phylogenetic tree estimation from the mitogenome sequences of selected insects obtained with nucleotide dataset (A) and amino acid dataset (B) using BI analysis and ML analysis. (C) The most recent consensus view of lepidopteran relationships after Kristensen & Skalski (1999) [48]. D. yakuba [26], D. melanogaster [27], L. migratoria [28] and A. gambiae [29] were used as outgroups. The numbers above branches specify posterior probabilities from Bayesian inference (BI). The numbers under branches specify bootstrap percentages from maximum likelihood (ML,1000 replicates). /, denotes a value below 50% in the ML tree.
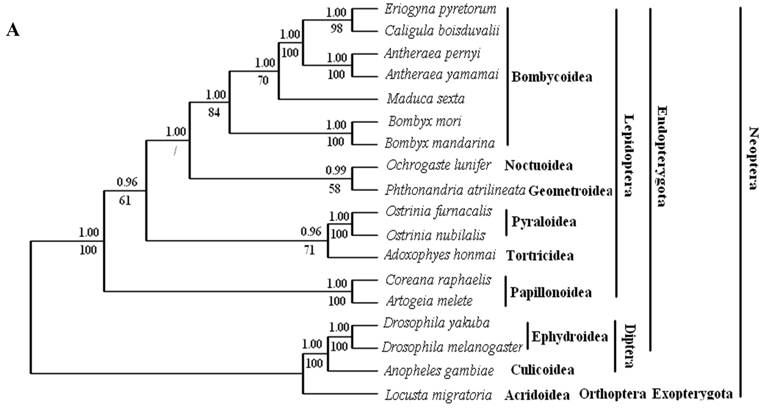
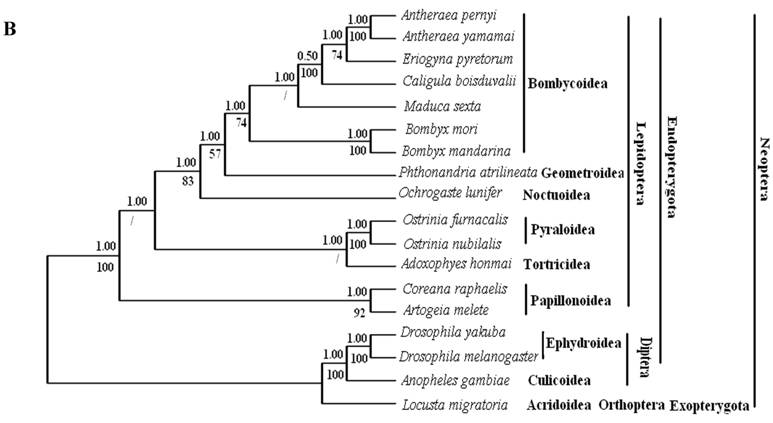
Among lepidopterans, the silk moths belong principally to two families, Bombycidae and Saturniidae, in the Bombycoidea superfamily. The phylogenetic analyse shows that Bombycidae (Bombyx mori and Bombyx mandarina), Sphingoidae (Manduca sexta) and Saturniidae (Antheraea pernyi, Antheraea yamamai, E. pyretorum and Caligula boisduvalii) formed a group (Fig. 3 A and B), this is in accordance with the traditional morphology-based classification [48].
These 14 sequences represent six lepidopteran superfamilies within the lepidopteran suborder: Bombycoidea, Noctuoidea, Pyraloidea, Tortricidea, Papillonoidea and Geometroidea. In our phylogenetic results, the two butterflies of Papillonoidea (A. melete and C. raphaelis) are sisters to the remaining lepidopteran superfamilies; Tortricoidea (A. honmai) is the sister group to the Pyraloidea (O. furnacalis and O. nubilalis) (Fig. 3A and B), which is different to the typical morphological analyses (Fig. 3C). According to the most recent consensus view of lepidopteran relationships in Kristensen & Skalski (1999) [48], Bombycoidea, Noctuoidea, Papillonoidea and Geometroidea are designated as the Macrolepidoptera; Pyraloidea together with Macrolepidoptera are designated as Obtectornera; Tortricoidea is the sisters to the remaining lepidopteran superfamilies included in the present study (Fig. 3C).
Acknowledgements
This study is supported by the Program for New Century Excellent Talents in University (NCET-07-0251), the grant from Science and Technological Fund of Anhui Province for Outstanding Youth (08040106803), the grant from the National Natural Science Foundation of China (30500374, 30800803), and the grant from the Natural Science Foundation of Anhui Province (KJ2008B044).
Conflict of Interest
The authors have declared that no conflict of interest exists.
References
1. Kuan MM, Kuan CP, Li ML. Phylogenetic Reconstruction Using a EST Encoding Ribosomal Protein Gene from a Wild Silkworm, Eriogyna pyretorum in Northern Taiwan. BioFormosa. 2008;43:11-16
2. Yukuhiro K, Sezutsu H, Itoh M. et al. Significant levels of sequence divergence and gene rearrangements have occurred between the mitochondrial genomes of the wild mulberry silkmoth, Bombyx mandarina, and its close relative, the domesticated silkmoth, Bombyx mori. Mol Biol Evol. 2002;19:1385-1389
3. Arunkumar KP, Metta M, Nagaraju J. Molecular phylogeny of silk moths reveals the origin of domesticated silk moth, Bombyx mori from Chinese Bombyx mandarina and paternal inheritance of Antheraea proylei mitochondrial DNA. Mol Phylogenet Evol. 2006;40:419-427
4. Shimada T, Kurimoto Y, Kobayashi M. Phylogenetic relationship of silkmoths inferred from sequence data of the arylphorin gene. Mol Phylogenet Evol. 1995;4:223-34
5. Hwang JS, Lee JS, Goo TW. et al. Molecular genetic relationships between Bombycidae and Saturniidae based on the mitochondria DNA encoding of large and small rRNA. Genet Anal. 1999;15:223-228
6. Mahendran B, Ghosh SK, Kundu SC. Molecular phylogeny of silk-producing insects based on 16S ribosomal RNA and cytochrome oxidase subunit I genes. J Genet. 2006;85:31-38
7. Hong MY, Lee EM, Jo YH, et al.Complete nucleotide sequence, organization of the mitogenome of the silk moth Caligula boisduvalii (Lepidoptera. Saturniidae) and comparison with other lepidopteran insects. Gene. 2008;413:49-57
8. Wolstenholme DR. Animal mitochondrial DNA: structure and evolution. Int Rev Cytol. 1992;141:173-216
9. Boore JL. Animal mitochondrial genomes. Nucleic Acids Res. 1999;27:1767-1780
10. Pan M, Yu Q, Xia Y. et al. Characterization of mitochondrial genome of Chinese wild mulberry silkworm, Bomyx mandarina. (Lepidoptera: Bombycidae). Sci China C Life Sci. 2008;51:693-701
11. Liu YQ, Li YP, Pan MH. et al. The complete mitochondrial genome of the Chinese oak silkmoth, Antheraea pernyi (Lepidoptera: Saturniidae). Acta Biochim Biophys Sin. 2008;40:694-703
12. Kim SR, Kim MI, Hong MY. et al. The complete mitogenome sequence of the Japanese oak silkmoth, Antheraea yamamai (Lepidoptera: Saturniidae). Mol Biol Rep. 2008 in press
13. Cameron SL, Whiting MF. The complete mitochondrial genome of the tobacco hornworm, Manduca sexta (Insecta: Lepidoptera: Sphingidae), and an examination of mitochondrial gene variability within butterflies and moths. Gene. 2008;408:112-113
14. Coates BS, Sumerford DV, Hellmich RL. et al. Partial mitochondrial genome sequences of Ostrinia nubilalis and Ostrinia furnacalis. Int J Biol Sci. 2005;1:13-18
15. Lee ES, Shin KS, Kim MS. et al. The mitochondrial genome of the smaller tea tortix Adoxophyes honmai (Lepidoptera: Tortricidae). Gene. 2006;373:52-57
16. Kim I, Lee EM, Seol KY. et al. The mitochondrial genome of the Korean hairstreak, Coreana raphaelis (Lepidoptera: Lycaenidae). Insect Mol Bio. 2006;15:217-225
17. Salvato P, Simonato M, Battisti A. et al. The complete mitochondrial genome of the bag-shelter moth Ochrogaster lunifer (Lepidoptera: Notodontidae). BMC Genomics. 2008;9:331
18. Yang L, Wei ZJ, Hong GY. et al. The complete nucleotide sequence of the mitochondrial genome of Phthonandria atrilineata (Lepidoptera: Geometridae). Mol Biol Rep. 2008 in press
19. Hong GY, Jiang ST, Yu M. et al. The complete nucleotide sequence of the mitochondrial genome of the cabbage butterfly, Artogeia melete (Lepidoptera: Pieridae). Acta Biochim Biophys Sin. 2009 in press
20. Hwang UW, Park CJ, Yong TS. et al. One-Step PCR Amplification of Complete Arthropod Mitochondrial Genomes. Mol Phylogenet Evol. 2001;19:345-352
21. Wei ZJ, Hong GY, Jiang ST. et al. Characters and expression of the gene encoding DH, PBAN and other FXPRLamide family neuropeptides in Antheraea pernyi. J Appl Entomol. 2008;132:59-67
22. Altschul SF, Madden TL, Schäffer AA. et al. Gapped BLAST and PSI-BLAST: a new generation of protein database search programs. Nucleic Acids Res. 1997;25:3389-3402
23. Tamura K, Dudley J, Nei M. et al. MEGA4: Molecular Evolutionary Genetics Analysis (MEGA) software version 4.0. Mol Biol Evol. 2007;24:1596-1599
24. Perna NT, Kocher TD. Patterns of nucleotide composition at fourfold degenerate sites of animal mitochondrial genomes. J Mol Evol. 1995;41:353-358
25. Lowe TM, Eddy SR. tRNAscan-SE: a program for improved detection of transfer RNA genes in genomic sequence. Nucleic Acids Res. 1997;25:955-964
26. Clary DO, Wolstenholme DR. The mitochondrial DNA molecule of Drosophila yakuba: nucleotide sequence, gene organization, and genetic code. J Mol Evol. 1985;22:252-271
27. Lewis DL, Farr CL, Kaguni LS. Drosophila melanogaster mitochondrial DNA: completion of the nucleotide sequence and evolutionary comparisons. Insect Mol Biol. 1995;4:263-278
28. Flook PK, Rowell CH, Gellissen G. The sequence, organization, and evolution of the Locusta migratoria mitochondrial genome. J Mol Evol. 1995;41:928-941
29. Beard CB, Mills D, Collins FH. The mitochondrial genome of the mosquito Anopheles gambiae: DNA sequence, genome organization, and comparisons with mitochondrial sequences of other insects. Insect Mol Bio. 1993;12:103-124
30. Thompson JD, Gibson TJ, Plewniak F. et al. The CLUSTALX windows interface: flexible strategies for multiple sequence alignment aided by quality analysis tools. Nucleic Acids Res. 1997;24:173-216
31. Wernersson R, Pedersen AG. RevTrans-Constructing alignments of coding DNA from aligned amino acid sequences. Nucleic Acids Res. 2003;31:3537-3539
32. Castresana J. Selection of conserved blocks from multiple alignments for their use in phylogenetic analysis. Mol Biol Evol. 2000;17:540-552
33. Felsenstein J. PHYLIP (Phylogeny Inference Package) version 3.6. Seattle: Department of Genome Sciences, University of Washington. 2004
34. Huelsenbeck JP, Ronquist F. MRBAYES: Bayesian inference of phylogeny. Bioinformatics. 2001;17:754-755
35. Akaike H. A new look at the statistical model identification. IEEE Trans Automat Contr. 1974;19:716-723
36. Posada D, Crandal KA. Modeltest: testing the model of DNA substitution. Bioinformatics. 1998;14:817-818
37. Abascal F, Zardoya R, Posada D. ProTest: selection of best-fit models of protein evolution. Bioinformatics. 2005;21:2104-2105
38. Lanave C, Preparata G, Saccone C. et al. A new method for calculating evolutionary substitution rates. J Mol Evo. 1984;20:86-93
39. Adachi J, Hasegawa M. Model of amino acid substitution in proteins encoded by mitochondrial DNA. J Mol Evol. 1996;42:459-468
40. Boore JL, lavrov D, Brown WM. Gene translocation links insects and crustaceans. Nature. 1998;393:667-668
41. Junqueira AC, Lessinger AC, Torres TT. et al. The mitochondrial genome of the blowfly Chrysomya chloropyga (Diptera: Calliphoridae). Gene. 2004;339:7-15
42. Hou W R, Chen Yu, Wu Xia. et al. A complete mitochondrial genome sequence of Asian black bear Sichuan subspecies (Ursus thibetanus mupinensis). Int J Biol Sci. 2007;3:85-90
43. Ojala D, Montoya J, Attardi G. tRNA punctuation model of RNA processing in human mitochodria. Nature. 1981;290:470-474
44. Nardi F, Carapelli A, Fanciulli PP. et al. The complete mitochondrial DNA sequence of the basal hexapod Tetrodontophora bielanensis: evidence for heteroplasmy and tRNA translocations. Mol Biol Evol. 2001;18:1293-1304
45. Taanman J W. The mitochondrial genome: structure, transcription, translation and replication. Biochim Biophys Acta. 1999;1410:103-123
46. Zhang DX, Szymura JM, Hewitt GM. Evolution and structural conservation of the control region of insect mitochondrial DNA. J Mol Evol. 1995;40:382-391
47. Zhang DX, Hewitt GM. Insect mitochondrial control region: a review of its structure, evolution and usefulness in evolutionary studies. Biochem Syst Ecol. 1997;25:99-120
48. Kristensen NP, Skalski AW. Phylogeny and paleontology. In: (ed.) Kristensen NP. Lepidoptera: Moths and Butterflies, 1 Evolution, Systematics, and Biogeography, Handbook of Zoology Vol IV, Part 35. Berlin and New York: De Gruyter. 1999
Author contact
![]() Correspondence to: Z.-J. Wei, Department of Biotechnology, Hefei University of Technology, Hefei 230009; People's Republic of China. Tel: 86-551-2901505-8412. Fax: 86-551-2901507. E-mail: zjweiedu.cn
Correspondence to: Z.-J. Wei, Department of Biotechnology, Hefei University of Technology, Hefei 230009; People's Republic of China. Tel: 86-551-2901505-8412. Fax: 86-551-2901507. E-mail: zjweiedu.cn