Impact Factor ISSN: 1449-2288
- Issue 12; 2026
- Issue 11; 2026
- Issue 10; 2026
- Issue 9; 2026
- Issue 8; 2026
- Volume 22; 2026
- Past Issues
- Advance Articles
- Editorial Board
- Cover Images
- Index & Coverage
- Cover Suggestion
- Special Issues
Introduction
Materials and Methods
Results
Discussion
Supplementary Material
Acknowledgements
References

 Global reach, higher impact
Int J Biol Sci 2016; 12(8):1010-1021. doi:10.7150/ijbs.14825 This issue Cite
Research Paper
Cis-Natural Antisense Transcripts Are Mainly Co-expressed with Their Sense Transcripts and Primarily Related to Energy Metabolic Pathways during Muscle Development
Yunxia Zhao1,2, Ye Hou1,2, Changzhi Zhao1,2, Fei Liu1,2, Yu Luan1,2, Lu Jing1,2, Xinyun Li1,2, Mengjin Zhu1,2, ![]() , Shuhong Zhao1,2,
, Shuhong Zhao1,2, ![]()
1. Key Lab of Agricultural Animal Genetics, Breeding and Reproduction of Ministry of Education and Key Laboratory of Swine Genetics and Breeding of Ministry of Agriculture, College of Animal Science and Technology, Huazhong Agricultural University, Wuhan, 430070, PR China.
2. The Cooperative Innovation Center for Sustainable Pig Production, Wuhan, 430070, PR China
Received 2015-12-27; Accepted 2016-4-30; Published 2016-7-17
Abstract

Cis-natural antisense transcripts (cis-NATs) are a new class of RNAs identified in various species. However, the biological functions of cis-NATs are largely unknown. In this study, we investigated the transcriptional characteristics and functions of cis-NATs in the muscle tissue of lean Landrace and indigenous fatty Lantang pigs. In total, 3,306 cis-NATs of 2,469 annotated genes were identified in the muscle tissue of pigs. More than 1,300 cis-NATs correlated with their sense genes at the transcriptional level, and approximately 80% of them were co-expressed in the two breeds. Furthermore, over 1,200 differentially expressed cis-NATs were identified during muscle development. Function annotation showed that the cis-NATs participated in muscle development mainly by co-expressing with genes involved in energy metabolic pathways, including citrate cycle (TCA cycle), glycolysis or gluconeogenesis, mitochondrial activation and so on. Moreover, these cis-NATs and their sense genes abruptly increased at the transition from the late fetal stages to the early postnatal stages and then decreased along with muscle development. In conclusion, the cis-NATs in the muscle tissue of pigs were identified and determined to be mainly co-expressed with their sense genes. The co-expressed cis-NATs and their sense gene were primarily related to energy metabolic pathways during muscle development in pigs. Our results offered novel evidence on the roles of cis-NATs during the muscle development of pigs.
Keywords: Cis-natural antisense transcript, muscle, energy metabolic pathway, pig
Introduction
Natural antisense transcripts (NATs) are endogenous RNAs that include cis- and trans-NATs. Cis-NATs are transcribed from the complementary DNA strand of annotated genes, whereas trans-NATs are transcribed from another region of the genome. Both NATs partially or totally overlap with their sense-annotated genes. In the past decade, cis-NATs have been identified in humans (approximately 30% of annotated genes) [1-3], mice (21.9%) [2, 3], pigs (approximately 30%) [4] and microorganisms [5, 6]. Approximately 7%-70% of the annotated genes of Arabidopsis have been associated with NATs [7-9]. These studies indicate that cis- and trans-NATs are widely expressed in eukaryotic species. Previous works suggested that cis-NATs were the by-products or noise of transcription [10, 11]; however, other studies provided evidence on the roles of cis-NATs in gene expression regulation [12-15]. However, the biological functions of cis-NATs are still largely unknown because of the lack of systematic evaluation of their expression and sense genes.
Pioneer studies on eukaryotic identified four mainly antisense-mediated gene expression regulation mechanisms, including transcriptional interference, RNA masking, double-stranded RNA-dependent (dsRNA-dependent) mechanisms, and chromatin remodeling [16-18]. Transcriptional interference that could result in either transcription or transcription arrest in a single-direction and sense-antisense (SA) pair would be inversely expressed [14, 15, 19]. Under RNA masking, NATs could mask the splice sites on their sense pre-mRNA, which results in the generation of new isoforms of their sense genes [20-22]. Through RNA masking, NATs may be co-expressed with preferred splice variants and inversely expressed with repressed variants. In dsRNA-dependent mechanisms, including RNA editing and RNA interference, NATs are co-expressed with their sense genes [23, 24]. For chromatin remodeling, the transcription of NATs is involved in the expression of monoallelic genes or the silencing of nearby gene clusters [25-27]. The NATs and the genes in silenced clusters exhibit inverse expression under this mechanism. Determining the mechanism through which double-stranded RNA formed by the co-expressed NATs and their sense genes avoids degradation by endogenous RNAase may reveal a novel mechanism by which NATs regulate gene expression [28-30].
Skeletal muscle is a component of the motor system and also a major determinant of the resting energy expenditure of mammals [31]. Muscle development is a complex process that consists of four main stages: (i) differentiation of myogenic progenitors into myoblasts, (ii) fusion of myoblasts into myotubes, (iii) differentiation of myotubes into myofibers, and (iv) growth and maturation of myofibers [32-34]. The total number of fibers in pigs is largely determined by two major waves of muscle development: fetal stage 30-60-day period and 54-90-day period [33, 35, 36]. From birth to the first several weeks, myofibers differentiate into type I, IIa, IIx, and IIb muscle fibers [37, 38]. Type I muscle fibers are rich in mitochondria and enzymes that are involved in oxidative metabolism. Type IIb fibers exhibit the lowest levels of mitochondrial content and oxidative enzymes, whereas the oxidative functions of type IIa and IIx lie between types I and IIb [39, 40].
Previous studies revealed that cis-NATs are involved in the development of skeletal muscles. The cis-NATs of the MHC gene cluster (Myh1, Myh2, and Myh4) reportedly affect the expression patterns of different MHC genes in rats. The cis-NAT of Myh2 is significantly up-regulated in rat skeletal muscles after spinal cord isolation. Moreover, the expression of Myh2 cis-NAT negatively and positively correlates with the expression of Myh2 and Myh1, respectively, which could influence the composition of muscle fibers and meat quality [41]. Furthermore, the cis-NATs of PINK1 could target this protein coding gene to generate the PINK1 splice variant in human skeletal muscle tissue [20]. Recently, whole genome studies have revealed that cis-NATs widely exist in the muscle tissue of human [1] and pig [4]. However, the expression characteristics, biological functions, and regulatory roles of cis-NATs in skeletal muscle development remain unclear. In the present study, we conducted a genome-wide identification of cis-NATs in muscle tissue by using the digital gene expression (DGE) profiling libraries of Lantang (LT) and Landrace (LR) pigs and the dUTP RNA-seq data of Yorkshire (YS) pigs. We also systematically analyzed the expression characteristics and functions of cis-NATs during the muscle development of pigs.
Materials and Methods
DGE data download and dUTP sequencing
The clean data of 20 DGE libraries with series ID GSE25406 were downloaded from Gene Expression Omnibus. This DGE data were generated by sequencing the longissimus skeletal muscle samples of LT and LR at fetal days 35, 49, 63, 77, and 91 and postnatal days 2, 28, 90, 120, and 180 [42].
Moreover, the total RNA of the longissimus muscle tissues of six 180-day old YS pigs was isolated using the TRIzol reagent (Invitrogen). Equal RNA of each sample was used for dUTP strand-specific sequencing library construction. The second-strand marking mix was employed to replace dTTP with dUTP during second-strand cDNA synthesis. RNA sequencing was performed by a commercial service in Genergy Biotechnology Company (Shanghai, China). All animal experimental protocols were approved by the Ethics Committee of Huazhong Agricultural University (HZAUMU2013-0005).
Sequence data alignment and annotation
All sequencing data were mapped to the pig genome (Sscrofa10.2) by utilizing bowtie 0.12.7 [43]. Up to one and two mismatches were allowed for the unique mapping of the DGE and dUTP data, respectively. The unmapped tags of the DGE data were also mapped to the Sscrofa RNA reference, and one mismatch was allowed. The genome-mapped data were annotated using the gff3 file of the Sscrofa10.2 genome (ftp://ftp.ncbi.nlm.nih.gov/genomes/Sus_scrofa/). For the RNA reference-mapped tags, uniquely mapped tags of each gene were selected for further analysis.
Genome-wide identification of SA genes
The copy number of raw clean tags of DGE data was normalized to tags per million (TPM) [42]. The TPM of tags that belonged to up two transcripts were equally divided. The expression level of the sense and antisense strands of annotated genes was summed by the TPM of sense exon-mapped tags and all antisense tags, respectively. The SA genes that were identified with the TPM of the sense and antisense strands were ≥ 5 and ≥ 2.5, respectively.
The six dUTP libraries were pooled for further analysis. The expression level of both strands of annotated genes was calculated using the same method as that of the DGE data. The SA genes of the YS pigs identified on the basis of the read number of the sense and antisense strands must be ≥ 30 and 5, respectively.
Genome-wide identification of cis-NAT regions
For DGE library construction, NlaIII (5′-CATG-3′) was used to digest the cDNA. Then, cDNA fragments with a Poly A tail were isolated using Poly T-coated beads. The adapter with the MmeI enzyme site was ligated with the isolated cDNA fragments. Finally, 21 bp tags were generated for sequencing through digestion with the MmeI enzyme. The sense and antisense tags could be distinguished on the basis of the cleaving site sequence of NlaIII (Supplementary Figure S1). To avoid a false positive, we further selected the antisense tags for cis-NAT identification on the basis of the following criteria: (i) the tags should be mapped on the antisense strands of the annotated genes. (ii) The TPM of tags should be at least two. (iii) The TPM of tags should be higher than their corresponding sense tags or 5′ upstream tags on the same strands. The antisense tags in each DGE library were identified independently.
The cis-NAT region was finally identified through the following steps: (i) the neighboring antisense tags of the DGE data were clustered as one cis-NAT region when the TPM of the 3′ terminal tag was higher than that of the 5′ terminal tag. (ii) The overlapped cis-NAT regions that were identified from different DGE libraries were merged into one large cis-NAT region. (iii) For the dUTP data, the cis-NAT regions were identified directly by assembling the antisense sequence fragments. (iv) The overlapped cis-NAT regions from the DGE and dUTP data were merged again to determine the final cis-NAT regions.
Correlation analysis of cis-NATs and their sense genes
The expression profiling of cis-NATs was calculated first. The antisense tags that significantly positively (P < 0.1) correlated with their sense tags were removed to avoid the interference of sense tags. The expression profiling of cis-NATs was summed by the remaining antisense tags within the cis-NAT regions.
The Pearson correlation between the cis-NAT and sense gene pairs (total TPM of one of the pair ≥ 5 and detected stages ≥ 3) was analyzed. The P value was adjusted by the BH method, and the significance level was FDR < 0.05. Range analysis was also performed to investigate the expression pattern between the cis-NAT and sense gene pairs. Cis-NAT and sense gene pairs were selected for the range analysis on the basis of the following criteria: For both cis-NAT and its sense genes, TPM >2 stages must be at least four, and the total TPM should be at least 10. The fold change (FC) between the sense gene and its cis-NAT was calculated at each stage, and the maximum and minimum FC stages were identified. The correlated cis-NAT and sense gene pairs were determined when their FC between these two stages was higher than 1.5. The co-expressed pairs were determined when their change direction of FC was the same between these two stages. Otherwise, they were identified as inversely expressed pairs.
Correlation analysis of cis-NATs and the isoforms of sense genes
The isoforms of the SA genes were identified by utilizing Tophat 2.0.9 [44] and Cufflinks [45]. The expression level of each isoform was defined using the fragments per kilo base of exon per million fragments mapped (FPKM) in accordance with the following formula [46]:

The correlation between the cis-NATs and their sense gene isoforms was detected through Pearson correlation analysis. The significant threshold was set at |R| > 0.75.
Identification of differentially expressed transcripts
The differential expression of the annotated genes and cis-NATs among different stages was identified by employing edgeR [47]. The read counts of the annotated genes and cis-NATs were normalized by edgeR. The criterion of significantly different expression was |log2FC| ≥ 1 and FDR < 0.01.
qPCR was performed to validate the differentially expressed (DE) sense genes and their cis-NATs. The primers are listed in Supplementary Table S2. qPCR was carried out on a BIO-RAD CFX384 Real-Time System using SYBR Green PCR Master Mix Kit (BIO-RAD, America). The expression levels of the genes were analyzed by adopting the 2-ΔΔCt method, and the 18S gene was employed as the internal control. Student's t-test was used to analyze the expression difference between postnatal day 2 and day 180.
Functional annotation
The significant biological process GO terms (P < 0.01) and pathways (P < 0.05) of the DE annotated genes and cis-NATs were enriched via DAVID Bioinformatics Resources 6.7 [48]. Significant pathways containing less than five correlated cis-NAT and sense gene pairs were discarded. The distribution of the correlated cis-NAT and sense gene pairs in these significant pathways during muscle development was investigated. Genes involved in energy metabolic pathways and their correlated cis-NATs were visualized using Cystoscape [49].
Results
A total of 3,561 SA genes have been identified based on the data of 20 DGE libraries
To identify the cis-NATs, we identified the genes with antisense transcripts first, which were defined as SA genes. A total of 65.06 million unique mapping tags were identified from 20 DGE libraries. Among these tags, 47.96 million (73.72%) were mapped onto annotated genes and 6.18 million (9.49%) were mapped onto their antisense strands. These antisense strand-mapped tags were further used to detect the SA genes and cis-NATs. Moreover, the dUTP sequencing data of six YS pigs were used to confirm the results of the SA genes and cis-NATs identified from the DGE data. A total of 33.60 million uniquely mapped reads were found in the dUTP data. Among these mapped reads, 22.02 million (65.52%) and 599,047 (1.78%) were mapped on the sense and antisense strands of the annotated genes, respectively.
A total of 3,561 and 2,862 SA genes were identified using the DGE and dUTP data, respectively (Supplementary Table S3). Moreover, 1,182 SA genes were identified in both DGE and dUTP data. Fisher's exact test showed that the overlap between these two types of data was significant (P < 0.01) (Supplementary Figure S2 and Supplementary Table S4).
In total, 3,306 cis-NAT regions have been identified
The cis-NATs were further identified on the basis of the results of the SA genes. First, the characteristics of the mapped tags of the annotated genes were analyzed. A total of 54.6% of the annotated genes contained only one tag, and the others had more than one tag (TPM ≥ 2) (Supplementary Figure S3). For the later genes, the TPM of 83.68% of the 5′ terminal tags was lower than that of the 3′ terminal tags (Supplementary Figure S3). Therefore, the neighboring tags could be clustered when the TPM of the 5′ terminal tags was lower than that of the 3′ terminal tags. Statistical results demonstrated that approximately 80% of the tags were clustered (Supplementary Figure S3). Among these tags, 37.6% and 40.4% of the sense genes contained one cluster and two clusters, respectively; the other sense genes contained at least three clusters (Supplementary Figure S3). The results of expression correlation analysis indicated that the clusters and full-length annotated genes were significantly positively correlated (P < 0.01, R > 0.5) (Supplementary Table S5).
To identify the cis-NATs, the antisense tags of the annotated genes were also clustered. A total of 3,523 cis-NAT regions of the 2,469 SA genes were identified. Furthermore, 892 SA genes did not detect any cis-NAT region because of a single tag or the TPM of the 5′ terminal tags was higher than that of the 3′ terminal tags. The cis-NAT regions were also confirmed by using dUTP data. Based on that, 1,081 of the 3,523 identified cis-NATs were merged into 864 cis-NATs. Moreover, statistical results showed that 56.94% (492) of these merged cis-NATs were longer than 1 kb (Supplementary Figure S3). Finally, 3,306 cis-NAT regions of 2,469 SA genes were identified (Supplementary Data 1: gff file of cis-NATs).
Validation of Cis-NATs
RT-PCR was performed to further confirm the cis-NATs. First, the DNA and RNA samples were isolated from the longissimus muscle tissues of 2-, 40-, and 180-day old YS pigs. Six cis-NATs and their sense genes were randomly selected for validation. Two pairs of primers were specifically designed for each of the SA genes. One primer pair was designed for sense transcription amplification, which was bound to different exons and could be used to amplify both cDNA and DNA templates. The size of the PCR products of the cDNA template was less than that of the DNA template. Thus, only one band was amplified for each cDNA sample, and none of the cDNA samples was contaminated with DNA. The other primer pair was designed for cis-NAT amplification. For the primers of each cis-NAT, at least one primer was designed to bind to the intron regions of its sense gene. Therefore, the sense gene could not be amplified by the primers of cis-NATs. PCR results showed that all the six cis-NATs could be amplified, and the cis-NAT band was similar in size to the DNA template band (Supplementary Figure S4). In addition, 100 sense genes related to muscle growth were randomly selected in accordance with the GO terms (Supplementary Data 2), and 45 sense genes were confirmed to have antisense transcripts on the basis of the latest annotation of the human, mouse, or pig genome.
Cis-NATs were primarily expressed at fetal stages and sharply decreased after birth
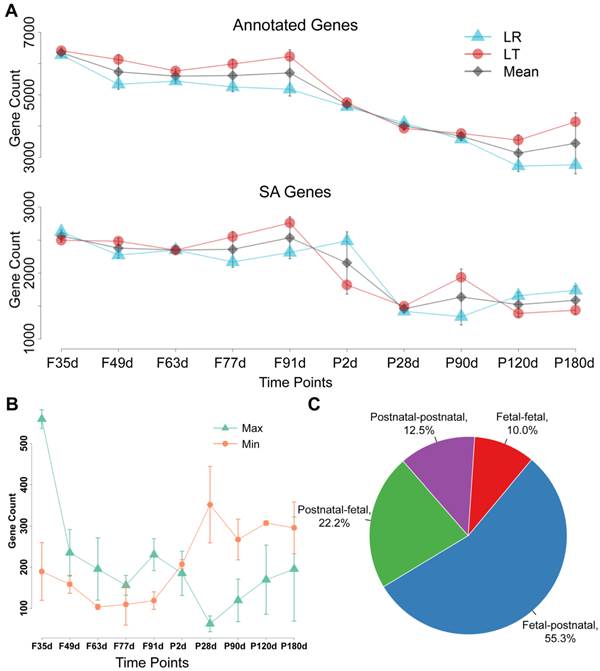
The expression patterns of the SA genes and cis-NATs were further investigated. The number of annotated genes and SA genes at the fetal stages was obviously higher than that at the postnatal stages (Figure 1A). A sharp decrease in these expression patterns was observed during the transition of fetal day 91 to postnatal day 28 (Figure 1A). The distributions of the highest and lowest expressed cis-NATs during the 10 stages were statistically analyzed. The highest expressed cis-NATs were mainly distributed at the fetal stages, and the lowest expressed cis-NATs were mainly distributed at the postnatal stages. Extreme changes occurred during the transition of fetal day 91 to postnatal day 28 (Figure 1B). To compare and analyze further the expression of cis-NATs between the fetal and postnatal stages, the cis-NATs were classified into four categories: (i) The highest and lowest expression levels appeared at the fetal stages (fetal-fetal); (ii) The highest and lowest expression levels appeared at the postnatal stages (postnatal-postnatal); (iii) The expression level was the highest at the fetal stages and the lowest at the postnatal stages (fetal-postnatal); (iv) The expression level was the highest at the postnatal stages and the lowest at the fetal stages (postnatal-fetal). Statistical results showed that more than 50% of the cis-NATs belonged to the fetal-postnatal category (Figure 1C). These results indicate that the cis-NATs were highly expressed at the fetal stages and sharply decreased after birth.
Expression pattern of cis-NATs during muscle development. Letters F and P on the x -axis indicate fetal and postnatal, respectively. LR and LT represent the Landrace and Lantang pig breeds, respectively. (A) Number of expressed annotated genes and SA genes at each stage. Blue triangle (Δ), red dot (o), and grey diamond (◊) indicate LR pigs, LT pigs, and mean value of LR and LT pigs, respectively. (B) Distribution of the highest and lowest expressed cis-NATs. The number of the highest and lowest expressed cis-NATs at each stage was represented by a green triangle (Δ) and orange dot (o), respectively. (C) Statistical results of the four types of cis-NATs. Fetal-fetal type means that both the highest and lowest expression levels of cis-NATs occurred at the fetal stages. Postnatal-postnatal type denotes that both conditions occurred at the postnatal stages. Fetal-postnatal type means that the highest expression occurred at the fetal stages, whereas the lowest expression occurred at the postnatal stages. Postnatal-postnatal type represents the opposite of the fetal-postnatal type.
Cis-NATs and their sense genes were co-expressed
In total, 1,039 cis-NAT and sense gene pairs in LR and 1,144 in LT significantly correlated accordance with Pearson correlation analysis (|R| > 0.70 and FDR < 0.05) (Table 1). Moreover, 656 significantly correlated cis-NAT and sense gene pairs were detected in both LR and LT pigs. Fisher's exact test showed that the overlap was significant (P < 0.01) (Supplementary Table S6). The correlation between the expression levels of cis-NATs and their sense genes was also analyzed using the range analysis method. A total of 672 (LR) and 682 (LT) correlated cis-NAT and sense gene pairs were identified (Table 1). Moreover, 230 correlated pairs were determined in the two breeds, and the overlap was significant (P < 0.01) (Supplementary Table S7). The correlated pairs identified by these two methods were combined. Among the identified correlated pairs, 295 (LR) and 297 (LT) were determined by these two methods. Only 39 (LR) and 47 (LT) correlated pairs did not coincide between these two methods, and they were omitted. Finally, 1,379 (41.71%) correlated pairs in LR and 1,386 (41.92%) in LT were identified. Among them, 75.05% (LR) and 81.53% (LT) were co-expressed (Figure 2A and Supplementary Data 3). All of the overlapping correlated pairs identified by these two methods are shown in Figure 2B. Four co-expressed cis-NAT and sense gene pairs were validated by employing the qPCR method. The results showed that all of the four cis-NAT and sense gene pairs were co-expressed from postnatal day 2 to day 180 (Figure 2E).
Statistical analysis of expression correlation between sense genes and their cis-NATs
| Analysis | Breed | Correlation | Total | Overlap | ||
|---|---|---|---|---|---|---|
| Positive/Co-expression (%) | Negative/Inverse (%) | Count | Percentage | |||
| Pearson (FDR <0.05) | LR a | 1,019 (98.08%) | 20 (1.92%) | 1,039 | 656** | 63.14% |
| LT b | 1,138 (99.48%) | 6 (0.52%) | 1,144 | 57.34% | ||
| Range analysis (log2FC ≥ 1) | LR a | 300 (44.51%) | 374 (55.49%) | 674 | 230** | 34.12% |
| LT b | 286 (48.81%) | 300 (51.19%) | 586 | 39.25% | ||
a LR, Landrace; b LT, Lantang; **, P < 0.01
Identification of correlated cis-NAT and sense gene pairs. SA, LR, and LT indicate sense-antisense, Landrace, and Lantang pigs, respectively. (A) Number of correlated cis-NAT and sense gene pairs. (B) Venn plot of the correlated cis-NAT and sense gene pairs. The correlated cis-NAT and sense gene pairs were analyzed using both Pearson correlation and range methods. (C) Statistical analysis of the positively and negatively correlated SA pairs (left bar plot) and the three types of SA genes (without any isoforms, with unexpressed isoforms, and with more isoforms) (right bar plot) in the muscle tissue of adult YS pigs. The SA pairs under the left bar indicate the isoforms of the SA gene and its cis-NAT pairs. (D) Illustration of cis-NATs related to the alternative splicing of their sense genes. FPKM and TTS denote fragments per kilobase of exon per million fragments mapped and transcription termination site, respectively. (E) Four co-expressed cis-NAT and sense genes were detected using qPCR.
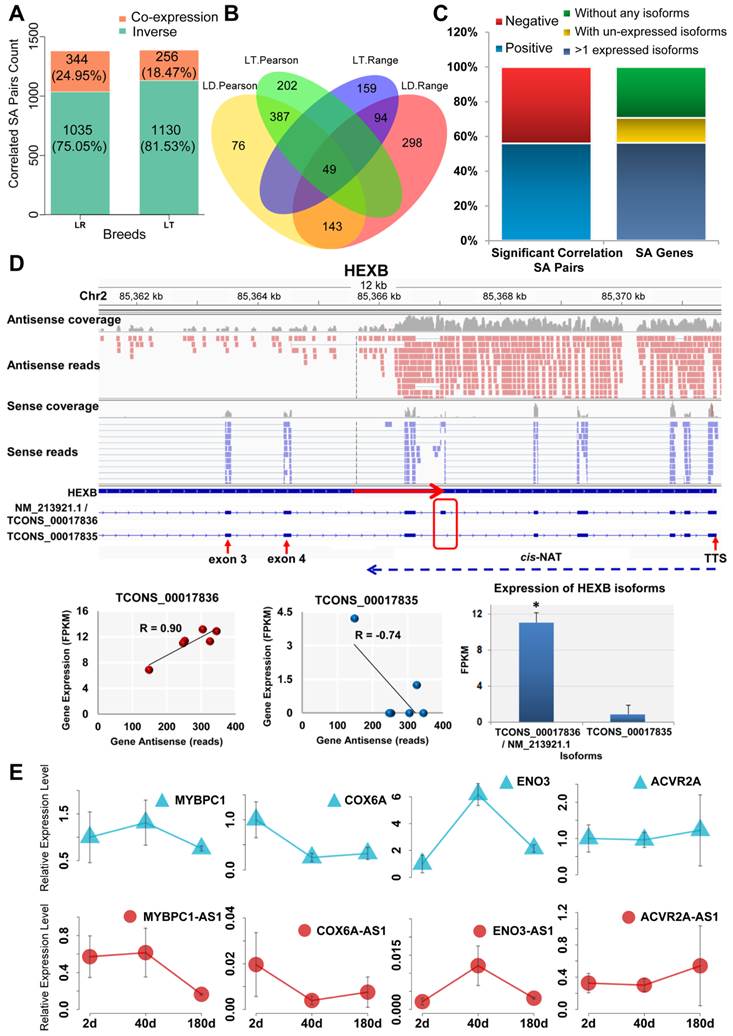
The correlation between cis-NATs and the isoforms of their sense genes was further analyzed. A total of 384 SA pairs of 355 SA genes exhibited significant (R > 0.75 or R < -0.75) correlations (Supplementary Data 4), and 55.99% positively correlated (Figure 2C left bar plot). Furthermore, 200 SA genes with at least two expressed isoforms were selected to detect the correlation between the cis-NATs and specific isoforms (Figure 2C right bar plot). The correlation between the cis-NATs and specific isoforms of the SA genes was observed. The gene structure and specific correlations in the HEXB and COPB2 SA genes, as two typical illustrations, are shown (Figure 2D and Supplementary Figure S2). For these two genes, the partial alternative splicing sites were masked by their cis-NATs. A strong positive correlation (R=0.9) existed between cis-NAT and the dominant expressed isoform NM_213921.1 / TCONS_00017836 of the HEXB SA gene, and a similar positive correlation (R=0.85) was observed in the COPB2 SA gene (Figure 2D and Supplementary Figure S2). Moreover, the cis-NAT was moderately and negatively correlated with another isoform TCONS_00017835 of the HEXB SA gene (R = -0.74). Weak positive and negative correlations were also observed between the cis-NAT and the other isoforms of the COPB2 SA gene (Supplementary Figure S2). These results support the hypothesis that cis-NATs could affect the alternative splicing and co-expressed with their preferred isoforms of the sense genes.
Over 1,200 DE cis-NATs were identified during muscle development
DE cis-NATs and annotated genes were also analyzed. During the 10 stages of muscle development, 9,209 (LR) and 8,860 (LT) DE annotated genes were identified (log2FC ≥ 1 and FDR < 0.01) (Supplementary Table S8 and Supplementary Data 5). Moreover, 1,281 (LR) and 1,211 (LT) DE cis-NATs were detected (Supplementary Table S8 and Supplementary Data 5). The divergence of the DE cis-NATs and annotated genes was calculated through systematic cluster analysis (Figure 3). The divergence of the annotated genes and cis-NATs was similar in the two breeds. All of the fetal stages were clustered together, as well as the postnatal stages. These results indicate that the expression patterns of annotated genes and cis-NATs at the fetal stages significantly differed at the postnatal stages. In addition, three important transitions, namely, F35 to F49, F91 to P28 d, and P90 to P120 d, were determined on the basis of the number of DE cis-NATs (Supplementary Table S8).
Heat map of DE transcripts during the 10 stages of muscle development. LR, Landrace; LT, Lantang. (A) Heat map of DE annotated genes in LR pigs. (B) Heat map of DE cis-NATs in LR pigs. (C) Heat map of DE annotated genes in LT pigs. (D) Heat map of DE cis-NATs in LT pigs. (E) The expression profiles of five transcriptions at postnatal day 2 and day 180 of LR pigs were detected using the qPCR method.
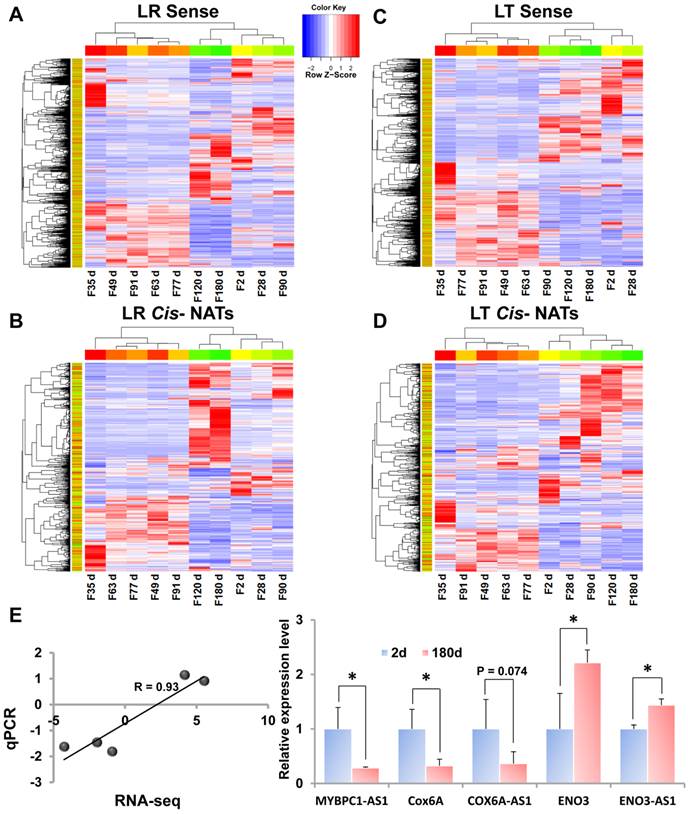
Furthermore, the DE cis-NATs and annotated genes were validated by the qPCR method. Five transcriptions, namely, two DE cis-NATs (MYBPC1-AS1 and ENO3-AS1, FDR<0.05), one un-DE cis-NAT (COX6A-AS1, FDR=0.08), and two DE annotated genes (COX6A and ENO3, FDR<0.05), between postnatal day 2 and day 180 were selected for qPCR validation (Supplementary Data 5). The qPCR results were similar to the RNA-seq results, and the correlation coefficient of the FC values between the two methods was 0.93 (Figure 3E).
Cis-NATs participated in muscle development by co-expressing with the annotated genes of energy metabolic pathways in pigs
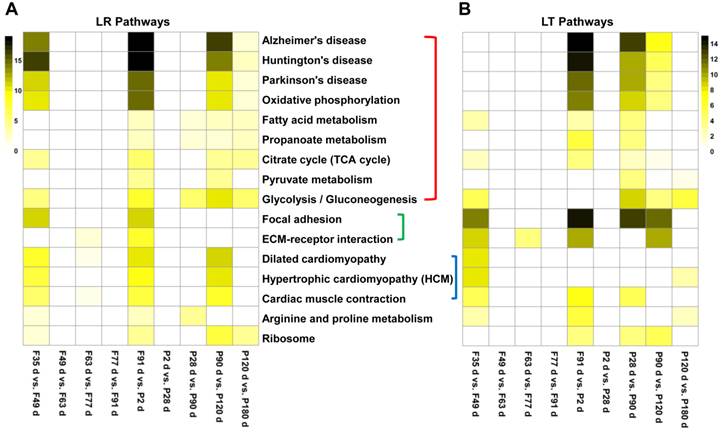
The functional annotation of the cis-NATs in muscle development was based on their correlated annotated genes. The enriched pathways of the DE annotated genes or sense genes of DE cis-NATs were analyzed using DAVID. The top 16 significant KEGG pathways were identified on the basis of the number of correlated cis-NAT and sense gene pairs. Eight of the 16 pathways were involved in energy metabolism, including TCA cycle, fatty acid metabolism, propanoate metabolism, pyruvate metabolism, glycolysis or gluconeogenesis, oxidative phosphorylation, Alzheimer's disease, Huntington's disease, and Parkinson's disease (Figure 4). The eight other pathways were involved in myoblast differentiation and muscle growth, which included arginine and proline metabolism, hypertrophic cardiomyopathy, cardiac muscle contraction and so on (Figure 4). Moreover, the results of GO term enrichment demonstrated that the bioprocesses of energy metabolism and muscle development could be regulated by the correlated cis-NAT and sense gene pairs (Supplementary Data 6).
Heat map of the top 16 enriched pathways. LR, Landrace; LT, Lantang. (A) Heat map of the top 16 enriched pathways in LR pigs. (B) Heat map of the top 16 enrichment pathways in LT pigs. The significant pathways were enriched using DAVID tool and ranked on the basis of the number of correlated sense gene and cis-NAT pairs they have.
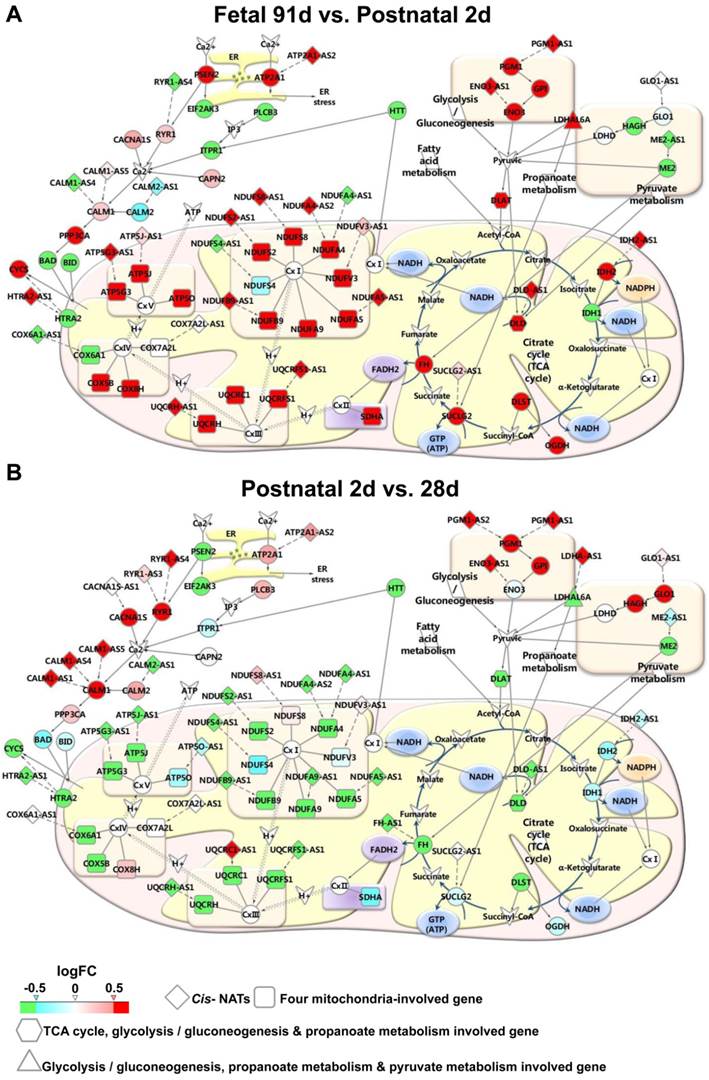
The expression details of the genes and their correlated cis-NATs were further studied. Most of the genes were involved in energy metabolic pathways, and their cis-NATs were gradually up-regulated from fetal day 49 to postnatal day 2 in the two breeds (Figure 5A and Supplementary Data 7). Furthermore, these genes and their correlated cis-NATs were abruptly down-regulated during the transition from postnatal day 2 to day 28 in the LR pigs (Figure 5C and Supplementary Data 7) and from postnatal day 28 to day 90 in the LT pigs (Supplementary Figure S3 and Supplementary Data 7). These results indicate that cis-NATs participated in muscle development by co-expressing with the genes involved in energy metabolic pathways.
Expression patterns in energy metabolic pathways. The expression details of genes involved in energy metabolic pathways and their correlated cis-NATs are illustrated. (A-B) Expression patterns of transition fetal day 91 to postnatal day 2 and postnatal day 2 to postnatal day 28. Green, blue, pink, and red fill colors represent log2FC ≤ -0.5, -0.5 < log2FC ≤ 0, 0 < log2FC < 0.5, and log2FC ≥ 0.5, respectively. LR, Landrace.
Discussion
In this study, cis-NATs were first identified during muscle development. The expression patterns and functions of these cis-NATs were thoroughly analyzed. Results showed that the cis-NATs were mainly co-expressed with their sense genes and were mainly related to energy metabolic pathways during muscle development. In the past decade, studies on cis-NATs mainly focused on identification [3, 7, 8, 50], conservation analysis [1, 3, 50, 51], or tissue-specific expression detection [7, 50]. Previous studies suggested that cis-NATs were transcriptional noise [10, 11], whereas other studies have confirmed that cis-NATs are pervasive in various species [3, 7, 8, 50] and regulate gene expression [12-15]. A previous work reported that 33.7% annotated genes have cis-NATs in the muscle of adult pigs and considered 226 cis-NATs to be cis-antisense eQTLs (expression quantitative trait loci) [4]. However, the expression characteristics and roles of cis-NATs during muscle development remain to be studied comprehensively. Therefore, this study offered new evidence on the roles of cis-NATs during muscle development in pigs.
We systematically analyzed the expression patterns of cis-NATs during the muscle development of pigs. In general, the number of cis-NATs expressed at the fetal stages was higher than that at the postnatal stages. These results indicate that cis-NATs are mainly expressed at the fetal stages and play important roles during muscle development. Moreover, approximately 40% of the cis-NATs correlated with their sense genes at the transcriptional level, and about 80% of them were co-expressed. Previous studies reported that NATs and their sense genes are co-expressed in human HeLa cells [28] and D. melanogaster S2 cells [31]. In humans, 672 of the 1,498 cis-NATs and their sense genes were identified to be co-expressed on the basis of the expression profile analysis in 49 tissues [1]. The IGF2 cis-NAT IGF2-AS1 is reportedly lost in imprinting and co-expressed with IGF2 in human Wilms' Tumor [30, 52].
These results indicate that the expression of cis-NATs positively correlated with the expression of their sense genes. This finding exceeded our expectation because we assumed that the cis-NATs would negatively correlate with the expression of their sense genes on the basis of the mechanism of RNAi. However, the mechanisms underlying the co-expression between the cis-NATs and their sense genes remain largely unknown. One of the possible explanations is that the cis-NATs and their sense gene pairs could escape the dicer-associated RNAi pathway [28]. Another possibility is that the cis-NATs could mask the specific sites of the RNAs of the sense genes and maintain their stability [22, 53-55]. In the present study, the cis-NATs could positively correlate with the specific isoforms of their sense genes. This finding supports that cis-NATs could mask the alternative splicing sites and promotes the expression of the specific isoforms of their sense genes.
The SA genes that were correlated with the cis-NATs were mainly involved in energy metabolic pathways, including TCA cycle, glycolysis or gluconeogenesis, fatty acid metabolism, pyruvate metabolism, propanoate metabolism, and mitochondrial activation pathways. In these pathways, the respiration chain complex subunits encoding genes NDUFA4, NDUFV3, UQCRC1, ATP5J, and COX7A2L and other important energy metabolic genes IDH2 [56], DLD [57], PINK1 [20] and, SUCLG2 [58, 59] were determined to have co-expressed cis-NATs. Therefore, we deduced that cis-NATs play important roles in muscle development by co-expressing with genes involved in energy metabolic pathways. Moreover, all the co-expressed energy metabolic-related genes and their cis-NATs sharply increased form fetal day 63 to postnatal day 2 in the LR and LT pigs. After birth, the cis-NATs were sharply down-regulated from postnatal day 2 to day 28 in the LR pigs. Meanwhile, the expression profile of the cis-NATs was almost unchanged from day 2 to day 28 but sharply down-regulated from postnatal day 28 to day 90 in the LT pigs. Previous studies indicated that secondary muscle fibers begin to form around fetal day 60 and last until the end of the fetal stages; meanwhile, type II muscle fibers begin to form at the early postnatal stages [38, 43]. Thus, we deduced that the cis-NATs could be involved in the development of muscle fibers in pigs. Furthermore, previous studies determined that the proportion of type II muscle fibers is higher in LR than that in LT pigs at the early postnatal stages [60, 61]. This occurrence was coincidental with the earlier down-regulation of energy metabolic pathways involving genes and their correlated cis-NATs in the LR pigs at the early postnatal stages. Thus, cis-NATs may also relate to muscle fiber proportion at the early postnatal stages in pigs.
Supplementary Material
Additional File 1Supplementary figures and tables.
Supplementary Data 1.
Supplementary Data 2.
Supplementary Data 3.
Supplementary Data 4.
Supplementary Data 5.
Supplementary Data 6.
Supplementary Data 7: video A.
Supplementary Data 7: video B.
Acknowledgements
This research was supported by an NSFC Outstanding Youth grant (31025026), and grants from the National Key Basic Research Program of China (2012CB124702) and National Natural Science Foundation of China (31372291).
Authors' contributions
XL, MZ and SZ conceived and supervised the project. YZ, FL, YL and LJ undertook the analysis. YZ wrote the paper. CZ and YH performed the PCR experiments. All authors read and approved the final manuscript.
Competing Interests
The authors have declared that no competing interest exists.
References
1. Chen J, Sun M, Hurst LD. et al. Genome-wide analysis of coordinate expression and evolution of human cis-encoded sense-antisense transcripts. Trends Genet. 2005;21:326-9
2. Katayama S, Tomaru Y, Kasukawa T. et al. Antisense transcription in the mammalian transcriptome. Science. 2005;309:1564-6
3. Zhang Y, Liu XS, Liu QR. et al. Genome-wide in silico identification and analysis of cis natural antisense transcripts (cis-NATs) in ten species. Nucleic Acids Res. 2006;34:3465-75
4. Chen C, Wei R, Qiao R. et al. A genome-wide investigation of expression characteristics of natural antisense transcripts in liver and muscle samples of pigs. PLoS One. 2012;7:e52433
5. Lasa I, Toledo-Arana A, Dobin A. et al. Genome-wide antisense transcription drives mRNA processing in bacteria. PNAS. 2011;108:20172-7
6. Georg J, Hess WR. cis-antisense RNA, another level of gene regulation in bacteria. Microbiol Mol Biol Rev. 2011;75:286-300
7. Wang XJ, Gaasterland T, Chua NH. Genome-wide prediction and identification of cis-natural antisense transcripts in Arabidopsis thaliana. Genome Biol. 2005;6:R30
8. Wang H, Chung PJ, Liu J. et al. Genome-wide identification of long noncoding natural antisense transcripts and their responses to light in Arabidopsis. Genome Res. 2014;24:444-53
9. Yuan C, Wang J, Harrison AP. et al. Genome-wide view of natural antisense transcripts in Arabidopsis thaliana. DNA Res. 2015;22:233-43
10. Wang J, Zhang J, Zheng H. et al. Mouse transcriptome: neutral evolution of 'non-coding'complementary DNAs. Nature. 2004:431
11. Struhl K. Transcriptional noise and the fidelity of initiation by RNA polymerase II. Nat Struct Mol Biol. 2007;14:103-5
12. Stazic D, Lindell D, Steglich C. Antisense RNA protects mRNA from RNase E degradation by RNA-RNA duplex formation during phage infection. Nucleic Acids Res. 2011;39:4890-9
13. Berteaux N, Aptel N, Cathala G. et al. A novel H19 antisense RNA overexpressed in breast cancer contributes to paternal IGF2 expression. Mol Cell Biol. 2008;28:6731-45
14. Wutz A, Smrzka OW, Schweifer N. et al. Imprinted expression of the Igf2r gene depends on an intronic CpG island. Nature. 1997;389:745-9
15. Prescott EM, Proudfoot NJ. Transcriptional collision between convergent genes in budding yeast. PNAS. 2002;99:8796-801
16. Lavorgna G, Dahary D, Lehner B. et al. In search of antisense. Trends Biochem Sci. 2004;29:88-94
17. Lapidot M, Pilpel Y. Genome-wide natural antisense transcription: coupling its regulation to its different regulatory mechanisms. EMBO Rep. 2006;7:1216-22
18. Faghihi MA, Wahlestedt C. Regulatory roles of natural antisense transcripts. Nat Rev Mol Cell Biol. 2009;10:637-43
19. Osato N, Suzuki Y, Ikeo K. et al. Transcriptional interferences in cis natural antisense transcripts of humans and mice. Genetics. 2007;176:1299-306
20. Scheele C, Petrovic N, Faghihi MA. et al. The human PINK1 locus is regulated in vivo by a non-coding natural antisense RNA during modulation of mitochondrial function. BMC Genomics. 2007;8:74
21. Hastings ML, Milcarek C, Martincic K. et al. Expression of the thyroid hormone receptor gene, erbAalpha, in B lymphocytes: alternative mRNA processing is independent of differentiation but correlates with antisense RNA levels. Nucleic Acids Res. 1997;25:4296-300
22. Hastings ML, Ingle HA, Lazar MA. et al. Post-transcriptional regulation of thyroid hormone receptor expression by cis-acting sequences and a naturally occurring antisense RNA. J Biol Chem. 2000;275:11507-13
23. Watanabe T, Totoki Y, Toyoda A. et al. Endogenous siRNAs from naturally formed dsRNAs regulate transcripts in mouse oocytes. Nature. 2008;453:539-43
24. Kawaji H, Nakamura M, Takahashi Y. et al. Hidden layers of human small RNAs. BMC genomics. 2008;9:157
25. Tufarelli C, Stanley JAS, Garrick D. et al. Transcription of antisense RNA leading to gene silencing and methylation as a novel cause of human genetic disease. Nat Genet. 2003;34:157-65
26. Ohhata T, Hoki Y, Sasaki H. et al. Crucial role of antisense transcription across the Xist promoter in Tsix-mediated Xist chromatin modification. Development. 2008;135:227-35
27. Pandey RR, Mondal T, Mohammad F. et al. Kcnq1ot1 antisense noncoding RNA mediates lineage-specific transcriptional silencing through chromatin-level regulation. Mol cell. 2008;32:232-46
28. Faghihi MA, Wahlestedt C. RNA interference is not involved in natural antisense mediated regulation of gene expression in mammals. Genome Biol. 2006;7:R38
29. Czech B, Malone CD, Zhou R. et al. An endogenous small interfering RNA pathway in Drosophila. Nature. 2008;453:798-802
30. Okutsu T, Kuroiwa Y, Kagitani F. et al. Expression and imprinting status of human PEG8/IGF2AS, a paternally expressed antisense transcript from the IGF2 locus, in Wilms' tumors. J Biochem. 2000;127:475-83
31. Zurlo F, Larson K, Bogardus C. et al. Skeletal muscle metabolism is a major determinant of resting energy expenditure. J Clin Invest. 1990;86:1423
32. Buckingham M, Bajard L, Chang T. et al. The formation of skeletal muscle: from somite to limb. J Anat. 2003;202:59-68
33. Picard B, Lefaucheur L, Berri Cc. et al. Muscle fibre ontogenesis in farm animal species. Reprod Nutr Dev. 2002;42:415-31
34. Buckingham M, Vincent SD. Distinct and dynamic myogenic populations in the vertebrate embryo. Curr Opin Genet Dev. 2009;19:444-53
35. Wigmore P, Stickland N. Muscle development in large and small pig fetuses. J Anat. 1983;137:235
36. Te Pas MF, De Wit AA, Priem J. et al. Transcriptome expression profiles in prenatal pigs in relation to myogenesis. J Muscle Res Cell Motil. 2005;26:157-65
37. Lefaucheur L, Edom F, Ecolan P. et al. Pattern of muscle fiber type formation in the pig. Dev Dynam. 1995;203:27-41
38. Wank V, Fischer MS, Walter B. et al. Muscle growth and fiber type composition in hind limb muscles during postnatal development in pigs. Cells Tissues Organs. 2006;182:171-81
39. Berchtold MW, Brinkmeier H, Müntener M. Calcium ion in skeletal muscle: its crucial role for muscle function, plasticity, and disease. Physiol Rev. 2000;80:1215-65
40. Olson EN, Williams RS. Remodeling muscles with calcineurin. Bioessays. 2000;22:510-9
41. Pandorf CE, Haddad F, Roy RR. et al. Dynamics of myosin heavy chain gene regulation in slow skeletal muscle: role of natural antisense RNA. J Biol Chem. 2006;281:38330-42
42. Zhao X, Mo D, Li A. et al. Comparative analyses by sequencing of transcriptomes during skeletal muscle development between pig breeds differing in muscle growth rate and fatness. PLoS One. 2011;6:e19774
43. Langmead B, Trapnell C, Pop M. et al. Ultrafast and memory-efficient alignment of short DNA sequences to the human genome. Genome biol. 2009;10:R25
44. Trapnell C, Pachter L, Salzberg SL. TopHat: discovering splice junctions with RNA-Seq. Bioinformatics. 2009;25:1105-11
45. Trapnell C, Roberts A, Goff L. et al. Differential gene and transcript expression analysis of RNA-seq experiments with TopHat and Cufflinks. Nat Protoc. 2012;7:562-78
46. Trapnell C, Williams BA, Pertea G. et al. Transcript assembly and quantification by RNA-Seq reveals unannotated transcripts and isoform switching during cell differentiation. Nat Biotechnol. 2010;28:511-5
47. Robinson MD, McCarthy DJ, Smyth GK. edgeR: a Bioconductor package for differential expression analysis of digital gene expression data. Bioinformatics. 2010;26:139-40
48. Da Wei Huang BTS, Lempicki RA. Systematic and integrative analysis of large gene lists using DAVID bioinformatics resources. Nat Protoc. 2008;4:44-57
49. Shannon P, Markiel A, Ozier O. et al. Cytoscape: a software environment for integrated models of biomolecular interaction networks. Genome Res. 2003;13:2498-504
50. Ling MH, Ban Y, Wen H. et al. Conserved expression of natural antisense transcripts in mammals. BMC genomics. 2013;14:243
51. Rosok O, Sioud M. Systematic identification of sense-antisense transcripts in mammalian cells. Nat Biotechnol. 2004;22:104-8
52. Vu TH, Chuyen NV, Li T. et al. Loss of imprinting of IGF2 sense and antisense transcripts in Wilms' tumor. Cancer Res. 2003;63:1900-5
53. Matsui K, Nishizawa M, Ozaki T. et al. Natural antisense transcript stabilizes inducible nitric oxide synthase messenger RNA in rat hepatocytes. Hepatology. 2008;47:686-97
54. Faghihi MA, Modarresi F, Khalil AM. et al. Expression of a noncoding RNA is elevated in Alzheimer's disease and drives rapid feed-forward regulation of beta-secretase. Nat Med. 2008;14:723-30
55. Faghihi MA, Zhang M, Huang J. et al. Evidence for natural antisense transcript-mediated inhibition of microRNA function. Genome Biol. 2010;11:R56
56. Lewis CA, Parker SJ, Fiske BP. et al. Tracing compartmentalized NADPH metabolism in the cytosol and mitochondria of mammalian cells. Mol Cell. 2014;55:253-63
57. Babady NE, Pang YP, Elpeleg O. et al. Cryptic proteolytic activity of dihydrolipoamide dehydrogenase. PNAS. 2007;104:6158-63
58. Lambeth DO, Tews KN, Adkins S. et al. Expression of two succinyl-CoA synthetases with different nucleotide specificities in mammalian tissues. J Biol Chem. 2004;279:36621-4
59. Ostergaard E. Disorders caused by deficiency of succinate-CoA ligase. J Inherit Metab Dis. 2008;31:226-9
60. Guo J, Shan T, Wu T. et al. Comparisons of different muscle metabolic enzymes and muscle fiber types in Jinhua and Landrace pigs. J Anim Sci. 2011;89:185-91
61. Newcom D, Stalder K, Baas T. et al. Breed differences and genetic parameters of myoglobin concentration in porcine longissimus muscle. J Anim Sci. 2004;82:2264-8
Author contact
![]() Corresponding authors: Phone, 0086-2787281306; Fax, 086-027-87280408; Email: zhumengjinhzau.edu.cn; Phone, 086-027-87387480; Fax, 086-027-87280408; Email: shzhaohzau.edu.cn. Address: College of Animal Sciences & Technology Huazhong Agricultural University, No.1, Shizishan Street Hongshan District, Wuhan, Hubei Province, P.R.China, 430070
Corresponding authors: Phone, 0086-2787281306; Fax, 086-027-87280408; Email: zhumengjinhzau.edu.cn; Phone, 086-027-87387480; Fax, 086-027-87280408; Email: shzhaohzau.edu.cn. Address: College of Animal Sciences & Technology Huazhong Agricultural University, No.1, Shizishan Street Hongshan District, Wuhan, Hubei Province, P.R.China, 430070