10
Impact Factor
ISSN: 1449-2288
Int J Biol Sci 2020; 16(12):2205-2219. doi:10.7150/ijbs.42080 This issue Cite
Research Paper
Ligand-receptor interaction atlas within and between tumor cells and T cells in lung adenocarcinoma
1. Department of Thoracic Surgery, Zhongshan Hospital, Fudan University, No. 180, Fenglin Road, Shanghai, 200032, China
2. Shanghai Medical College, Fudan University, Shanghai 200032, China
3. Department of Thoracic Surgery, The Affiliated Suzhou Hospital of Nanjing Medical University, Suzhou 215001, China
#These authors contributed equally: Zhencong Chen, Xiaodong Yang, and Guoshu Bi.
Received 2020-2-26; Accepted 2020-5-2; Published 2020-5-18
Abstract

Purpose: Lung adenocarcinoma (LUAD) is the leading cause of cancer-related deaths worldwide. Although tumor cell-T cell interactions are known to play a fundamental role in promoting tumor progression, these interactions have not been explored in LUAD.
Methods: The 10x genomics single-cell RNA sequencing (scRNA-seq) and gene expression data of LUAD patients were obtained from ArrayExpress, TCGA, and GEO databases. scRNA-seq data were analyzed and infiltrating tumor cells, epithelial cells, and T cells were identified in the tumor microenvironment. Differentially expressed ligand-receptor pairs were identified in tumor cells/normal epithelial cells and tumor T cells/non-tumor T cells based on corresponding scRNA-seq and gene expression data, respectively. These important interactions inside/across cancer cells and T cells in LUAD were systematically analyzed. Furthermore, a valid prognostic machine-learning model based on ligand-receptor interactions was built to predict the prognosis of LUAD patients. Flow cytometry and qRT-PCR were performed to validate the significantly differently expressed ligand-receptor pairs.
Results: Overall, 39,692 cells in scRNA-seq data were included in our study after quality filtering. A total of 65 ligand-receptor pairs (17 upregulated and 48 downregulated), including LAMB1-ITGB1, CD70-CD27, and HLA-B-LILRB2, and 96 ligand-receptor pairs (41 upregulated and 55 downregulated), including CCL5-CCR5, SELPLG-ITGB2, and CXCL13-CXCR5, were identified in LUAD cancer cells and T cells, respectively. To explore the crosstalk between cancer cells and T cells, 114 ligand-receptor pairs, including 11 ligand-receptor pair genes that could significantly affect survival outcomes, were identified in our research. A machine-learning model was established to accurately predict the prognosis of LUAD patients and ITGB4, CXCR5, and MET were found to play an important role in prognosis in our model. Flow cytometry and qRT-PCR analyses indicated the reliability of our study.
Conclusion: Our study revealed functionally significant interactions within and between cancer cells and T cells. We believe these observations will improve our understanding of potential mechanisms of tumor microenvironment contributions to cancer progression and help identify potential targets for immunotherapy in the future.
Keywords: Lung adenocarcinoma, Single-cell RNA-seq, Cell-to-cell interactions, Machine learning, Survival
Introduction
Lung cancer is the leading cause of cancer-related deaths worldwide and is responsible for more than 1,700,000 new cases every year [1, 2]. Lung adenocarcinoma (LUAD), which accounts for more than 50% of all lung cancers, is one of the most important subtypes of lung cancer [1, 3]. As an important ingredient of tumor tissues, the tumor microenvironment (TME) plays a fundamental role in promoting tumor progression, including proliferation, invasion, metastasis, and drug resistance [4, 5]. Several studies have suggested that T cells, which are closely related to immune therapy and patient survival, represent the most prevalent cell type in the TME of LUAD [6, 7]. However, how T cells interact with tumor cells has not been extensively explored.
In recent decades, studies on the expression profile of LUAD have mainly been based on RNA sequencing (RNA-seq) technologies, which detect the gene expression of the sample as a whole. However, in addition to tumor cells, tumor tissues also contain a large number of other cell types, such as macrophage cells, epithelial cells, and T cells, and the gene expression profiles of these cell types vary substantially. Therefore, the percentages of different cell types influence the results of RNA-seq, and it is difficult to investigate interactions among cell subpopulations using RNA-Seq data. Therefore, 10x genomics single-cell sequencing (scRNA-seq), which is focused on the main characteristics of each cell subpopulation and their interaction in the TME, has broad prospects, important applications, and research value [8, 9].
In the present study, scRNA-seq data of LUAD was used to explore significant interactions within cancer cells and T cells in LUAD. Communication between LUAD tumor cells and T cells was also explored. A machine learning model based on ligand-receptor interactions between T cells and LUAD tumor cells was built to predict the survival of patients with LUAD. We believe our results will improve our understanding of communication within and between T cells and LUAD tumor cells of LUAD and its connection with patient survival.
Results
LUAD tumor cell and T cell clusters are present in LUAD
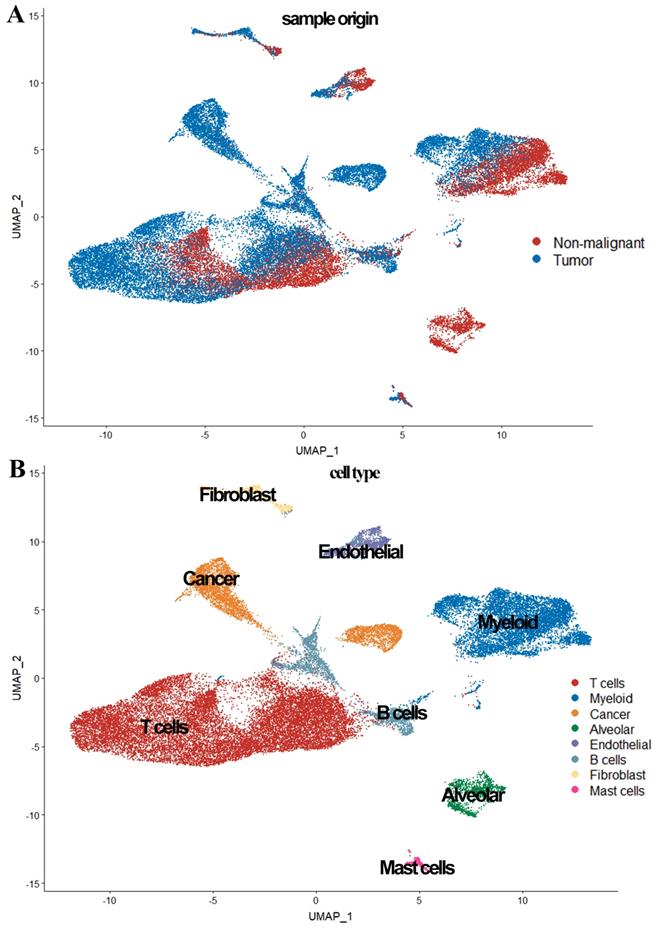
In the scRNA-seq data analysis, 39,692 cells from five patients (seven tumor samples and four normal samples) were included after quality filtering (Supplementary Figure 1, Supplementary Table 1). Of these, 26,277 cells (66.2%) originated from LUAD and 13,375 (33.8%) originated from normal lung tissues (Figure 1). As shown in Figure 1, 39,692 cells were classified into nine clusters by PCA and UMAP clustering methods; subsequently, these identified cell clusters were assigned to known cell types via marker genes.
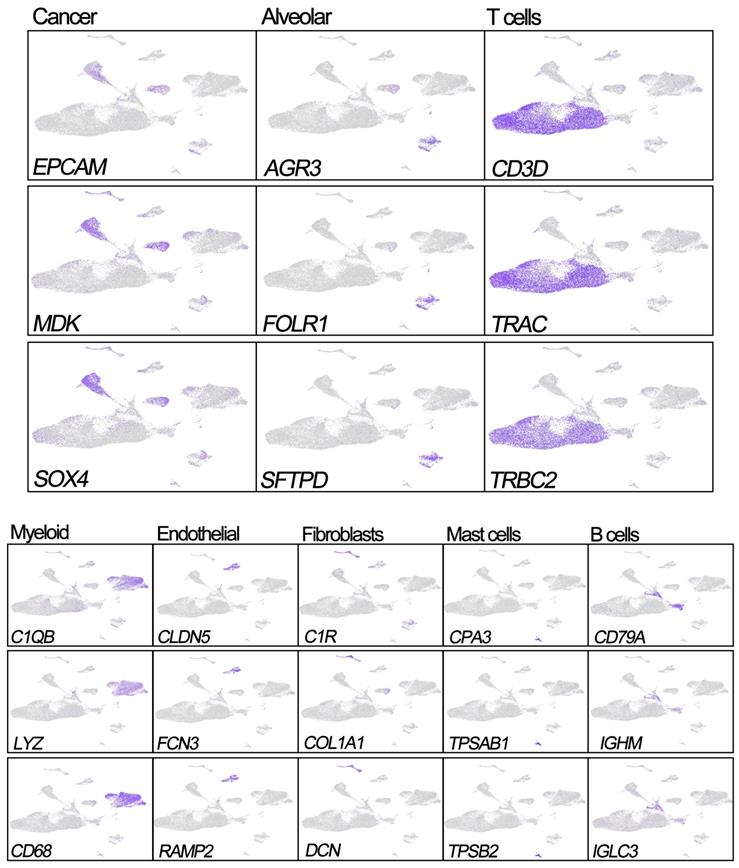
Previous studies have reported that EPCAM, MDK, and SOX4 are tumor cell markers, while FOLR1, SFTPD, and AGR3 are epithelial cell markers [6, 10, 11]. To identify the tumor cells and non-tumor lung cells, we first mapped the expression of six genes (FOLR1, AGR3, and SFTPD for normal hung lung cells, and EPCAM, MDK, and SOX4 for cancer cells) to each cluster to identify the cell types in our study. We noticed the 'Alveolar cluster' is mainly made up of cells from normal tissue, while the 'Cancer cluster' is mainly consisting of cells from tumor samples (Figure 1). We also found CD3D, TRAC, and TRBC2, which are considered to be T cell markers, were highly expressed in the 'T cells cluster' [6, 10, 11]. Therefore, we confirmed that the 'Alveolar cluster' was normal epithelial cells (1,483 cells, 11.1% in normal samples) and the 'Cancer cluster' was LUAD tumor cells (4,637 cells, 17.6% in tumor samples). And we identified 18,824 T cells (6,233 [46.6%] in non-neoplastic and 12,527 cells [47.7.4%] in neoplastic samples) in our study. Detailed information of the marker genes for each cluster is shown in Figure 2.
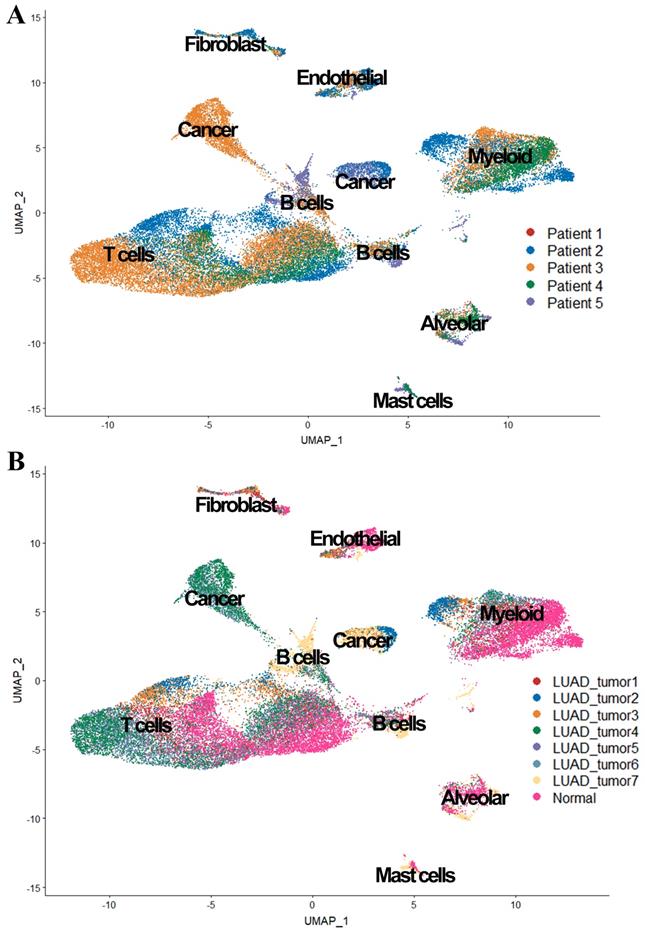
We also observed in Figure 3, tumor cells were mainly grouped by its source, while cells from patient 1 and patient 4 were scattered in different cell types (expect 'Cancer cluster'), suggesting the intertumor heterogeneity in our study.
Expression correlation analysis reveals significant ligand-receptor pairs in LUAD tumor cells
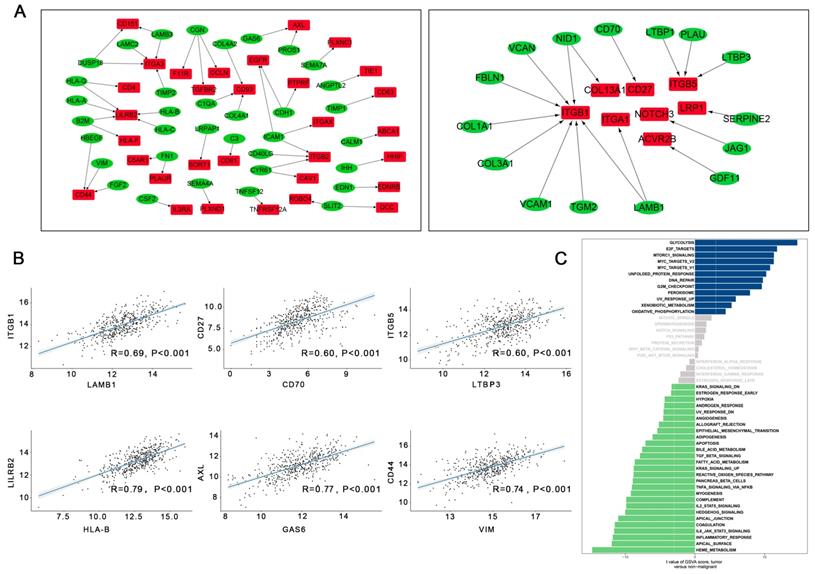
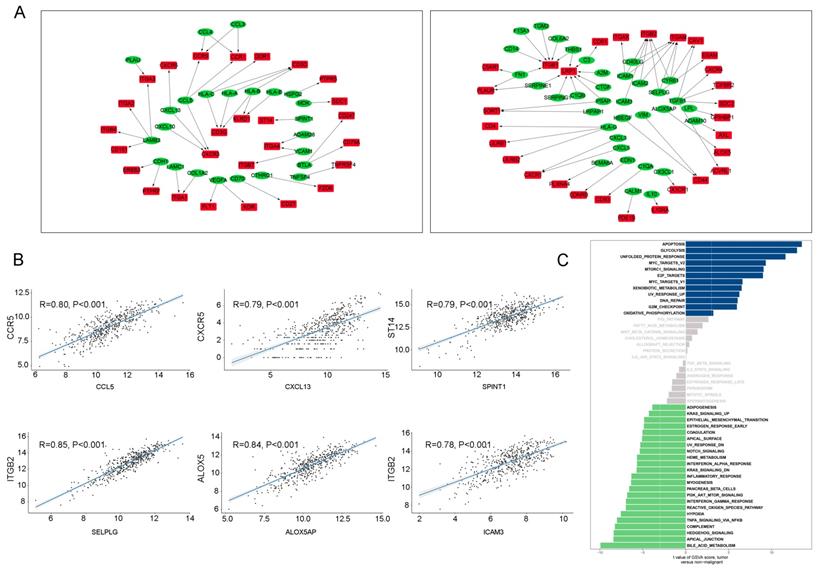
A total of 8849 differentially expressed genes were detected between LUAD tumor cells and epithelial cells (Supplementary Table 2). Overall, 56 upregulated and 167 downregulated pairs in which the receptors and ligands were increased or decreased simultaneously were identified in LUAD tumor cells. TCGA dataset was used to calculate Spearman's correlation coefficients to explore the co-expression of a ligand and its corresponding receptor. As shown in Figure 4A, with strict criteria of coefficient > 0.4 and P < 0.05 in Spearman's correlation rank test, 17 upregulated and 48 downregulated pairs were identified (Supplementary Table 2, Figure 4A).
In our study, the most relevant upregulated pair was LAMB1 and its receptors ITGB1, followed CD70-CD27, and LTBP3-ITGB5 (Figure 4B). Interestingly, upregulation of LAMB1 and its receptors ITGB1 has been reported to promote the development of tumors by destroying endothelial cell function [12]; a previous study suggested that upregulation of LAMB1-ITGB1 plays an important role in the proliferation, adhesion, migration of human[13]. Many studies have also shown that upregulation of CD70-CD27 is related to T and B cell activation [14]. Moreover, the top three downregulated pairs in LUAD tumor cells were HLA-B and its ligand LILRB2, GAS6-AXL, and VIM-CD44 (Figure 4B). Seike et al. reported that AXL and GAS6 co-expression in LUAD was strongly related to survival and could serve as a prognostic classifier [15].
A direct comparison of LUAD tumor cells and normal epithelial cells was performed and is shown in Figure 4C. Glycolysis, e2f targets, mtorc1 signaling, Myc targets v2, and Myc targets v1 were the top five enriched pathways in LUAD tumor cells. Other enriched pathways such as e2f were also associated with each step of tumorigenesis. Overexpression of e2f in the lung can lead to an accelerated cell cycle and increased cell proliferation, suggesting that downregulation of e2f might be a potential therapeutic target in LUAD [16].
Overview of the 36,095 single cells from six tumor samples and four normal samples. (A) The sample origin of the cells; (B) The cell types identified by marker genes
Expression of marker genes for the cell types.
Intracellular network of tumor T cells
Previous studies had reported that tumor tissue contains a large number of immune cells and T cells represented a large proportion in tumor tissue [17].To better show the proportion of T cells in the TCGA database, CIBERSORT also had performed in our study and our results revealed that T cells took a large proportion of all cells in LUAD (Supplementary Figure 2) [18]. Therefore, the TCGA database was used to analyze the ligand-receptor interactions among T cells in our study.
To investigate the intracellular network of tumor T cells, 5255 differentially expressed genes between tumor T cells and non-tumor T cells were selected in our study for downstream analysis (Supplementary Table 2). The numbers of upregulated and downregulated pairs in tumor T cells were 76 and 122, respectively, in our initial selection. After Spearman's correlation rank test, 41 upregulated and 55 downregulated pairs were detected (Figure 5A, Supplementary Table 2). Additionally, upregulated and downregulated pairs ranked in the top three were CCL5-CCR5, CXCL13-CXCR5, and SPINT1-ST14; and SELPLG-ITGB2, ALOX5AP-ALOX5, and ICAM3-ITGB2, respectively (Figure 5B).
CCL5 has been hypothesized to be highly expressed in lung cancer and co-expression of CCL5-CCR5 could promote tumor invasion and metastasis by activating PI3K/Akt signaling [19, 20]. When compared the pathway expression levels in tumor-derived T cells and non-tumor T cells (Figure 5C), we noticed that tumor-associated increases in disorder of the cell cycle (apoptosis, unfolded protein response, DNA repair, and G2M checkpoint), cell proliferation (myc targets, mtorc1 signaling, and e2f targets), and biomass production (glycolysis and xenobiotic metabolism).
UMAP plot of the 36,095 single cells. (A) Cells grouped by the origin of patients; (B) Cells grouped by the origin of samples.
The intracellular ligand-receptor signaling network identified in LUAD tumor cells. (A) Ligand-receptor pairs of intracellular signals inside LUAD neoplastic cells. Green dots stand for ligands and red dots stand for receptors; (B) Spearman's correlation coefficients of ligand-receptor pairs in TCGA LUAD dataset; (C) GSVA analysis of the hallmark pathways in LUAD tumor cells (tumor versus non-malignant).
Additionally, many previous studies had reported CCL5 and CXCL13 were mainly expressed in the tumor cells [19, 21]. In our study, our results also revealed that compared with normal lung epithelial cells, CCL5 and CXCL13 had higher expressions in tumor cells. To our surprise, we also found CCL5 and CXCL13 had the highest expression levels in tumor-associated T cells, which indicates that CCL5 and CXCL13 may play important roles in tumor immunity (Supplementary Figure 3). Further research needs to perform to investigate the expressions of CCL5 and CXCL13 in tumor and T cells.
Crosstalk between LUAD tumor cells and T cells
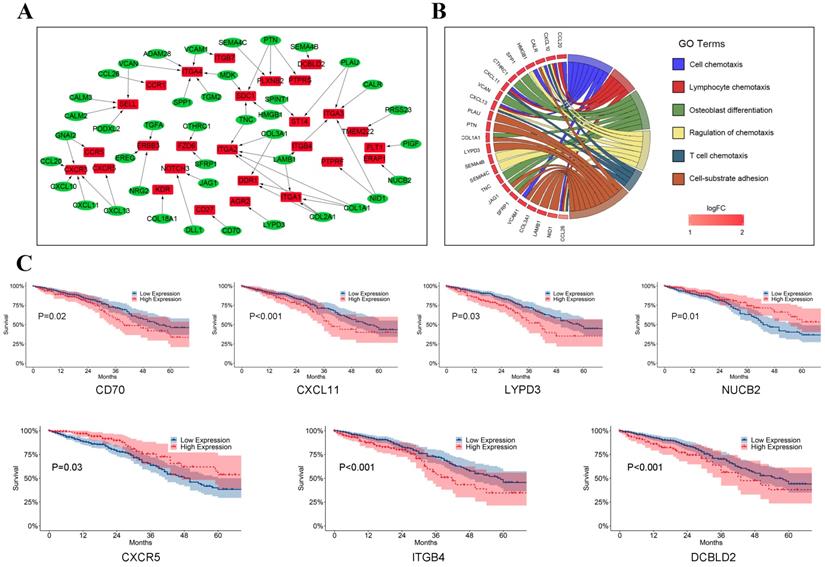
To assess crosstalk between LUAD tumor cells and T cells, 59 ligand-receptor pairs in which ligands and receptors were separately highly expressed in LUAD tumor cells and T cells were selected in our study (Figure 6A, Supplementary Table 2). Interestingly, ligands encoding collagens I and III (e.g., COL1A1-DDR1, COL2A1-ITGA1, and COL3A1-ITGA2), which act as ligands, were found highly expressed in LUAD tumor cells. Wyckoff et al. reported that cancer cells might migrate along the collagen fiber, suggesting that these ligand-receptor pairs may promote the migration of tumor cells in LUAD [22]. CXCR3 and CXCR5 (e.g., CXCL10-CXCR3, CXCL11-CXCR3, and CXCL13-CXCR5), which belong to the CXC chemokine receptor family, were found highly expressed in tumor T cells. CXCR3 plays an important role in promoting tumor growth and metastasis by interfering with T cell function and an antagonist of CXCR3 may inhibit tumor metastasis [23, 24]. Gene functional enrichment analysis in the present study suggested that genes involved in crosstalk between LUAD tumor cells and T cells were likely mainly related to the chemokine response, which has been linked to metastasis, tumor angiogenesis, and immune escape (Figure 6B) [25].
In survival analyses of ligands highly expressed in LUAD tumor cells, we observed that patients with high expression of CD70 (P = 0.02), CXCL11 (P < 0.001), and LYPD3 (P = 0.03) were related to poorer prognosis while patients with high expression of NUCB2 (P = 0.01) had significantly better prognosis (Figure 6C). As shown in Figure 6C, CXCR5 (P = 0.03), ITGB4 (P < 0.001), and DCBLD2 (P < 0.001), which act as receptors in T cells, were significant prognostic indicators for TCGA LUAD dataset.
The intracellular ligand-receptor signaling network identified in T cells. (A) Ligand-receptor pairs of intracellular signals inside T cells. Green dots stand for ligands and red dots stand for receptors;(B) Spearman's correlation coefficients of ligand-receptor pairs in TCGA LUAD dataset.; (C) GSVA analysis of the hallmark pathways in T cells (tumor versus non-malignant).
Cell-cell communication between T cells and LUAD tumor cells
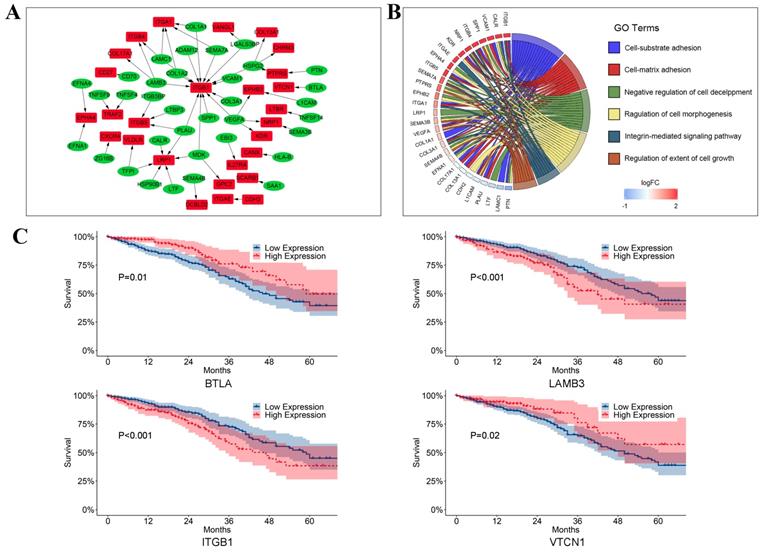
To analyze how T cells communicated with LUAD tumor cells via ligand-receptor pairs, Spearman's analyses were conducted in our study. Then 55 ligand-receptor pairs were selected in our study (Figure 7A, Supplementary Table 2). Interestingly, the tumor necrosis factor superfamily (e.g., TNFSF4-LTBR, TNFSF9-TRAF2, and TNFSF14-TRAF2) was highly expressed in T cells. A previous study reported that TNFSF4 was predominantly expressed on activated CD4+ T cells and could activate CD4+ T cells by secreting signals after binding to its receptor. Furthermore, we identified that members of the integrin receptor family (e.g., LAMB3-ITGB1, LTBP3-ITGB5, and COL1A1-ITGA1) were highly expressed in LUAD tumor cells. Dingemans et al. reported that the integrin family might play a role in lymph node metastasis of LUAD by activating endothelial cells during tumor angiogenesis [26]. Additionally, these ligand-receptor pairs are primarily associated with invasion and proliferation (Figure 7B). In our study, to our surprise, we found that some ligands and receptors were highly expressed in both tumor cells and T cells, such as collagen and integrin family genes, such as COL1A1 and ITGB1 (Supplementary Figure 4). It suggests that in the process of tumor development, many ligand-receptor pairs were simultaneously activated in many cell types, which may regulate by the upstream regulators, further studies need to conduct to explore the cor- ligand-receptor pairs.
To better compared the ligand-receptor pairs in LUAD tumor cells and T cells, we compared the expression of ITGB1, LAMB1, CD70, CD27, CXCR5, CXCL13, ITGB4, and CCL5 in different patients. As shown in Supplementary Figure 5, compared with normal samples, the expression of these eight genes was increased in tumor samples in general. Intriguingly, we also observed that the relative expressions of these genes were different in different samples, even if samples were derived from the same patient. For example, CXCL13 had the highest expression level in Sample 3 and had the lowest expression level in Sample 2. Additionally, to comprehensively analyze these pairs in our study, we also compared the expression of ITGB1, LAMB1, CD70, CD27, CXCR5, CXCL13, ITGB4, and CCL5 in the pairs of tumor and corresponding normal samples (Supplementary Figure 6). Our results revealed that in different samples and different patients, the activated ligand-receptor pairs can be different, suggesting the heterogeneity in the tumor.
To confirm the activation of pairs in the LUAD tumor cells and T cells, the downstream elements (ARRB2 and JAK3 were the downstream elements for the receptors of CXCR3 in T cells, PTK2 and ACTG1 were downstream elements for ITGB4) of these pairs were selected in our study. As shown in Supplementary Figure 7, ARRB2 and JAK3 were highly expressed in T cells, while PTK2 and ACTG1 were mainly enriched in the 'Cancer cluster. These results revealed downstream elements of CXCR3 and ITGB4 are activated, which proved the reliability of our study.
We also observed that CD70, ITGB4, and DCBLD2 were significant prognostic indicators in crosstalk and cell-cell communication between LUAD tumor cells and T cells (Figure 7C). As shown in Figure 7C, we also found that BTLA (P = 0.01), LAMB3 (P < 0.001), ITGB1 (P < 0.001), and VTCN1 (P = 0.02) were significantly related to survival.
Prognostic model based on machine learning
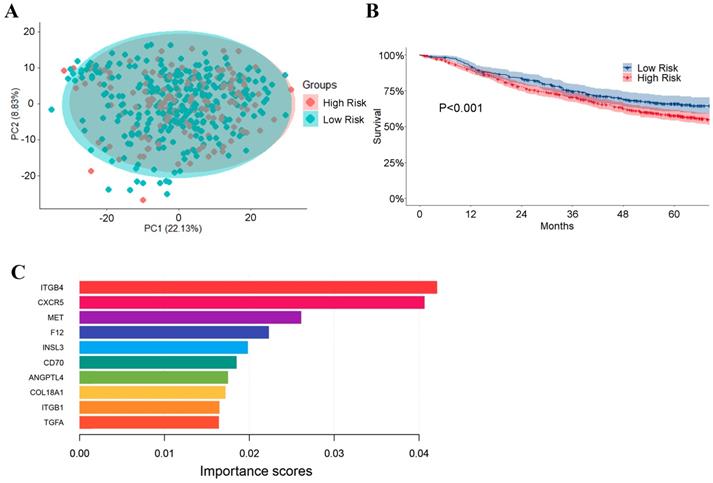
As shown in Figure 8, low risk (stage IA, 127 cases) and high risk (stage IB-IV, 333 cases) groups of TCGA LUAD dataset mixed in PCA (Figure 8A), suggesting that there is little difference in the expression of ligand-receptor pairs between these two groups. A machine-learning model was built based on these ligand-receptor genes. The precision value, recall value, and F1-score of the prognostic model were 0.76, 0.73, and 0.74, respectively.
Subsequently, the GEO dataset (GSE30219, GSE31210, GES3141, GSE37745, GSE50081, and GSE68465), which included 1,063 patients, was used to validate our prognostic model. As shown in Figure 8B, patients in the GEO dataset were divided into high-risk and low-risk groups. Overall survival was significantly different between the high-risk and low-risk groups (P < 0.01). Strikingly, we also revealed ITGB4, CXCR5, and MET as the top three important genes in the prognostic model (Figure 8C).
The crosstalk from LUAD tumor cells to T cells. (A) Ligand-receptor pairs of the signaling network from LUAD tumor cells to T cells. Green dots stand for ligands highly expressed in LUAD tumor cells and red dots stand for receptors highly expressed in T cells; (B) Significantly gene functional enrichment analysis for ligand-receptor pairs in the crosstalk from LUAD tumor cells to T cells; (C)Kaplan-Meier survival analysis for ligand-receptor pairs in TCGA LUAD dataset.
The crosstalk from T cells to LUAD tumor cells. (A) Ligand-receptor pairs of the signaling network from T cells to LUAD tumor cells. Green dots stand for ligands highly expressed in T cells and red dots stand for receptors highly expressed in LUAD tumor cells; (B) Significantly gene functional enrichment analysis for ligand-receptor pairs in the crosstalk from T cells to LUAD tumor cells; (C) Kaplan-Meier survival analysis for ligand-receptor pairs in TCGA LUAD dataset.
Prognostic predictor for LUAD patients based on XGBoost. (A) PCA of low risk (stage IA) and high risk (stage IB-IV) LUAD groups based on the genes of ligand-receptor pairs; (B) The performance of the prognostic predictor Kaplan-Meier survival analysis for the patients in GEO dataset (n = 1,063 and P-value<0.001); (C) Importance rank of the top 10 genes in the prognostic classifier. Importance scores stand for the importance of genes in the predicting model.
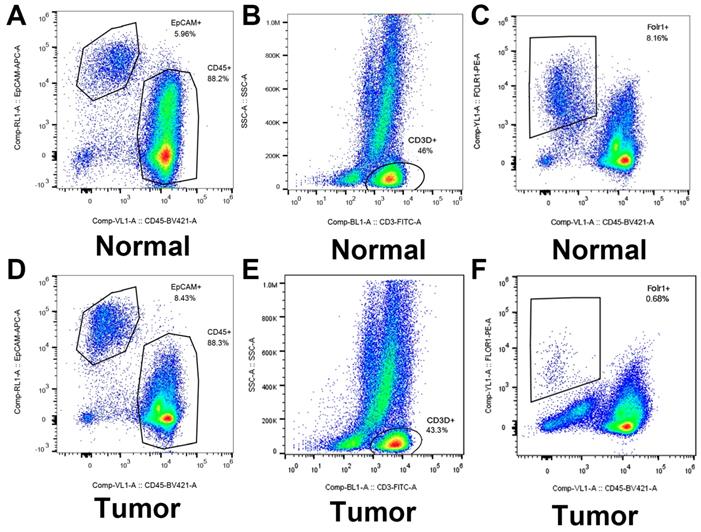
Identified and sorted the key genes expression in epithelial cells (LUAD tumor cells and Alveolar cells) and T cells (Tumor T cells and Non-tumor T cells) by flow cytometry.
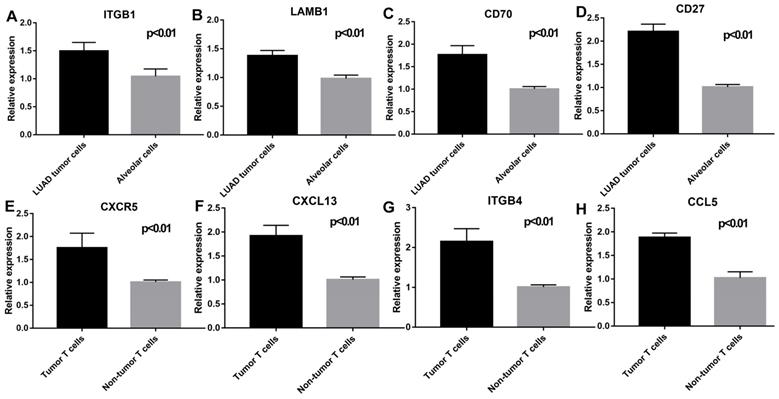
Validation of the key genes expression in epithelial cells (LUAD tumor cells and Alveolar cells) and T cells (Tumor T cells and Non-tumor T cells). ITGB1 (P < 0.01), LAMB1 (P < 0.01), CD70(P < 0.01), and CD27 (P < 0.01) were highly expressed in LUAD tumor cells; CXCR5 (P < 0.01), CXCL13 (P < 0.01), ITGB4 (P < 0.01), and CCL5 (P < 0.01) were highly expressed in tumor T cells.
Flow cytometry and qRT-PCR
As shown in Figure 9, flow cytometry was performed to validate epithelial cells marked with EPCAM and FOLR1, T cells marked with CD3D in LUAD and non-malignant lung samples. qRT-PCR was performed to detect differences in gene expression levels between cancer and alveolar cells in malignant and normal lung tissues, as well as the difference between T cells in the tumor and normal samples. Besides, as shown in Supplementary Figure 8, we noticed that compared with tumor lung tissues, EPCAM+/FOLR1+ cells had a much larger proportion in normal samples (48.3% vs.3.91%, 65.4% vs.13.3%, and 68.3% vs.1.08%, in CD45- cells respectively), while there are less EPCAM+/FOLR1- cells in normal samples (5.14% vs.72.6 %, 0.70% vs. 58.4%, and 0.83% vs. 55.1%, in CD45- cells respectively). It indicates that in non-malignant samples, both EPCAM and FOLR1 were markers of epithelial cells; while in tumor samples, tumor and normal epithelial cells had different epithelial markers (EPCAM for tumor epithelial cells and FOLR1 for normal epithelial cells), which may due to the heterogeneity of tumor cells. In summary, our FASC results proved the reliability of the tumor and normal lung markers in our study. As shown in Figure 10, we observed that the expression levels of ITGB1 (P < 0.01), LAMB1 (P < 0.01), CD70 (P < 0.01), and CD27 (P < 0.01) were significantly increased in LUAD tumor cells and the expression levels of CXCR5 (P < 0.01), CXCL13 (P < 0.01), ITGB4 (P < 0.01), and CCL5 (P < 0.01) were also increased prominently in tumor T cells. These findings were consistent with the scRNA-seq results, indicating that scRNA-seq data analysis can effectively explore the transcriptome of individual cells and the differentially expressed ligand-receptor pairs identified in scRNA-seq analysis exhibited significant changes in tumor samples.
Discussion
Tumors are mixtures of different compartments and heterogeneity is well known as one of the most prominent characteristics of tumors [27]. Previous studies have shown that a heterogeneous TME is likely to be closely associated with therapeutic outcome [3, 17, 28]. Additionally, RNA-seq represents an average of gene expression in the sample, which may ignore significant and biologically differences between cells [29]. Therefore, in RNA-seq technologies, the contribution of the TME is difficult to separate and the function of the TME can be confounded by the existence of non-neoplastic cells. However, compared with RNA-seq technologies, scRNA-seq allows investigation of the transcriptome of individual cells and enables exploration of the heterogeneous TME [30, 31].
In the present study, 36,095 cells from 10 samples of LUAD including six malignant samples and four normal samples were calculated in cluster analysis by PCA and UMAP clustering methods at first, and then the LUAD tumor cell and T cell clusters were identified by gene markers. To implement a more accurate classification, EPCAM, MDK, and SOX4; FOLR1, SFTPD, and AGR3; and CD3D, TRAC, and TRBC2 were used as specific markers for tumor cells, epithelial cells, and T cells, respectively, which have been verified and reported in many studies [32-37]. We also found tumor samples contained 18.2% tumor cells and 53.4% T cells, while normal samples contained 10.4% epithelial cells and 44.1% T cells, indicating that T cells are the dominant cell type in tumor and normal samples. Besides, the gene expression of T cells has a significant effect on gene expression, consistent with previous studies [17, 28].
Many studies have reported that the number of tumor-infiltrating T cells that express checkpoint molecules such as PD-1, CTLA-4, and Lag-3 is a reliable prognostic marker in lung cancer and immune checkpoint therapy has served as an effective treatment strategy for LUAD [38, 39]. The efficacy of immune checkpoint therapy may depend on the recruitment of tumor-infiltrating T cells, which is regulated by cell-cell interactions [40]. For example, ligand-receptor chemokine pairs can activate intracellular signaling pathways and interfere with the recruitment of tumor-infiltrating T cells [41]. Therefore, the present study may improve our understanding of cell communication and promote the identification of potential therapeutic targets in immunotherapy.
HLA-B and its ligand LILRB2 were found to be downregulated in LUAD tumor cells. LILRB2 is a negative regulator of myeloid cell activation and the expression of LILRB2 has been linked to cytoskeleton remodeling, metabolism, and endosomal sorting pathways, as well as changed differentiation gene networks associated with inflammatory myeloid cells [42, 43]. Recent studies have revealed that LILRB2 blockade polarized tumor-infiltrating myeloid cells from non-small cell lung carcinoma (NSCLC) tumor tissues toward an inflammatory phenotype, and can potentially act as a myeloid immune checkpoint by reprogramming tumor-associated myeloid cells and provoking antitumor immunity [44]. In the present study, the HLA-B-LILRB2 pair was the most downregulated. Meanwhile, 41 key upregulated and 55 key downregulated pairs were detected for T cell communication. The SELPLG-ITGB2 pair was found to be significantly increased. In a previous study, ITGB2 promoted the migration and invasion of breast cancer and activated integrin-related FAK signaling; however, there is a lack of research clarifying the function and mechanism of SELPLG-ITGB2 [45]. Overall, to explore the crosstalk between cancer cells and T cells, 119 ligand-receptor pairs, some of which could significantly affect survival outcomes, were confirmed in our research.
Finally, we built a prognostic model based on machine learning of these ligand-receptor genes and a GEO dataset including 1,063 patients was used to validate the model. In our prognostic model, overall survival was significantly different between high-risk and low-risk groups, and the genes ITGB4, CXCR5, and MET played an important role in prognosis. In NSCLC, MET pathway activation is thought to occur through a diverse set of mechanisms that influence properties affecting cancer cell survival, growth, and invasiveness. Preclinical and clinical evidence suggests a role for MET activation as both a primary oncogenic driver in subsets of lung cancer and as a secondary driver of acquired resistance to targeted therapy in other genomic subsets. Aberrant MET signaling can occur through many mechanisms, including MET or HGF protein overexpression, MET gene amplification, and MET gene mutation in downstream signaling or regulatory components [46, 47]. More recent investigations focusing on MET exon 14 alterations and MET amplification have been notable for meaningful clinical responses to MET inhibitor therapy in a substantial proportion of patients [48, 49].
Conclusion
Using scRNA-seq data, we provide and validate a landscape of intracellular communication and crosstalk in cancer cells and T cells of LUAD, respectively. We believe these observations will improve our understanding of the contribution of the TME to cancer progression and potential targets for immunotherapy in the future.
Materials and Methods
Ethics statement
This study was approved by the Ethics Committee of Zhongshan Hospital, Fudan University, China (B2018-137R). Informed consent was obtained when the patients were hospitalized.
Datasets
Bulk tumor tissue RNAseq and scRNA-seq data of LUAD were downloaded from TCGA (https://tcgadata.nci.nih.gov/) and ArrayExpress (https://www.ebi.ac.uk/arrayexpress/) with accession number E-MTAB-6149 and E-MTAB-6653, respectively. Gene Expression Omnibus (GEO; https://www.ncbi.nlm.nih.gov/geo/) data (GSE30219, GSE31210, GES3141, GSE37745, GSE50081, and GSE68465) were downloaded as validation cohorts for the machine-learning model. Ligand-receptor pair information was obtained from the FANTOM5 project [50]. Ten normal and ten LUAD samples were selected for quantitative real-time polymerase chain reaction (qRT-PCR) analyses. Part of the flow cytometry figures are shown in Supplementary Figure 8.
Statistical analysis
The scRNA-seq data analysis
The scRNA-seq data analyses performed in R version 3.5.1 were as follows: (1) scRNA-seq data was converted as a Seurat object using the Seurat R package [51]; (2) after quality control of data, the “FindVariableFeatures” function was used to find the top 1,500 highly variable genes; (3) based on these 1,500 genes, principal component analysis (PCA) and uniform manifold approximation and projection (UMAP) were performed to analyze the 10 scRNA-seq data; and (4) SingleR package [52], CellMarker dataset [53], and previous studies were used to recognize the different cell types obtained with scRNA-seq. And cells were removed if they met one of the following criteria: 1) the number of expressed genes lower than 101 or larger than 6000; 2) 10% or more of UMIs were mapped to mitochondrial or ribosomal genes.
Cell-cell communication analysis
After identifying the cell types in scRNA-seq, R package MAST [54] was applied to compare their expression between neoplastic and non-neoplastic cells. The statistical threshold for significance was at P < 0.05. To analyze intracellular communication, we first selected ligand-receptor genes that were both upregulated and downregulated in LUAD tumor cells and T cells. To further investigate the correlations in ligand-receptor pair genes, Spearman's correlation coefficients were calculated to verify the co-expression of ligand and its corresponding receptor genes. Co-expression of genes was considered with a threshold of coefficient > 0.4 and adjust P-values < 0.05 in Spearman's analyses. And “p.adjust” function in R was applied to calculate the adjust P-values.
We divided the data into two groups to investigate the crosstalk between T cells and LUAD tumor cells: (1) ligands and receptors that were separately highly expressed in T cells and LUAD tumor cells were selected; and (2) ligands highly expressed in LUAD tumor cells and receptors highly expressed in T cells were selected. Gene functional enrichment analysis was then applied to discover the function of related genes.
Machine learning model
Extreme Gradient Boosting (XGBoost) is a decision-tree-based ensemble Machine Learning algorithm, which was conducted based on the Gradient Boosting framework. Compared with other machine-learning models, XGBoost improves upon the base Gradient Boosting framework through systems optimization and algorithmic enhancements. Furthermore, to solve prediction problems effectively, XGBoost provides a parallel tree boosting to achieve state-of-the-art results [55]. To build a predictive model, the TCGA LUAD dataset was split into low risk (stage IA, 127 cases) and high risk (stage IB-IV, 333 cases) groups, then these patients were served as prediction labels to train our prediction model. PCA was performed to determine whether there were interior differences in the expression of the ligand-receptor pairs in these two types. We used the “sample” function in R software to randomly divide the TCGA dataset into training and test sets with a 3:1 ratio; the python package 'sklearn' was performed to construct a machine learning model and XGBoost was applied to train the model to explore the important genes in cell to cell communication and predict clinical outcomes. Patients (without AJCC stages information) from the GEO dataset were used as a validation cohort to test our model.
Survival statistical analysis
Kaplan-Meier and log-rank tests were used to construct and compare survival curves. To confirm whether the selected genes were associated with poor survival, we split the patients into a high expression group (> median expression level across all samples) and a low expression group (≤ median expression level across all samples). A significant difference in survival analysis was defined as P < 0.05. Survival statistical analyses were performed in R.
Validation
Single cells were suspended in phosphate-buffered saline with 3% fetal bovine serum and incubated with 20 μg/mL human IgG (Sigma-Aldrich, St. Louis, MO, USA) for 15 min to block nonspecific antibody binding. Subsequently, cells were incubated with allophycocyanin-conjugated mouse anti-human EPCAM (5 µL/106 cells; cat. no.: 566658, BD Biosciences, San Jose, CA, USA), BV421-conjugated mouse anti-human CD45 (5 µL/106 cells; cat. no.: 304022, BioLegend, San Diego, CA, USA), FITC-conjugated mouse anti-human CD3D (5 µL/106 cells; cat. no.: MHCD0301, ThermoFisher Scientific, Waltham, MA, USA), PE-conjugated mouse anti-human FOLR1 (10 µL/106 cells; cat. no.: FAB5646P, R&D Systems, Minneapolis, MN, USA) for 30 min on ice. Then, the Fortessa analyzer (BD Biosciences) and FACSAria II (BD Biosciences) were used to quantitate and isolate stained cells, respectively. FlowJo software (TreeStar, Woodburn, OR, USA) was used to generate the flow described above. Fortessa analyzer (BD Biosciences) and FACSAria II (BD Biosciences) were used to quantitate and isolate stained cells, respectively. FlowJo software (TreeStar, Woodburn, OR, USA) was used to generate the flow described above. In qRT-PCR analyses, sorted cells were subjected to RNA extraction and reverse transcription using a kit (Takara, Kusatsu, Japan) before the experiment. In RT-qPCR analyses, sorted cells were subjected to RNA extraction by TRIzol (Beyotime, China). PrimeScript RT reagent Kit with gDNA Eraser (Real Time Perfect) (Takara, Kusatsu, Japan) was used to synthesized the first-strand cDNA. Then with the proper PCR parameters (1 cycle of 30 s at 95°C, 40 cycles of 5 s at 95°C and 34s at 60°C), SYBR Premix Ex TaqTM II (Tli RNaseH Plus) (TaKaRa) was applied in our study. β-actin was used as the reference. Primers used in this study are listed in Supplementary Table 1.
Supplementary Material
Supplementary figures and Supplementary table 1.
Supplementary table 2.
Acknowledgements
This work was supported by the Research Development Fund of Zhongshan Hospital, Fudan University (2019ZSFZ002 and 2019ZSFZ19) and Zhengyi Scholar Foundation of School of Basic Medical Sciences, Fudan University (Grant No S22-11). We would like to thank the International Science Editing Co. for the language editing service.
Author Contributions
Cheng Zhan, Wei Jiang, and Zhencong Chen conceived the study.
Zhencong Chen, Xiaodong Yang, and Guoshu Bi performed most of the bioinformatics analysis and wrote the manuscript.
Jiaqi Liang, Zhengyang Hu, Yong Yang, and Ming Li collected the tumor samples and analyzed the data.
Tao Lu, Yuansheng Zheng, Qihai Sui, Mengnan Zhao, and Qun Wang performed the validation of this study.
Lijie Tan supervised this study.
Competing Interests
The authors have declared that no competing interest exists.
References
1. Bray F, Ferlay J, Soerjomataram I, Siegel RL, Torre LA, Jemal A. Global cancer statistics 2018: GLOBOCAN estimates of incidence and mortality worldwide for 36 cancers in 185 countries. CA Cancer J Clin. 2018;68:394-424
2. Siegel RL, Miller KD, Jemal A. Cancer statistics, 2019. 2019; 69: 7-34.
3. Lavin Y, Kobayashi S, Leader A, Amir ED, Elefant N, Bigenwald C. et al. Innate Immune Landscape in Early Lung Adenocarcinoma by Paired Single-Cell Analyses. Cell. 2017;169:750-65.e17
4. Katsumata S, Aokage K, Miyoshi T, Tane K, Nakamura H, Sugano M. et al. Differences of tumor microenvironment between stage I lepidic-positive and lepidic-negative lung adenocarcinomas. The Journal of thoracic and cardiovascular surgery. 2018;156:1679-88.e2
5. Guo JY, Hsu HS, Tyan SW, Li FY, Shew JY, Lee WH. et al. Serglycin in tumor microenvironment promotes non-small cell lung cancer aggressiveness in a CD44-dependent manner. Oncogene. 2017;36:2457-71
6. Lambrechts D, Wauters E, Boeckx B, Aibar S, Nittner D, Burton O. et al. Phenotype molding of stromal cells in the lung tumor microenvironment. Nature medicine. 2018;24:1277-89
7. Thommen DS, Koelzer VH, Herzig P, Roller A, Trefny M, Dimeloe S. et al. A transcriptionally and functionally distinct PD-1(+) CD8(+) T cell pool with predictive potential in non-small-cell lung cancer treated with PD-1 blockade. Nature medicine. 2018;24:994-1004
8. Azizi E, Carr AJ, Plitas G, Cornish AE, Konopacki C, Prabhakaran S. et al. Single-Cell Map of Diverse Immune Phenotypes in the Breast Tumor Microenvironment. Cell. 2018;174:1293-308.e36
9. Furuyama K, Chera S, van Gurp L, Oropeza D, Ghila L, Damond N. et al. Diabetes relief in mice by glucose-sensing insulin-secreting human alpha-cells. Nature. 2019;567:43-8
10. Zhang X, Lan Y, Xu J, Quan F, Zhao E, Deng C. et al. CellMarker: a manually curated resource of cell markers in human and mouse. Nucleic Acids Research. 2018;47:D721-D8
11. Aran D, Looney AP, Liu L, Wu E, Fong V, Hsu A. et al. Reference-based analysis of lung single-cell sequencing reveals a transitional profibrotic macrophage. Nature Immunology. 2019;20:163-72
12. Wagner JUG, Chavakis E, Rogg EM, Muhly-Reinholz M, Glaser SF, Gunther S. et al. Switch in Laminin beta2 to Laminin beta1 Isoforms During Aging Controls Endothelial Cell Functions-Brief Report. Arteriosclerosis, thrombosis, and vascular biology. 2018;38:1170-7
13. He L, Pan S, Li Y, Zhang L, Zhang W, Yi H. et al. Increased proliferation and adhesion properties of human dental pulp stem cells in PLGA scaffolds via simulated microgravity. 2016; 49: 161-73.
14. Tesselaar K, Arens R, van Schijndel GM, Baars PA, van der Valk MA, Borst J. et al. Lethal T cell immunodeficiency induced by chronic costimulation via CD27-CD70 interactions. Nat Immunol. 2003;4:49-54
15. Seike M, Kim CH, Zou F, Noro R, Chiba M, Ishikawa A. et al. AXL and GAS6 co-expression in lung adenocarcinoma as a prognostic classifier. Oncology reports. 2017;37:3261-9
16. Banerjee D, Gorlick R, Liefshitz A, Danenberg K, Danenberg PC, Danenberg PV. et al. Levels of E2F-1 expression are higher in lung metastasis of colon cancer as compared with hepatic metastasis and correlate with levels of thymidylate synthase. Cancer research. 2000;60:2365-7
17. Guo X, Zhang Y, Zheng L, Zheng C, Song J, Zhang Q. et al. Global characterization of T cells in non-small-cell lung cancer by single-cell sequencing. Nature medicine. 2018;24:978-85
18. Newman AM, Liu CL, Green MR, Gentles AJ, Feng W, Xu Y. et al. Robust enumeration of cell subsets from tissue expression profiles. 2015; 12: 453-7.
19. Tyner JW, Uchida O, Kajiwara N, Kim EY, Patel AC, O'Sullivan MP. et al. CCL5-CCR5 interaction provides antiapoptotic signals for macrophage survival during viral infection. Nature medicine. 2005;11:1180-7
20. Wang X, Yang X, Tsai Y, Yang L, Chuang KH, Keng PC. et al. IL-6 Mediates Macrophage Infiltration after Irradiation via Up-regulation of CCL2/CCL5 in Non-small Cell Lung Cancer. Radiation research. 2017;187:50-9
21. Singh Gupta, Kloecker Singh Jr LJIJoO. Expression and clinical significance of CXCR5/CXCL13 in human nonsmall cell lung carcinoma. 2014; 45: 2232-40.
22. Wyckoff JB, Wang Y, Lin EY, Li JF, Goswami S, Stanley ER. et al. Direct visualization of macrophage-assisted tumor cell intravasation in mammary tumors. Cancer research. 2007;67:2649-56
23. Walser TC, Rifat S, Ma X, Kundu N, Ward C, Goloubeva O. et al. Antagonism of CXCR3 inhibits lung metastasis in a murine model of metastatic breast cancer. Cancer research. 2006;66:7701-7
24. Ohtani H, Jin Z, Takegawa S, Nakayama T, Yoshie O. Abundant expression of CXCL9 (MIG) by stromal cells that include dendritic cells and accumulation of CXCR3+ T cells in lymphocyte-rich gastric carcinoma. The Journal of pathology. 2009;217:21-31
25. Shields JD, Kourtis IC, Tomei AA, Roberts JM, Swartz MA. Induction of lymphoidlike stroma and immune escape by tumors that express the chemokine CCL21. Science (New York, NY). 2010;328:749-52
26. Dingemans A-MC, van den Boogaart V, Vosse BA, van Suylen R-J, Griffioen AW, Thijssen VL. Integrin expression profiling identifies integrin alpha5 and beta1 as prognostic factors in early stage non-small cell lung cancer. Mol Cancer. 2010;9:152 -
27. Marusyk A, Almendro V, Polyak K. Intra-tumour heterogeneity: a looking glass for cancer? Nature reviews Cancer. 2012;12:323-34
28. Savas P, Virassamy B, Ye C, Salim A, Mintoff CP, Caramia F. et al. Single-cell profiling of breast cancer T cells reveals a tissue-resident memory subset associated with improved prognosis. Nature medicine. 2018;24:986-93
29. Peng J, Sun BF, Chen CY, Zhou JY, Chen YS, Chen H. et al. Single-cell RNA-seq highlights intra-tumoral heterogeneity and malignant progression in pancreatic ductal adenocarcinoma. Cell research. 2019;29:725-38
30. Kolodziejczyk AA, Kim JK, Svensson V, Marioni JC, Teichmann SA. The technology and biology of single-cell RNA sequencing. Molecular cell. 2015;58:610-20
31. Olsen TK, Baryawno N. Introduction to Single-Cell RNA Sequencing. Current protocols in molecular biology. 2018;122(1):e57
32. Sahoo BR, Maharana J, Patra MC, Bhoi GK, Lenka SK, Dubey PK. et al. Structural and dynamic investigation of bovine folate receptor alpha (FOLR1), and role of ultra-high temperature processing on conformational and thermodynamic characteristics of FOLR1-folate complex. Colloids Surf B Biointerfaces. 2014;121:307-18
33. Shivange G, Urbanek K, Przanowski P, Perry JSA, Jones J, Haggart R. et al. A Single-Agent Dual-Specificity Targeting of FOLR1 and DR5 as an Effective Strategy for Ovarian Cancer. Cancer Cell. 2018;34:331-45 e11
34. Tiwari N, Tiwari VK, Waldmeier L, Balwierz PJ, Arnold P, Pachkov M. et al. Sox4 is a master regulator of epithelial-mesenchymal transition by controlling Ezh2 expression and epigenetic reprogramming. Cancer Cell. 2013;23:768-83
35. Hasegawa K, Sato A, Tanimura K, Uemasu K, Hamakawa Y, Fuseya Y. et al. Fraction of MHCII and EpCAM expression characterizes distal lung epithelial cells for alveolar type 2 cell isolation. Respir Res. 2017;18:150
36. Maciocia PM, Wawrzyniecka PA, Philip B, Ricciardelli I, Akarca AU, Onuoha SC. et al. Targeting the T cell receptor beta-chain constant region for immunotherapy of T cell malignancies. Nat Med. 2017;23:1416-23
37. Munoz-Ruiz M, Ribot JC, Grosso AR, Goncalves-Sousa N, Pamplona A, Pennington DJ. et al. TCR signal strength controls thymic differentiation of discrete proinflammatory gammadelta T cell subsets. Nat Immunol. 2016;17:721-7
38. Sharma P, Allison JP. Immune checkpoint targeting in cancer therapy: toward combination strategies with curative potential. Cell. 2015;161:205-14
39. Ribas A, Wolchok JD. Cancer immunotherapy using checkpoint blockade. Science (New York, NY). 2018;359:1350-5
40. Gajewski TF, Corrales L, Williams J, Horton B, Sivan A, Spranger S. Cancer Immunotherapy Targets Based on Understanding the T Cell-Inflamed Versus Non-T Cell-Inflamed Tumor Microenvironment. Advances in experimental medicine and biology. 2017;1036:19-31
41. House IG, Savas P, Lai J, Chen AXY, Oliver AJ, Teo ZL. et al. Macrophage derived CXCL9 and CXCL10 are required for anti-tumor immune responses following immune checkpoint blockade. Clinical cancer research: an official journal of the American Association for Cancer Research. 2020 15;26(2):487-504
42. Chang CC, Ciubotariu R, Manavalan JS, Yuan J, Colovai AI, Piazza F. et al. Tolerization of dendritic cells by T(S) cells: the crucial role of inhibitory receptors ILT3 and ILT4. Nat Immunol. 2002;3:237-43
43. Zheng J, Umikawa M, Cui C, Li J, Chen X, Zhang C. et al. Inhibitory receptors bind ANGPTLs and support blood stem cells and leukaemia development. Nature. 2012;485:656-60
44. Chen HM, van der Touw W, Wang YS, Kang K, Mai S, Zhang J. et al. Blocking immunoinhibitory receptor LILRB2 reprograms tumor-associated myeloid cells and promotes antitumor immunity. J Clin Invest. 2018;128:5647-62
45. Liu M, Gou L, Xia J, Wan Q, Jiang Y, Sun S. et al. LncRNA ITGB2-AS1 Could Promote the Migration and Invasion of Breast Cancer Cells through Up-Regulating ITGB2. Int J Mol Sci. 2018 19,1866
46. Drilon A, Cappuzzo F, Ou SI, Camidge DR. Targeting MET in Lung Cancer: Will Expectations Finally Be MET? J Thorac Oncol. 2017;12:15-26
47. Salgia R. MET in Lung Cancer: Biomarker Selection Based on Scientific Rationale. Mol Cancer Ther. 2017;16:555-65
48. Awad MM, Oxnard GR, Jackman DM, Savukoski DO, Hall D, Shivdasani P. et al. MET Exon 14 Mutations in Non-Small-Cell Lung Cancer Are Associated With Advanced Age and Stage-Dependent MET Genomic Amplification and c-Met Overexpression. J Clin Oncol. 2016;34:721-30
49. Frampton GM, Ali SM, Rosenzweig M, Chmielecki J, Lu X, Bauer TM. et al. Activation of MET via diverse exon 14 splicing alterations occurs in multiple tumor types and confers clinical sensitivity to MET inhibitors. Cancer Discov. 2015;5:850-9
50. Ramilowski JA, Goldberg T, Harshbarger J, Kloppmann E, Lizio M, Satagopam VP. et al. A draft network of ligand-receptor-mediated multicellular signalling in human. Nature communications. 2015;6:7866
51. Macosko EZ, Basu A, Satija R, Nemesh J, Shekhar K, Goldman M. et al. Highly Parallel Genome-wide Expression Profiling of Individual Cells Using Nanoliter Droplets. Cell. 2015;161:1202-14
52. Aran D, Looney AP, Liu L, Wu E, Fong V, Hsu A. et al. Reference-based analysis of lung single-cell sequencing reveals a transitional profibrotic macrophage. Nat Immunol. 2019;20:163-72
53. Zhang X, Lan Y, Xu J, Quan F, Zhao E, Deng C. et al. CellMarker: a manually curated resource of cell markers in human and mouse. Nucleic Acids Res. 2019;47:D721-d8
54. Finak G, McDavid A, Yajima M, Deng J, Gersuk V, Shalek AK. et al. MAST: a flexible statistical framework for assessing transcriptional changes and characterizing heterogeneity in single-cell RNA sequencing data. Genome biology. 2015;16:278
55. Chen Tianqi, and Carlos Guestrin. “XGBoost: A Scalable Tree Boosting System.” Proceedings of the 22nd ACM SIGKDD International Conference on Knowledge Discovery and Data Mining, 2016, pp. 785-794
Author contact
![]() Corresponding authors: Cheng Zhan & Wei Jiang, Department of Thoracic Surgery, Zhongshan Hospital, Fudan University, No. 180, Fenglin Road, Shanghai, 200032, China; Phone: 86-21-64041990; Fax: 86-21-64041990; Email:czhan10edu.cn; jiang.wei1sh.cn
Corresponding authors: Cheng Zhan & Wei Jiang, Department of Thoracic Surgery, Zhongshan Hospital, Fudan University, No. 180, Fenglin Road, Shanghai, 200032, China; Phone: 86-21-64041990; Fax: 86-21-64041990; Email:czhan10edu.cn; jiang.wei1sh.cn

 Global reach, higher impact