Impact Factor ISSN: 1449-2288
- Issue 12; 2026
- Issue 11; 2026
- Issue 10; 2026
- Issue 9; 2026
- Issue 8; 2026
- Volume 22; 2026
- Past Issues
- Advance Articles
- Editorial Board
- Cover Images
- Index & Coverage
- Cover Suggestion
- Special Issues
Introduction
Materials and methods
Results
Discussion
Supplementary Material
Acknowledgements
References

 Global reach, higher impact
Int J Biol Sci 2022; 18(7):3006-3018. doi:10.7150/ijbs.69240 This issue Cite
Research Paper
Stella Regulates the Development of Female Germline Stem Cells by Modulating Chromatin Structure and DNA Methylation
Changliang Hou1, Xinyan Zhao2, Geng G. Tian1 ![]() , Ji Wu1,2,3
, Ji Wu1,2,3 ![]()
1. Bio-X Institutes, Key Laboratory for the Genetics of Developmental and Neuropsychiatric Disorders, Ministry of Education, Shanghai Jiao Tong University, Shanghai 200240, China.
2. Key Laboratory of Fertility Preservation and Maintenance of Ministry of Education, School of Basic Medical Sciences, Ningxia Medical University, Yinchuan 750004, China.
3. Shanghai Key Laboratory of Reproductive Medicine, Shanghai 200025, China
Received 2021-11-19; Accepted 2022-3-1; Published 2022-4-18
Abstract

Female germline stem cells (FGSCs) have the ability to self-renew and differentiate into oocytes. Stella, encoded by a maternal effect gene, plays an important role in oogenesis and early embryonic development. However, its function in FGSCs remains unclear. In this study, we showed that CRISPR/Cas9-mediated knockout of Stella promoted FGSC proliferation and reduced the level of genome-wide DNA methylation of FGSCs. Conversely, Stella overexpression led to the opposite results, and enhanced FGSC differentiation. We also performed an integrative analysis of chromatin immunoprecipitation followed by high-throughput sequencing (ChIP-seq), high-throughput genome-wide chromosome conformation capture (Hi-C), and use of our published epigenetic data. Results indicated that the binding sites of STELLA and active histones H3K4me3 and H3K27ac were enriched near the TAD boundaries. Hi-C analysis showed that Stella overexpression attenuated the interaction within TADs, and interestingly enhanced the TAD boundary strength in STELLA-associated regions. Taking these findings together, our study not only reveals the role of Stella in regulating DNA methylation and chromatin structure, but also provides a better understanding of FGSC development.
Keywords: Stella, female germline stem cells, epigenomics, chromatin structure, DNA methylation
Introduction
In recent years, the incidence of infertility has gradually increased, becoming a global health problem [1]. A drastic decline in the number of oocytes and poor oocyte quality are the main causes of female infertility. As a type of germline stem cell, female germline stem cells (FGSCs) possess the capacity for self-renewal and differentiation into oocytes [2-4]. Moreover, our previous research showed that FGSCs were a type of germ cells between primordial germ cells (PGCs) and germinal vesicle (GV) oocytes [5], which were genetically close to PGCs, but had its unique molecular characteristics. Recent studies have revealed the mechanisms by which FGSC proliferation, differentiation, and apoptosis are regulated [2, 6-8]. Ma et al. revealed that the PI3K-AKT pathway is important for FGSC maintenance [5]. Etv5, Foxo1, and Akt were also shown to positively regulate FGSC self-renewal [9]. In addition, Zou et al. evaluated different differentiation conditions of mouse FGSCs in vitro, and successfully differentiated FGSCs into GV oocytes [8]. In mammals, genome-wide epigenetic reprogramming occurs in the early germline to erase parental epigenetic memories and promote germ cell differentiation [10, 11]. Our previous study found that DNA methylation is involved in the unipotency of FGSCs and maintains their sexual identity [12]. Zhao et al. showed that Usp7 regulates the self-renewal and differentiation of FGSCs through DNA methylation [13]. In addition, long noncoding RNA [14, 15], Circular RNA [16], and m6A modification [17] have been reported to participate in the epigenetic regulation of FGSCs development. These findings lay the foundation for further research on the mechanism of FGSC development.
Stella (also known as Dppa3 or PCG7) is a small protein composed of 150 amino acids, which is predominantly expressed in germ cells, early embryos, and pluripotent cells [18, 19]. Accumulating evidence has indicated that Stella plays a significant role in mouse oocytes and early embryonic development. Liu et al. showed that Stella deficiency dramatically inhibits oocytes from the non-surrounded nucleolus (NSN) stage to the surrounded nucleolus (SN) stage [20]. Embryos derived from Stella-deficient oocytes were also found to be arrested at the four-cell stage and fail to produce offspring [19, 21]. In addition to its role in mouse oocytes and embryos, Stella also affects the differentiation of human embryonic stem cells [22] and tumor cells [23]. Recent studies in our laboratory have shown that, after overexpressing Stella, H19, and Zfp57, and knockdown of Plzf in spermatogonial stem cells (SSCs), SSCs could be converted into induction of germline stem cells, which had similar morphology, DNA methylation pattern, and 3D chromatin structure as FGSCs [9]. This finding suggests Stella is an important maternal-origin gene. However, to the best of our knowledge, no reports have been published about the possible role of Stella in FGSC development.
Several studies have shown that Stella protects DNA methylation status in the maternal pronucleus [24, 25]. Bian and Yu demonstrated that a lack of Stella induces the loss of DNA methylation at imprinting loci [26]. In addition, Singer et al. showed that Stella regulates pluripotency by maintaining the hypomethylated state of DNA in pluripotent stem cells [27]. Additionally, Stella deficiency also impacts on heterochromatin-related factors HP1β. In Stella-null GV oocytes, pericentric heterochromatin HP1β was found to have lower staining intensity, and repressive histone marks H3K9me3 and H3K27me3 were more sparsely distributed [20]. Moreover, chromocenter formation and major satellite RNA were impaired in Stella-deficient embryos [28]. Both HP1β and major satellite RNA are reported to play roles in three-dimensional (3D) chromatin organization [29-31].
Recently, high-throughput genome-wide chromosome conformation capture (Hi-C) technology, which was developed from chromosome conformation capture (3C), has been used to visualize 3D chromatin organization at an unprecedentedly high resolution [32, 33]. Hi-C studies have revealed that eukaryotic genomes are spatially organized into A/B-type compartments, topologically associated domains (TADs), and a chromatin loop [34, 35]. The 3D chromatin structure is believed to regulate gene expression by establishing loops between enhancers and promoters [36]. However, whether Stella plays a role in 3D chromatin organization remains unclear. In this study, we carried out an integrative analysis of chromatin immunoprecipitation followed by high-throughput sequencing (ChIP-seq), high-throughput genome-wide chromosome conformation capture (Hi-C), and the use of DNA methylation and RNA-seq data. Our results demonstrate that Stella regulates both DNA methylation and higher-order chromatin structure, accompanied by changes in gene expression.
Materials and methods
Culture of female germline stem cells
FGSCs were cultured in accordance with our previously published reports [2, 37]. In brief, dissected muse ovarian tissues was digested by trypsin and collagenase Ⅳ respectively, and then further purified by magnetic beads coupled with MVH antibody. The purified FGSCs were cultured on mitomycin C-treated (10 μg/ml, Sigma) mitotically inactivated mouse STO cell feeders in 48-well plates at 37℃ with 5% CO2. They were passaged every 3-4 days at a ratio of 1:4 and the medium was replaced every 2 days.
Generation of Stella-overexpressing FGSC lines
Stella-overexpressing FGSC lines were generated as previously described [9]. Briefly, gene coding sequences were amplified and cloned into the multiple cloning site of lentivirus overexpression vectors. Lentivirus packaging was performed by OBiO Technology Co., Ltd. (Shanghai, China). When the FGSCs had grown to approximately 50% confluence, they were infected with lentivirus at an MOI of 60. At 24 h post-infection, the medium was replaced with fresh medium. Puromycin (1 μg/mL) was added to obtain stable FGSC lines. Empty lentiviral vector was used as a negative control.
Generation of Stella-knockout FGSC lines
To generate CRISPR knockout cells, two different pairs of sgRNAs targeting Stella were designed [38]. The sgRNAs were cloned into the pLenti-U6-spgRNA v2.0 vector. Lentivirus packaging and infection were conducted as described above. Subsequently, lentivirus-infected cells were isolated, serially diluted, and plated into 96-well plates. Single-cell clones were expanded and the genotype of each clone was verified using PCR and Sanger sequencing. The sequences of the sgRNAs used in this study are listed in Table S1.
Off-target analysis
Off-target sites were predicted by an online design tool (http://crispr.mit.edu/). The PCR products containing off-target sites were confirmed by T7E1 enzyme digestion and Sanger sequencing [39]. Primers for off-target sites are listed in Table S2.
Cell viability assay
Cell viability assay was performed using the CCK-8 kit (Beyotime, Shanghai, China). In accordance with the manufacturer's protocol, FGSCs were seeded into 96-well plates at a density of 4 × 10³ cells per well. After incubation for 24 h, 20 µL of CCK-8 reagent was added into each well and incubated for 2 h. Optical density at 450 nm was measured on a microplate reader.
Cell proliferation assay
Cell proliferation rate was analyzed using the EdU Apollo®567 In vitro Imaging Kit (RiboBio, Guangzhou, China). Cells were plated into 48-well plates at a density of 1 × 10⁵ cells per well. One day after seeding, the culture medium was exchanged for fresh medium containing 50 µM EdU solution and incubated for another 2h. Cells were fixed for 30 min in 4% paraformaldehyde (PFA) and permeabilized with 0.5% Triton X-100, and then neutralized with 2 mg/mL glycine for 5 min. After washing three times, cells were reacted with Apollo reaction mixture for 30 min, stained with Hoechst 33342 for 10 min, and visualized under a fluorescent microscope.
Cell cycle analysis
Cell cycle analysis was conducted using the Cell Cycle and Apoptosis Analysis kit (Beyotime, Shanghai, China). Cells were washed twice with precooled phosphate-buffered saline (PBS), digested using trypsin, and fixed in 70% ethanol at 4°C overnight. Subsequently, the fixed cells were washed with precooled PBS and resuspended in PBS containing propidium iodide (PI) and RNase A at 37°C for 30 min. The cell cycle distribution was examined using a CytoFLEX flow cytometer (Beckman Coulter, Brea, CA, USA) and analyzed using FlowJo software.
Reverse-transcription PCR (RT-PCR) and quantitative real-time PCR (qRT-PCR)
Total RNA was extracted with Trizol Reagent (Invitrogen, Carlsbard, CA, USA) and reverse-transcribed to cDNA. qRT-PCR was performed with ABI 7500 Real-Time System and the data were analyzed using 7500 Software. Primers for RT-PCR and qRT-PCR are listed in Table S3.
Immunofluorescence staining
The double staining of MVH and STELLA was conducted as follows. FGSCs were fixed with 4% PFA for 30 min at room temperature. They were then incubated in blocking solution containing 10% normal goat serum for 60 min, and incubated with mouse monoclonal anti-MVH (1:100, Abcam, Cambridge, UK) overnight at 4℃. Cells were washed once with PBS and permeabilized with 0.5% Triton X-100 for 30 min. Next, the cells were incubated with rabbit polyclonal anti-STELLA (1:200, Abcam, Cambridge, UK) overnight at 4℃. After washing with PBS three times, the cells were incubated with the secondary antibody for 60 min, washed, and then incubated with DAPI for 10 min. Images were acquired using a Leica digital camera.
For OCT4 staining, before incubation in blocking buffer, cells were permeabilized with 0.5% Triton X-100 for 30 min and then washed with PBS three times. The remaining steps were the same as for the above double staining. The primary antibody was rabbit polyclonal anti-OCT4 (1:100, Santa Cruz, CA, USA).
Western blot analysis
FGSCs were lysed in RIPA buffer containing protease inhibitor cocktail. Equal amounts of total proteins were denatured and separated on SDS-PAGE and transferred to PVDF membranes. Blocking of the membranes was performed in 5% non-fat powdered milk in Tris-buffered saline with Tween 20 (TBST) for 1 h. After blocking, the membranes were incubated with primary antibodies to STELLA (1:200, Abcam, Cambridge, UK), STRA8 (1:1000, Bioss, Beijing, China) overnight at 4°C. The membranes were washed with TBST three times and incubated with the secondary antibody at room temperature for 1 h. The labeled proteins were visualized using ECL reagents. The grayscale value was measured using ImageJ software.
Dot blotting
Dot blots were conducted as described previously [40]. Briefly, genomic DNA was extracted and subjected to denaturation. Then, equal concentrations of each sample were dotted on nitrocellulose blotting membrane and subjected to UV-crosslinking after air-drying. The membranes were blocked in 5% non-fat powdered milk in PBST for 60 min. Subsequently, the membranes were incubated with mouse anti-5mC (1:1000, Diagenode, Seraing, Belgium), followed by secondary antibody. The ECL kit was used to visualize the blots.
RNA-sequencing (RNA-seq)
Total RNA was extracted from cells using Trizol Reagent (Invitrogen, Carlsbard, CA, USA). RNA quantity and quality were determined with 2100 Bioanalyzer (Agilent Technologies). RNA-Seq libraries was prepared using the KAPA Stranded mRNA-Seq kit (KAPA Biosystems, Wilmington, MA, USA), following the manufacturer's protocol. For bulk RNA-seq, approximately 2μg of total RNA (1×10⁶ cells) was used as starting material for each reaction.
Chromatin immunoprecipitation followed by high-throughput sequencing (ChIP-seq)
ChIP-seq experiments were performed as described previously [41]. Briefly, cells were cross-linked, lysed, and sheared to obtain 200-800 bp fragments. Chromatin was immunoprecipitated with antibodies against STELLA (2 μg, Abcam, Cambridge, UK) or rabbit IgG (2μg, Cell Signaling Technology, MA, USA). Library construction, purification, and next-generation sequencing were conducted as described above.
Methylated DNA immunoprecipitation (MeDIP)
MeDIP experiments were performed using a MagMEDIP kit (Diagenode, Seraing, Belgium). Briefly, genomic DNA (gDNA) was extracted from FGSCs and sonicated to shear chromatin. Fifty nanograms of fragmented genomic DNA was used for the library construction and purified. Methylated DNA was immunoprecipitated with anti-5-methylcytosine antibody overnight at 4℃. After washing and elution, immunoprecipitated DNA was amplified and subjected to Illumina sequencing.
In situ Hi-C
In situ Hi-C was performed as previously reported [9, 32]. Briefly, cells were fixed, lysed, and digested with Dpn II restriction enzyme. Biotin was incorporated into the sticky ends of fragments before ligation. Proximity ligation was carried out with T4 DNA ligase. Then, DNA purification was carried out and the DNA was sheared into fragments. End repair, adenylation, and adapter ligation were performed using NEBNext End Repair Kit (NEB, Ipswich, MA, USA). Biotin-labeled fragments were pulled down using MyOne Streptavidin T1 beads (Life Technologies, Waltham, MA, USA). Hi-C DNA was amplified using the KAPA HiFi Library Amplification Kit (KAPA Biosystems, Wilmington, MA, USA). DNA size selection was performed using AMPure XP beads (Beckman Coulter, Brea, MA, USA). The concentration of the Hi-C libraries was determined using the 2100 Bioanalyzer System.
RNA-Seq data analysis
RNA-seq data were trimmed and aligned to mouse genome (mm9), then Hisat2 [42] was used to mapping the reads with default parameters. DEseq2 was used to calculate the significant different genes under the parameters: adjust of p value < 0.05 and log2 fold change > 1.
ChIP-Seq and MeDIP-seq data analysis
ChIP-Seq and MeDIP-seq analysis was performed as described previously with minor revision [5, 43]. Briefly, raw reads were trimmed to remove adaptor sequences and low-quality reads. Then bowtie2 tools were used to align the reads to mouse genome (mm9) with default parameters [44]. After mapping, PCR duplicates were removed with samtools [45]. MACS2 was used for predicting transcription factor peaks (q-value ≤0.01). Genome coverage files (bedgraph files) for visualization were generated by deepTools2 [46]. Histone modification and RNA polymerase II (PoI II) ChIP-seq data were obtained from our previous publication [12].
Hi‐C data processing and normalization
Hi-C data was analyzed as previously described with minor revision [47] . Briefly, Hi-C clean sequencing reads were processed using the HiC-Pro [48]. The reads were mapped against the mouse genome (mm9), and experimental artifacts, such as circularized reads and re‐ligations, were filtered out, and duplicate reads were removed. Aligned Hi‐C data were normalized using iterative correction (ICE) method [49] and visualized with Juicer tools v0.7.5 [50]. Using binned Hi‐C data, we generated 500 kb, 40 kb, 20 kb resolutions normalized Hi‐C matrices.
Intra‐chromosomal contact frequency analysis
We plotted the frequency of cis‐chromosomal contacts in the normalized data at various genomic distances. By binning all cis‐chromosomal contact distances, frequency density was calculated with log10 distances).
Compartment analysis
The compartment signal was computed as the first principle component (PC1) of R package (HiTC) [51] using 500kb normalized matrices with default parameters. A positive value indicates the A compartment and negative value is B compartment.
TAD calling
TAD was identified by Domain Index (DI) method as previously described [52]. Briefly, DI value was calculated based on the normalized matrix under 40kb bins with Hidden Markov Model (HMM). TAD boundaries were defined as the region <400 kb.
TAD Compartment Switching
TAD was identified by Domain Index method. According to the compartment PC1 score, the mean value of each bin located in TAD was defined as TAD compartment score. In which, a positive value represented TAD in A compartment, while negative value was TAD in B compartment.
Gene ontology (GO) analysis
GO enrichment was analysis using the Gene ontology website and chose an FDR (Benjamini-corrected p value) of less than 0.05.
Statistical analysis
Results are presented as the mean ± SEM. Comparisons between two groups were performed using Student's t test for unpaired data. A p-value of <0.05 was considered significant.
Results
Characterization of female germline stem cells
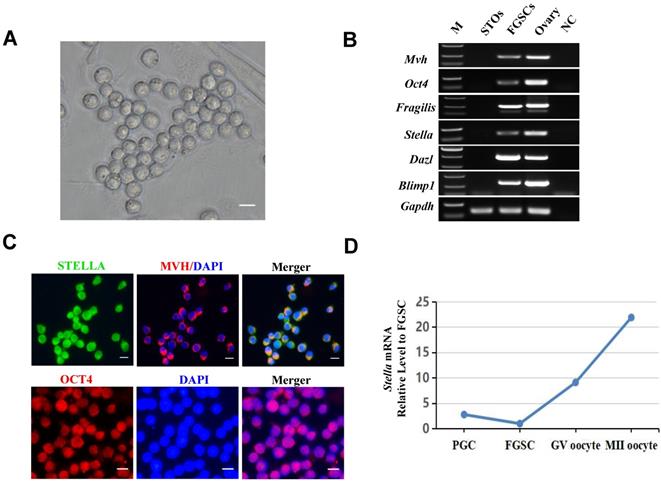
As shown in Figure 1A, the FGSCs used for this study were previously established in our laboratory [7]. RT-PCR and immunofluorescence assays were performed to characterize the FGSCs. The expression of Mvh (also known as Ddx4), Oct4, Fragilis, Stella, Dazl, and Blimp1 was determined by RT-PCR (Figure 1B). Immunofluorescence analysis showed positivity for STELLA, MVH, and OCT4 proteins (Figure 1C). In addition, Stella mRNA expression level gradually increased with female germ cell development (Figure 1D).
Characterization of FGSCs. (A) Brightfield image showing the morphology of FGSCs. (B) RT-PCR determination of Mvh, Oct4, Fragilis, Stella, Dazl, and Blimp1 mRNA expression in FGSCs. Gapdh mRNA served as a control. M, DNA size markers. NC, negative control. (C) Immunofluorescence analysis of FGSCs with antibodies against MVH, STELLA, and OCT4. (D) The relative expression of Stella mRNA during FGSC development (Ma et al., 2019). Scale bar: 10 µm.
Stella regulates proliferation and differentiation of female germline stem cells
To study the role of the Stella gene in FGSC development, CRISPR/Cas9 genome editing was used to knock out Stella in FGSCs (Figure 2A and Figure S1A). Two independent homozygous knockout FGSC lines were confirmed by genomic PCR, RT-PCR, and Sanger sequencing (Figure S1B-D). One knockout clone was randomly selected for the subsequent experiments. Western blotting was conducted to further verify the results (Figure 2B). Off-target analysis was carried out for each sgRNA, and the results indicated that no off-target mutations were found in any off-target sites (Figure S2A-D). Monoclonal FGSCs derived from Stella knockout could be maintained for more than 3 months until cryopreservation frozen in vitro (over passage 30). Stella-overexpressing FGSCs could be cultured in vitro for at least 4 months (over passage 30). Both Stella knockout and Stella-overexpressing FGSCs were passaged for at least 4 generations for further experiments (5-10 generations selected in this study).
Stella affects self-renewal and differentiation of FGSCs. (A) Fluorescence and bright field imaging of FGSCs infected with lentivirus. (B) A representative Western blot images (left) and quantitative analysis of overexpression group (right) is shown. (C, D) Cell cycle distribution profiles of FGSCs after Stella overexpression and knockout. (E) Relative mRNA expression of Stra8 and Sycp3 in FGSCs infected with the Stella-overexpressing lentivirus. (F) Relative protein expression of Stra8 in FGSCs infected with the Stella-overexpressing lentivirus. (G, H) GO analysis of DEGs in Stella-knockout (G) and -overexpressing FGSCs (H) compared with the corresponding controls. KO-con, Stella knockout control. KO, Stella knockout. Over-con, Stella-overexpressing control. Over, Stella overexpression. Single asterisk represents p<0.05; while double asterisk indicates p<0.01. Scale bar: 10 µm.
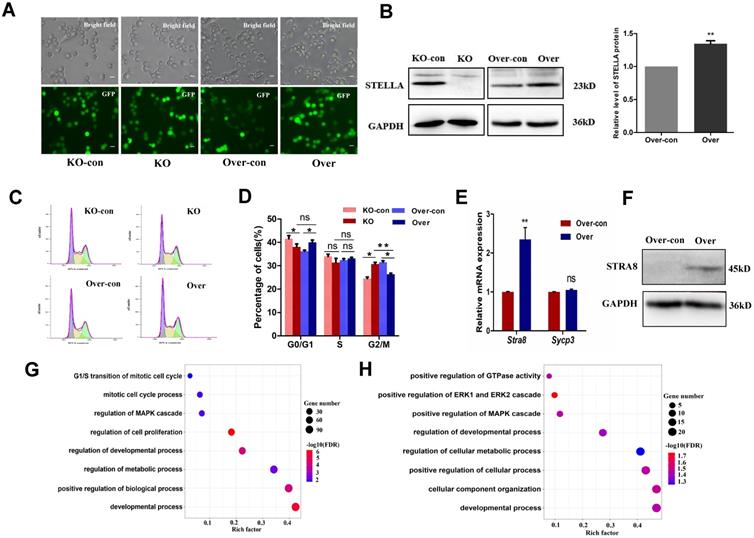
Next, we examined the effect of Stella knockout on cell phenotype. The results showed that such knockout promoted FGSC proliferation, while Stella overexpression inhibited FGSC proliferation, based on CCK-8 and EdU assays (Figure S3A-C). This was consistent with the expression of proliferation-related genes Etv5, Bcl6b, Oct4, and Akt in Stella-knockout and -overexpressing FGSCs (Figure S3D). Since cell proliferation is closely associated with cell cycle progression [53], we investigated the potential effects of Stella on the cell cycle. Cell cycle analysis showed that Stella knockout increased the proportion of cells in G2/M phase and decreased that in G0/G1 phase (Figure 2C-D). Meanwhile, Stella overexpression showed the opposite results (Figure 2C-D). Moreover, Stra8 mRNA expression was upregulated after Stella overexpression rather than Stella knockout (Figure 2E), which is consistent with WB results (Figure 2F).
To gain further insight into the mechanism by which Stella regulates FGSC development, we obtained transcriptional profiles by RNA sequencing (RNA-seq). Principal component analysis (PCA) showed that three repeats of each sample clustered together (Figure S4A). The RNA-seq results were also confirmed by RT-qPCR for selected genes (Figure S4B), indicating that the RNA-seq data were reliable. A heatmap of differentially expressed genes (DEGs) showed clear differences upon Stella knockout and Stella overexpression (Figure S4C-D). Gene Ontology (GO) terms of the DEGs between Stella-knockout and control groups were related to G1/S transition of the mitotic cell cycle, regulation of cell proliferation, and developmental process (Figure 2G). Furthermore, KEGG pathway analysis of the DEGs between Stella-knockout and control groups showed associations with the NF-kappa B signaling pathway, JAK-STAT signaling pathway, and PI3K-AKT signaling pathway (Figure S4E-F). As previously reported, the PI3K-AKT signaling pathway is involved in regulating FGSCs [5]. In addition, GO terms associated with Stella overexpression included biological processes related to the developmental process, positive regulation of cellular process, and regulation of cellular metabolic process (Figure 2H). In brief, these results suggest that Stella knockout enhanced FGSC proliferation or self-renewal, whereas Stella overexpression inhibited FGSC growth and promoted cell differentiation.
Stella modulates genome-wide DNA methylation patterns in female germline stem cells
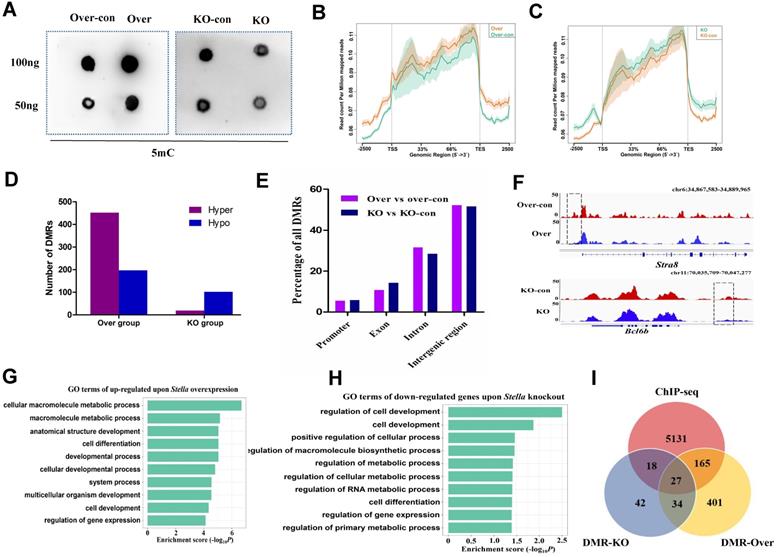
To explore molecular mechanism of Stella in FGSC development, we performed dot blotting assays. The results showed that DNA methylation was positively correlated with Stella expression level in FGSCs (Figure 3A), indicating Stella is related to DNA methylation in FGSCs. Then, we performed methylated DNA immunoprecipitation (MeDIP) to examine the effect of Stella on genome-wide DNA methylation levels in FGSCs. The methylation profiles showed a clear trend, low DNA methylation around transcription start sites (TSSs) and higher DNA methylation around transcription end sites (TESs) (Figure 3B-C). We detected 649 differentially methylated regions (DMRs) (452 hypermethylated and 197 hypomethylated) between the overexpression group, and 121 DMRs (19 hypermethylated and 102 hypomethylated) between the knockout group, respectively (Figure 3D). These findings were consistent with the results of dot blotting (Figure 3A), where Stella overexpression increased the level of DNA methylation, and Stella knockout reduced it. After mapping DMRs to the nearest genomic features, we found that the majority of DMRs were located in intergenic and intronic regions, and only a small portion of DMRs were identified in gene promoters (Figure 3E), suggesting DMRs were unevenly distributed across the genome. DNA demethylation at the gene promoter region usually upregulates gene expression [54]. The analysis results demonstrated that Stra8 gene promoter region was demethylated after Stella overexpression (Figure 3F), which was consistent with the upregulation trend of Stra8 expression (Figure 2E-F). Similarly, demethylation of Bcl6b gene promoter after Stella knockout was accompanied by upregulation of Bcl6b mRNA expression (Figure 3F, S3D). GO terms particularly associated with genes upregulated upon Stella overexpression were cell differentiation, cell development, and regulation of gene expression (Figure 3G). Meanwhile, GO terms particularly associated with genes downregulated upon Stella knockout were regulation of cell development, positive regulation of cellular process, and regulation of gene expression (Figure 3H). We also compared STELLA binding sites with the DMRs upon Stella overexpression and -knockout. The results showed that 37% of Stella-knockout DMRs and 31% of Stella-overexpression DMRs overlapped with STELLA binding sites at the genome-wide level (Figure 3I). Moreover, the ChIP-seq of STELLA was highly correlated with the DNA methylation (Figure S5A-B). Thus, above findings indicated that a subset of DNA methylation regions was directly regulated by STELLA binding. Overall, these results suggest that Stella regulates FGSC development via DNA methylation.
Effect of Stella on genome-wide DNA methylation. (A) Dot blotting of DNA methylation. (B, C) Methylation distribution of gene body and flanking regions in Stella-overexpressing (B) and -knockout FGSCs (C). (D) Histograms showing the numbers of DMRs between the Over group (over vs over-con), or KO group (KO vs KO-con). (E) Distribution of DMRs in different genomic features. (F) A snapshot of the IGV genome browser showing DNA methylation (5mC) signal at the Stra8 locus (top track) and Bcl6b locus (bottom track). (G, H) GO enrichment analysis of upregulated DEGs upon Stella overexpression (G) and downregulated DEGs upon Stella knockdown (H). (I) Venn diagrams showing the number of STELLA ChIP-seq peaks overlapping with DMRs. KO-con, Stella knockout control. KO, Stella knockout. Over-con, Stella-overexpressing control. Over, Stella overexpression. DMR-KO, DMR genes number upon Stella knockout. DMR-Over, DMR genes number upon Stella overexpression.
STELLA and active histone modification are enriched near TAD boundaries
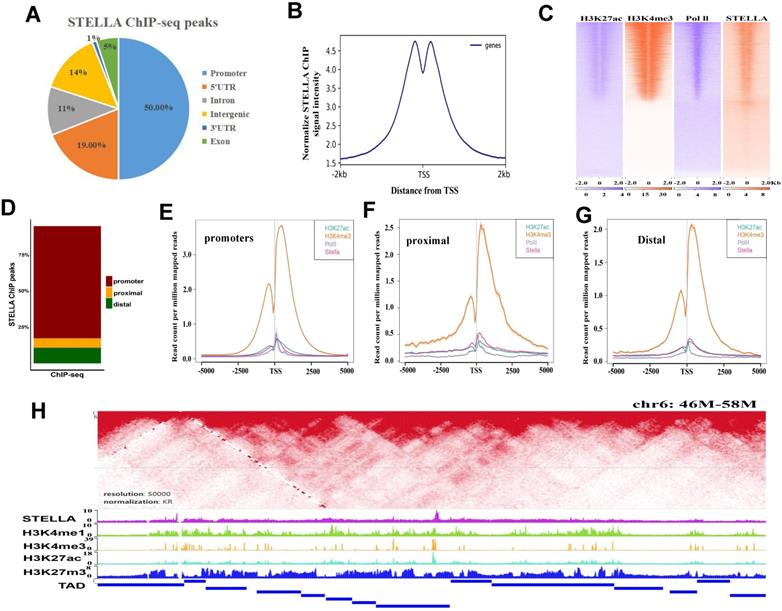
To identify genomic loci occupied by STELLA proteins, we performed STELLA ChIP-seq experiments. Annotation of ChIP-seq peaks revealed that 50% of STELLA binding sites were localized in promoter regions and 25% of the binding sites were located within introns and intergenic regions (Figure 4A). Consistent with the genome annotation, the normalized STELLA binding signal was high at promoter regions (Figure 4B). Furthermore, we found that the STELLA ChIP correlated well with previously published histone modification data (Figure 4C). We further categorized STELLA peaks into three classes based on the distance from TSSs (Figure 4D). The enrichment of STELLA at promoter, proximal, and distal sites showed clear overlap with active TSS marks (H3K27ac, Pol II, and H3K4me3) (Figure 4E-G), which implied that Stella is likely to be involved in gene expression regulation. Moreover, integrative analysis of ChIP-Seq and published Hi-C data [9] showed that the binding sites of STELLA and active histones H3K4me3 and H3K27ac were enriched near the TAD boundaries (Figure 4H), suggesting STELLA is related to chromatin structure remodeling.
STELLA and active histone modifications are enriched near TAD boundaries. (A) Pie chart representing the distribution of STELLA ChIP-seq peaks relative to genes. (B) The distance from the TSS to the promoter targets for STELLA is plotted. (C) Heatmap of Stella and histone marks from previously published datasets H3K4me3, H3K27ac, and Pol II ChIP-seq (±2.5 kb from peak center). (D) Bar plot shows percent enrichment of STELLA ChIP-seq peaks at distal, promoter, and proximal regions. (E-G) Density plot of ChIP-seq signals of STELLA and histone marks centered at STELLA peak located in distal, proximal, and promoter regions. (H) Heatmap showing that STELLA and active histone modifications are enriched near TAD boundaries.
Stella overexpression perturbs chromatin interactions
To further study the effect of Stella on chromatin structure, we performed in situ Hi-C experiments with Stella-overexpressing FGSCs and the control groups. More than 700 million total reads were obtained (Table S4). At the chromosomal scale, Hi-C contact maps appeared similar between the Stella-overexpressing group and the control (Figure 5A-C). The PC1 values were also highly correlated (Figure 5D, R=0.89). Consistent with this, the majority of the compartmentalization was largely unchanged upon Stella overexpression (Figure S6A). Upon Stella overexpression, only 3.4% of the genome had a transition from compartment A-type to compartment B-type, while 2.8% showed a transition in the opposite direction (Figure S6B). Next, we investigated whether the STELLA binding regions were associated with compartment switching. Among all STELLA-bound sites, 47.2% of peaks were located within the open compartment A regions, 46.2% of peaks were located within the closed compartment B regions, and ~7.1% of STELLA peaks were found in regions showing compartment-switching (Figure 5E). We assessed whether the percentage of genomic compartment-switching regions was related to a state of being either bound or unbound by STELLA. The proportion of STELLA binding sites is 75% of “A to B” compartment-switching regions, which was similar to 55% of “B to A” (Figure 5F). This suggests that Stella is unlikely to mediate compartment switching.
Stella overexpression perturbs chromatin interactions. (A) Genome-wide chromatin conformation Hi-C analysis was performed using two replicates of Stella-overexpressing and controls. Representative normalized Hi-C interaction heatmaps of chromosome 19 at 1 Mb resolution are shown in (A) Stella-overexpressing and (B) control cells. (C) Differential interaction heatmap for chromosome 19 (1 Mb), showing bins for upregulated (red) and downregulated (blue) interactions. (D) The correlation of cis-eigenvector 1 values between the Stella-overexpressing and control cells. Correlation coefficient (r)=0.89. (E) Pie chart showing the compartment-switching profiles of STELLA-bound regions. (F) Bar graph showing the percentage of the compartment-switching regions that are bound by STELLA. The colored portions of the graph denote the STELLA-bound percentage of each compartment-switching category. (G) Volcano plot representing differential interactions (DI) at 20 kb resolution. (H) Venn diagrams showing the number of STELLA ChIP-seq peaks overlapping with all differential interacting bins at 20-kb resolution. (I) Plot showing number of differential interactions calculated in 20-kb bins, based on the presence and absence of overlapping STELLA peaks at genome wide level.
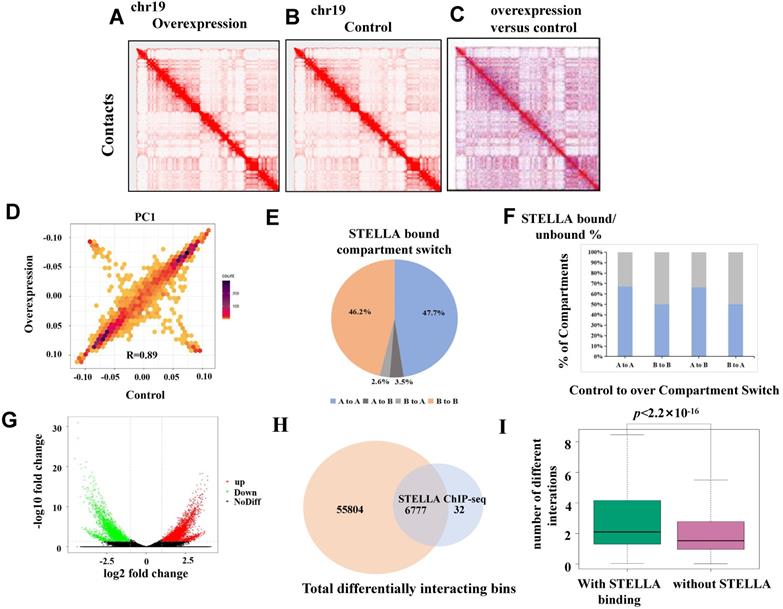
We compared Hi-C data between the Stella-overexpressing and control groups to obtain a deeper insight into the differential interaction. The results revealed differences in genome-wide chromatin interactions between Stella-overexpressing and control groups (Figure 5G). Furthermore; we found that 99.5% of STELLA binding sites overlapped with differentially interacting regions at the genome-wide level (Figure 5H). After calculating the number of differential interactions within or without STELLA enrichment, we observed that the number of differential interactions involving STELLA binding sites was significantly higher than that without STELLA binding (Figure 5I). Overall, the results suggest that Stella regulates chromatin interactions, while not affecting compartment formation.
Stella overexpression enhances the TAD boundary strength in STELLA-associated regions
To examine the effect of Stella on TAD organization, we first identified 1740 and 1723 TADs in STELLA-overexpressing and control groups (Figure S7A), respectively. Most of the TADs overlapped between STELLA-overexpressing and control groups (Figure S7B). Consistent with this, we found that the size of TADs was similar between Stella-overexpressing and control groups (Figure S7C). We also assessed the distribution of TADs within A/B compartments and found that about 4.6% of them switched at the genome-wide level (Figure S7D). Nevertheless, genome-wide statistical analysis showed the interaction within TADs reduced after Stella-overexpressing (Figure 6A-B).
Stella overexpression enhances the TAD boundary strength in STELLA-associated regions. (A) Genome-wide statistical analysis within TADs at 400 kb resolution. (B) A representative region showing contacts and TAD boundaries at 20 kb resolution. (C) Venn diagram showing the number of overlapping TAD boundaries between control and Stella-overexpressing cells. (D) Pie chart showing the percentage of STELLA localization at TAD boundaries. (E) The frequency plot of STELLA ChIP-seq peaks per 25 kb for ±0.5 Mb of each overexpression TAD boundary. (F) Box plot showing that the TAD boundary intensity score was higher after Stella overexpression. (G) STELLA binding is associated with higher TAD boundary scores. Box plot showing the TAD boundary scores for STELLA-bound and unbound TAD boundaries. (H) Box plot showing the TAD boundary score distribution for the overlapping and control and Stella-overexpressing cell-specific TAD boundaries.
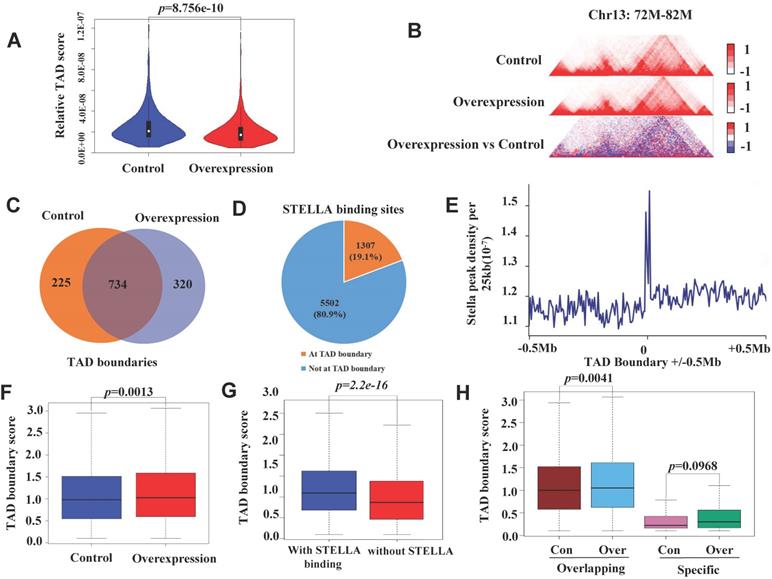
In addition, we identified 1054 and 959 TAD boundaries in Stella-overexpressing and control groups, respectively (Figure 6C). Although TADs are stable across different cell types and species [52, 55], Stella overexpression still altered the localization of ∼23% of TAD boundaries (Figure 6C). An analysis of the overlap of STELLA ChIP-seq peaks with TAD boundaries revealed that ∼19% of STELLA binding sites were located at TAD boundaries (Figure 6D). We also observed the enrichment of STELLA binding at the TAD boundaries (Figure 6E). Next, we wondered whether Stella regulates TAD boundary strength. The analysis showed that the overall TAD boundary strength increased after Stella overexpression (Figure 6F). Furthermore, integrative analysis of Hi-C and ChIP-seq showed the TAD boundary strength was higher in STELLA binding sites than unbinding region (Figure 6G). Interestingly, Stella overexpression resulted in an overall increase in the overlapping TAD boundaries not the specific TAD boundaries (Figure 6H). Consistently, we next examined TADs in Stella-knockout FGSCs. A total of 1951 TADs was identified in Stella-knockout FGSCs, most of which overlapped with the control groups (Figure S8A). In addition, genome-wide statistical analysis showed the interaction within TADs enhanced (Figure S8B-C), while the overall TAD boundary strength reduced after Stella knockout (Figure S8D). Unlike the case with overexpression, Stella knockout weakened the TAD boundary strength of overlapping and specific regions (Figure S8E). Taken together, these results demonstrate that Stella regulates TAD boundary strength in Stella-associated regions.
Discussion
Stella plays significant roles in chromatin condensation and epigenetic modification [56-58]. However, despite its importance, there has thus far been relatively little research on Stella, especially for germ cells in vitro. The results obtained in this work demonstrated that Stella regulates FGSC development at multiple epigenetic levels, including DNA methylation, chromatin interaction, and TAD boundary strength.
Stella was first discovered in mice when its expression was shown to occur in gastrulating embryos, which may represent the differentiation of a subpopulation of cells into the PGCs lineage [56]. Our results showed that Stella knockout enhanced FGSC proliferation. Additionally, Stella overexpression in FGSCs was found to promote the expression of Stra8, which is an essential “gatekeeper” in the initiation of meiosis [59]. The upregulation of its expression may indicate that the FGSCs had entered pre-meiosis.
A better understanding of the Stella gene would provide us with a new perspective on in vitro differentiation. To date, our understanding of the role of Stella in regulating DNA methylation has been obscured by conflicting results from different developmental stages or cell types [21, 26, 57]. We found that genome-wide DNA methylation was reduced in FGSCs after Stella knockout. This trend corresponds to previously reported results showing that Stella protects DNA methylation from TET2 and TET3 enzyme-dependent oxidation [26]. In parallel with this, the level of global DNA methylation was upregulated in FGSCs after Stella overexpression. This pattern is also coherent with oogenesis, during which the levels of DNA methylation and Stella expression increase [5]. One possible explanation for the pattern of Stella on DNA methylation may be related to its subcellular localization [20, 60, 61].
In addition to DNA methylation and DNA demethylation [54, 62, 63], dramatic remodeling of the chromatin also occurred in the early germline [64-66]. Although Stella overexpression does not alter Compartment A/B and TAD formation, what is surprising is that Stella overexpression reduce the interaction within TADs and enhance the boundary strength of TADs in STELLA-associated regions. These findings are consistent with previous observations that the interaction frequency within TADs decreased during oocyte maturation [67]. Our findings also mean that Stella overexpression reduces the frequency of contacts between the target genes and regulatory elements. Given that the proper folding of chromatin is crucial for gene regulation, increasing attention has been drawn to the relationship between alterations in chromatin structure and diseases. Destruction of TAD boundaries would lead to the dysregulation of gene expression and diseases [68, 69]. Stella knockout has been shown to lead to an abnormal heterochromatin distribution in fully grown GV oocytes [70, 71], subsequently impaired oocytes and embryo development [19].
In addition to Stella, FGSCs also express other germline genes such as Ddx4, Fragilis, and Dazl [2]. Most of them have been reported to play critical roles in germ cell development. For example, the depletion of Dazl causes dysregulation of maternal transcripts during mouse oocyte maturation [72]. Moreover, knockdown of Ddx4 reduces the number of germ cells in the gonads of male and female embryos [73]. Whether these germline genes regulate germ cell development by affecting chromatin structure warrants further study. Based on our combined findings, our study reveals not only the role of Stella in regulating DNA methylation, but also that it affects the 3D structure of chromatin. Our findings deepen our understanding of the epigenetic mechanisms of FGSC development. Further research should focus on how Stella coordinates the relationship between DNA methylation and 3D chromatin structure in FGSCs.
Supplementary Material
Supplementary figures.
Supplementary table.
Acknowledgements
This study was supported by the National Basic Research Program of China (2017YFA0504201), National Nature Science Foundation of China (81720108017), the National Major Scientific Instruments and Equipment Development Project, National Nature Science Foundation of China (61827814), Shenzhen Key Projects of Basic Research (No. JCYJ20200109150618539).
Author Contributions
Changliang Hou and Ji Wu designed the experiment. Changliang Hou conducted all the major experiments and wrote the manuscript. Xinyan Zhao carried out the ChIP experiments. Geng G. Tian analyzed the sequencing data and revised the manuscript. Ji Wu initiated and supervised the entire project, and revised the manuscript.
Accession number
The accession number for the Hi-C, ChIP-seq, MeDIP-seq, and RNA-seq data reported in this paper is GEO: GSE188961.
Competing Interests
The authors have declared that no competing interest exists.
References
1. Scoccia B. What is New in Assisted Reproduction and Multiple Pregnancy Reduction?: Best Articles From the Past Year. Obstet Gynecol. 2015;126:446-7
2. Zou K, Yuan Z, Yang Z, Luo H, Sun K, Zhou L. et al. Production of offspring from a germline stem cell line derived from neonatal ovaries. Nat Cell Biol. 2009;11:631-6
3. Ding X, Liu G, Xu B, Wu C, Hui N, Ni X. et al. Human GV oocytes generated by mitotically active germ cells obtained from follicular aspirates. Sci Rep. 2016;6:28218
4. Zhou L, Wang L, Kang JX, Xie W, Li X, Wu C. et al. Production of fat-1 transgenic rats using a post-natal female germline stem cell line. Mol Hum Reprod. 2014;20:271-81
5. Ma B, Lee TL, Hu B, Li J, Li X, Zhao X. et al. Molecular characteristics of early-stage female germ cells revealed by RNA sequencing of low-input cells and analysis of genome-wide DNA methylation. DNA Res. 2019;26:105-17
6. Li X, Hu X, Tian GG, Cheng P, Li Z, Zhu M. et al. C89 Induces Autophagy of Female Germline Stem Cells via Inhibition of the PI3K-Akt Pathway In vitro. Cells. 2019;8:606
7. Zhang C, Wu J. Production of offspring from a germline stem cell line derived from prepubertal ovaries of germline reporter mice. Molecular Human Reproduction. 2016;22:457-64
8. Zou K, Wang J, Bi H, Zhang Y, Tian X, Tian N. et al. Comparison of different in vitro differentiation conditions for murine female germline stem cells. Cell Prolif. 2019;52:e12530
9. Luo H, Li X, Tian GG, Li D, Hou C, Ding X. et al. Offspring production of ovarian organoids derived from spermatogonial stem cells by defined factors with chromatin reorganization. J Adv Res. 2021;33:81-98
10. Hill PWS, Leitch HG, Requena CE, Sun Z, Amouroux R, Roman-Trufero M. et al. Epigenetic reprogramming enables the transition from primordial germ cell to gonocyte. Nature. 2018;555:392-6
11. Wang L, Zhang J, Duan J, Gao X, Zhu W, Lu X. et al. Programming and inheritance of parental DNA methylomes in mammals. Cell. 2014;157:979-91
12. Zhang XL, Wu J, Wang J, Shen T, Li H, Lu J. et al. Integrative epigenomic analysis reveals unique epigenetic signatures involved in unipotency of mouse female germline stem cells. Genome Biol. 2016;17:162
13. Zhao Y, Li X, Tian G, Zhao X, Wong J, Shen Y. et al. Ubiquitin-Specific-Processing Protease 7 Regulates Female Germline Stem Cell Self-Renewal Through DNA Methylation. Stem Cell Rev Rep. 2021;17:938-51
14. Wang J, Gong X, Tian GG, Hou C, Zhu X, Pei X. et al. Long noncoding RNA growth arrest-specific 5 promotes proliferation and survival of female germline stem cells in vitro. Gene. 2018;653:14-21
15. Li B, Hu X, Yang Y, Zhu M, Zhang J, Wang Y. et al. GAS5/miR-21 Axis as a Potential Target to Rescue ZCL-082-Induced Autophagy of Female Germline Stem Cells In vitro. Mol Ther Nucleic Acids. 2019;17:436-47
16. Li X, Tian G, Wu J. Novel circGFRalpha1 Promotes Self-Renewal of Female Germline Stem Cells Mediated by m(6)A Writer METTL14. Front Cell Dev Biol. 2021;9:640402
17. Zhao X, Tian GG, Fang Q, Pei X, Wang Z, Wu J. Comparison of RNA m(6)A and DNA methylation profiles between mouse female germline stem cells and STO cells. Mol Ther Nucleic Acids. 2021;23:431-9
18. Sato M, Kimura T, Kurokawa K, Fujita Y, Abe K, Masuhara M. et al. Identification of PGC7, a new gene expressed specifically in preimplantation embryos and germ cells. Mech Dev. 2002;113:91-4
19. Payer B, Saitou M, Barton SC, Thresher R, Dixon JP, Zahn D. et al. Stella is a maternal effect gene required for normal early development in mice. Curr Biol. 2003;13:2110-7
20. Liu YJ, Nakamura T, Nakano T. Essential role of DPPA3 for chromatin condensation in mouse oocytogenesis. Biol Reprod. 2012;86:40
21. Nakamura T, Arai Y, Umehara H, Masuhara M, Kimura T, Taniguchi H. et al. PGC7/Stella protects against DNA demethylation in early embryogenesis. Nat Cell Biol. 2007;9:64-71
22. Wongtrakoongate P, Jones M, Gokhale PJ, Andrews PW. STELLA facilitates differentiation of germ cell and endodermal lineages of human embryonic stem cells. PLoS One. 2013;8:e56893
23. Yan Q, Zhang Y, Fang X, Liu B, Wong TL, Gong L. et al. PGC7 promotes tumor oncogenic dedifferentiation through remodeling DNA methylation pattern for key developmental transcription factors. Cell Death Differ. 2021;28:1955-70
24. Nakamura T, Liu YJ, Nakashima H, Umehara H, Inoue K, Matoba S. et al. PGC7 binds histone H3K9me2 to protect against conversion of 5mC to 5hmC in early embryos. Nature. 2012;486:415-9
25. Wossidlo M, Nakamura T, Lepikhov K, Marques CJ, Zakhartchenko V, Boiani M. et al. 5-Hydroxymethylcytosine in the mammalian zygote is linked with epigenetic reprogramming. Nat Commun. 2011;2:241
26. Bian C, Yu X. PGC7 suppresses TET3 for protecting DNA methylation. Nucleic Acids Res. 2014;42:2893-905
27. Singer ZS, Yong J, Tischler J, Hackett JA, Altinok A, Surani MA. et al. Dynamic heterogeneity and DNA methylation in embryonic stem cells. Mol Cell. 2014;55:319-31
28. Arakawa T, Nakatani T, Oda M, Kimura Y, Sekita Y, Kimura T. et al. Stella controls chromocenter formation through regulation of Daxx expression in 2-cell embryos. Biochem Biophys Res Commun. 2015;466:60-5
29. Zenk F, Zhan Y, Kos P, Löser E, Atinbayeva N, Schächtle M. et al. HP1 drives de novo 3D genome reorganization in early Drosophila embryos. Nature. 2021;593:289-93
30. Wang L, Gao Y, Zheng X, Liu C, Dong S, Li R. et al. Histone Modifications Regulate Chromatin Compartmentalization by Contributing to a Phase Separation Mechanism. Mol Cell. 2019;76:646-59
31. Huo X, Ji L, Zhang Y, Lv P, Cao X, Wang Q. et al. The Nuclear Matrix Protein SAFB Cooperates with Major Satellite RNAs to Stabilize Heterochromatin Architecture Partially through Phase Separation. Mol Cell. 2020;77:368-83
32. Rao SS, Huntley MH, Durand NC, Stamenova EK, Bochkov ID, Robinson JT. et al. A 3D map of the human genome at kilobase resolution reveals principles of chromatin looping. Cell. 2014;159:1665-80
33. Naumova N, Smith EM, Zhan Y, Dekker J. Analysis of long-range chromatin interactions using Chromosome Conformation Capture. Methods. 2012;58:192-203
34. Lieberman-Aiden E, van Berkum NL, Williams L, Imakaev M, Ragoczy T, Telling A. et al. Comprehensive mapping of long-range interactions reveals folding principles of the human genome. Science. 2009;326:289-93
35. Rowley MJ, Corces VG. Organizational principles of 3D genome architecture. Nat Rev Genet. 2018;19:789-800
36. Bouwman BA, de Laat W. Getting the genome in shape: the formation of loops, domains and compartments. Genome Biol. 2015;16:154
37. Wu C, Xu B, Li X, Ma W, Zhang P, Chen X. et al. Tracing and Characterizing the Development of Transplanted Female Germline Stem Cells In vivo. Mol Ther. 2017;25:1408-19
38. Doench JG, Fusi N, Sullender M, Hegde M, Vaimberg EW, Donovan KF. et al. Optimized sgRNA design to maximize activity and minimize off-target effects of CRISPR-Cas9. Nat Biotechnol. 2016;34:184-91
39. Shen B, Zhang J, Wu H, Wang J, Ma K, Li Z. et al. Generation of gene-modified mice via Cas9/RNA-mediated gene targeting. Cell Res. 2013;23:720-3
40. Jia Z, Liang Y, Ma B, Xu X, Xiong J, Duan L. et al. A 5-mC Dot Blot Assay Quantifying the DNA Methylation Level of Chondrocyte Dedifferentiation In vitro. J Vis Exp. 2017;17:55565
41. Huang K, Jia J, Wu C, Yao M, Li M, Jin J. et al. Ribosomal RNA gene transcription mediated by the master genome regulator protein CCCTC-binding factor (CTCF) is negatively regulated by the condensin complex. J Biol Chem. 2013;288:26067-77
42. Pertea M, Kim D, Pertea GM, Leek JT, Salzberg SL. Transcript-level expression analysis of RNA-seq experiments with HISAT, StringTie and Ballgown. Nat Protoc. 2016;11:1650-67
43. Simandi Z, Horvath A, Wright LC, Cuaranta-Monroy I, De Luca I, Karolyi K. et al. OCT4 Acts as an Integrator of Pluripotency and Signal-Induced Differentiation. Mol Cell. 2016;63:647-61
44. Langmead B, Salzberg SL. Fast gapped-read alignment with Bowtie 2. Nat Methods. 2012;9:357-9
45. Li H, Handsaker B, Wysoker A, Fennell T, Ruan J, Homer N. et al. The Sequence Alignment/Map format and SAMtools. Bioinformatics. 2009;25:2078-9
46. Ramírez F, Ryan DP, Grüning B, Bhardwaj V, Kilpert F, Richter AS. et al. deepTools2: a next generation web server for deep-sequencing data analysis. Nucleic Acids Res. 2016;44:160-5
47. Tian GG, Zhao X, Hou C, Xie W, Li X, Wang Y. et al. Integrative analysis of the 3D genome structure reveals that CTCF maintains the properties of mouse female germline stem cells. Cell Mol Life Sci. 2022;79:22
48. Servant N, Varoquaux N, Lajoie BR, Viara E, Chen CJ, Vert JP. et al. HiC-Pro: an optimized and flexible pipeline for Hi-C data processing. Genome Biol. 2015;16:259
49. Imakaev M, Fudenberg G, McCord RP, Naumova N, Goloborodko A, Lajoie BR. et al. Iterative correction of Hi-C data reveals hallmarks of chromosome organization. Nat Methods. 2012;9:999-1003
50. Durand NC, Shamim MS, Machol I, Rao SS, Huntley MH, Lander ES. et al. Juicer Provides a One-Click System for Analyzing Loop-Resolution Hi-C Experiments. Cell Syst. 2016;3:95-8
51. Servant N, Lajoie BR, Nora EP, Giorgetti L, Chen CJ, Heard E. et al. HiTC: exploration of high-throughput 'C' experiments. Bioinformatics. 2012;28:2843-4
52. Dixon JR, Selvaraj S, Yue F, Kim A, Li Y, Shen Y. et al. Topological domains in mammalian genomes identified by analysis of chromatin interactions. Nature. 2012;485:376-80
53. Wang Y, Li X, Gong X, Zhao Y, Wu J. MicroRNA-322 Regulates Self-renewal of Mouse Spermatogonial Stem Cells through Rassf8. Int J Biol Sci. 2019;15:857-69
54. Guo F, Yan L, Guo H, Li L, Hu B, Zhao Y. et al. The Transcriptome and DNA Methylome Landscapes of Human Primordial Germ Cells. Cell. 2015;161:1437-52
55. Nora EP, Lajoie BR, Schulz EG, Giorgetti L, Okamoto I, Servant N. et al. Spatial partitioning of the regulatory landscape of the X-inactivation centre. Nature. 2012;485:381-5
56. Zhao S, Xu J, Liu S, Cui K, Li Z, Liu N. Dppa3 in pluripotency maintenance of ES cells and early embryogenesis. J Cell Biochem. 2019;120:4794-9
57. Li Y, Zhang Z, Chen J, Liu W, Lai W, Liu B. et al. Stella safeguards the oocyte methylome by preventing de novo methylation mediated by DNMT1. Nature. 2018;564:136-40
58. Xu X, Smorag L, Nakamura T, Kimura T, Dressel R, Fitzner A. et al. Dppa3 expression is critical for generation of fully reprogrammed iPS cells and maintenance of Dlk1-Dio3 imprinting. Nat Commun. 2015;6:6008
59. Baltus AE, Menke DB, Hu YC, Goodheart ML, Carpenter AE, de Rooij DG. et al. In germ cells of mouse embryonic ovaries, the decision to enter meiosis precedes premeiotic DNA replication. Nat Genet. 2006;38:1430-4
60. Funaki S, Nakamura T, Nakatani T, Umehara H, Nakashima H, Nakano T. Inhibition of maintenance DNA methylation by Stella. Biochem Biophys Res Commun. 2014;453:455-60
61. Nakashima H, Kimura T, Kaga Y, Nakatani T, Seki Y, Nakamura T. et al. Effects of dppa3 on DNA methylation dynamics during primordial germ cell development in mice. Biol Reprod. 2013;88:125
62. Guo H, Hu B, Yan L, Yong J, Wu Y, Gao Y. et al. DNA methylation and chromatin accessibility profiling of mouse and human fetal germ cells. Cell Res. 2017;27:165-83
63. Wang M, Liu X, Chang G, Chen Y, An G, Yan L. et al. Single-Cell RNA Sequencing Analysis Reveals Sequential Cell Fate Transition during Human Spermatogenesis. Cell Stem Cell. 2018;23:599-614
64. Du Z, Zheng H, Kawamura YK, Zhang K, Gassler J, Powell S. et al. Polycomb Group Proteins Regulate Chromatin Architecture in Mouse Oocytes and Early Embryos. Mol Cell. 2020;77:825-39
65. Wang Y, Wang H, Zhang Y, Du Z, Si W, Fan S. et al. Reprogramming of Meiotic Chromatin Architecture during Spermatogenesis. Mol Cell. 2019;73:547-61
66. Vara C, Paytuvi-Gallart A, Cuartero Y, Le Dily F, Garcia F, Salva-Castro J. et al. Three-Dimensional Genomic Structure and Cohesin Occupancy Correlate with Transcriptional Activity during Spermatogenesis. Cell Rep. 2019;28:352-67
67. Flyamer IM, Gassler J, Imakaev M, Brandao HB, Ulianov SV, Abdennur N. et al. Single-nucleus Hi-C reveals unique chromatin reorganization at oocyte-to-zygote transition. Nature. 2017;544:110-4
68. Lupianez DG, Kraft K, Heinrich V, Krawitz P, Brancati F, Klopocki E. et al. Disruptions of topological chromatin domains cause pathogenic rewiring of gene-enhancer interactions. Cell. 2015;161:1012-25
69. Davis L, Onn I, Elliott E. The emerging roles for the chromatin structure regulators CTCF and cohesin in neurodevelopment and behavior. Cell Mol Life Sci. 2018;75:1205-14
70. De La Fuente R. Chromatin modifications in the germinal vesicle (GV) of mammalian oocytes. Dev Biol. 2006;292:1-12
71. Christine BB, Lahcen H, Juliette G, Nathalie B, Szöllösi M, Pascale DJBoR. Differential Transcriptional Activity Associated with Chromatin Configuration in Fully Grown Mouse Germinal Vesicle Oocytes. Biol Reprod. 1999;60:580-7
72. Yang CR, Rajkovic G, Daldello EM, Luong XG, Chen J, Conti M. The RNA-binding protein DAZL functions as repressor and activator of mRNA translation during oocyte maturation. Nat Commun. 2020;11:1399
73. Aduma N, Izumi H, Mizushima S, Kuroiwa A. Knockdown of DEAD-box helicase 4 (DDX4) decreases the number of germ cells in male and female chicken embryonic gonads. Reprod Fertil Dev. 2019;31:847-54
Author contact
![]() Corresponding authors: Ji Wu (E-mail: jiwuedu.cn); Geng G. Tian (E-mail: gengtianedu.cn)
Corresponding authors: Ji Wu (E-mail: jiwuedu.cn); Geng G. Tian (E-mail: gengtianedu.cn)