Impact Factor ISSN: 1449-2288
- Issue 12; 2026
- Issue 11; 2026
- Issue 10; 2026
- Issue 9; 2026
- Issue 8; 2026
- Volume 22; 2026
- Past Issues
- Advance Articles
- Editorial Board
- Cover Images
- Index & Coverage
- Cover Suggestion
- Special Issues
Introduction
Materials and Methods
Results
Discussion
Abbreviation
Supplementary Material
Acknowledgements
References

 Global reach, higher impact
Int J Biol Sci 2025; 21(9):4131-4152. doi:10.7150/ijbs.111228 This issue Cite
Research Paper
Acute Exposure to Cadmium Triggers NCOA4-Mediated Ferritinophagy and Ferroptosis in Never-Smokers Oral Cancer Cells
Lavinia Petriaggi1#, Emanuele Giorgio1#, Stefania Bulotta2, Alessandro Antonelli3, Sonia Bonacci4, Marialaura Frisina4, Antonio Procopio4, Licia Elvira Prestagiacomo5, Annarita Giuliano5, Marco Gaspari5, Gianluca Santamaria6, Giorgia Federico7, Cristiana Galeano1, Giuseppe Natali1, Amerigo Giudice3, Francesco Costanzo1, Anna Martina Battaglia1 ![]() , Flavia Biamonte1
, Flavia Biamonte1
1. Laboratory of Biochemistry and Cell Biology, Department of Experimental and Clinical Medicine, “Magna Graecia” University of Catanzaro, Italy.
2. Department of Health Sciences, “Magna Graecia” University of Catanzaro, Italy.
3. School of Dentistry, Department of Health Sciences, “Magna Graecia” University of Catanzaro, Italy.
4. Green Chemistry Laboratory, Department of Health Sciences, “Magna Graecia” University of Catanzaro, Italy.
5. Research Centre for Advanced Biochemistry and Molecular Biology, Department of Experimental and Clinical Medicine, “Magna Graecia” University of Catanzaro, Italy.
6. Interdepartmental Center of Services, Molecular Genomics and Pathology, “Magna Graecia” Graecia University of Catanzaro, Italy.
7. Department of Molecular Medicine and Medical Biotechnology, University of Naples “Federico II”, Naples, Italy.
# These authors contributed equally.
Received 2025-1-28; Accepted 2025-4-28; Published 2025-6-20
Abstract

Cadmium (Cd), a carcinogenic component of tobacco, is a recognized risk factor for oral squamous cell carcinoma (OSCC). However, the molecular mechanisms underlying Cd-induced cytotoxicity in OSCC remain largely undefined. Here, we demonstrate that acute Cd exposure triggers ferroptosis in CAL27 OSCC cells derived from never-smokers, but not in SCC154 cells derived from smokers. Mechanistically, Cd outcompetes Fe, causing early iron depletion and activating the nuclear receptor coactivator 4 (NCOA4)-mediated ferritinophagy. This process enhances the labile iron pool, promotes mitochondrial reactive oxygen species (ROS) generation, lipid peroxidation, and ferroptotic cell death. Notably, iron supplementation rescues CAL27 cells from Cd-induced damage, while exacerbating iron deficiency through transferrin receptor CD71 silencing amplifies cytotoxicity. Conversely, OSCC cells from smokers exhibit resistance to Cd toxicity, likely due to the overexpression of metallothionein 2A (MT2A), a heavy metal detoxification protein. Collectively, this study provides the evidence that ferritinophagy may act as a critical upstream driver of Cd-induced ferroptosis in OSCC cells derived from never-smokers, paving the way for potential ferroptosis-targeted therapeutic strategies in Cd-associated malignancies.
Keywords: Cadmium, Ferroptosis, Ferritinophagy, NCOA4, Oral Cancer, Iron Metabolism, Smokers
Introduction
The homeostasis of intracellular metal ions is essential for maintaining cellular integrity and function. However, disturbances in metal balance can trigger a cascade of toxic events, including oxidative damage to proteins and DNA, disruption of cell membranes, and activation of regulated cell death (RCD) pathways (1,2). In recent years, a growing body of evidence has delineated distinct forms of metals-induced RCD, namely ferroptosis, cuproptosis, and calcicoptosis, each characterized by the accumulation of specific divalent cations, namely iron (Fe²⁺), copper (Cu²⁺), and calcium (Ca²⁺), respectively (3,4). In addition, exogenous metals such as zinc (Zn²⁺), manganese (Mn²⁺), and cadmium (Cd²⁺) have been shown to induce cell death through context-dependent mechanisms, often converging on oxidative stress and mitochondrial dysfunction (5,6).
Cd2+ is a well-recognized environmental pollutant, primarily originating from industrial processes, agricultural activities, and tobacco-consumption (5,7-9). Although Cd2+ is a non-Fenton-like metal and does not directly generate reactive oxygen species (ROS), it can induce oxidative stress through several indirect mechanisms (10,11). These include (i) depletion of antioxidant molecules such as glutathione (GSH), (ii) inhibition of ROS-detoxifying enzymes, (iii) displacement of essential redox-active metals (Zn²⁺ and Fe²⁺), and (iv) impairment of mitochondrial electron transport chain, collectively resulting in mitochondrial dysfunction and ROS overproduction (10-13).
Cd²⁺-induced oxidative stress has been recognized as a key driver of several pathological conditions, including cancer (12-17). In 1993, indeed, the International Agency for Research on Cancer (IARC) classified Cd²⁺ as a Group 1 carcinogen (18). Mechanistically, Cd2+ exerts its carcinogenic activity through multiple pathways, including the induction of oxidative DNA damage in the form of DNA mutation, strand breaks, and chromosomal aberrations, as well as the inhibition of DNA repair systems - notably through suppression of p53 DNA binding capacity and the suppression of DNA repair-associated genes (19-21). Beyond its genotoxic effect, Cd2+ also exerts epigenetic effects by altering DNA and histone methylation patterns. For instance, Cd2+-induced hypermethylation of tumor suppressor genes promoters, such as p16, has been associated with malignant transformation of human prostate epithelial cells (22). Furthermore, chronic exposure to sub-toxic concentrations of Cd2+ can activate defense mechanisms against oxidative stress, including the stimulation of ROS-sensitive transcription factors, such as nuclear factor erythroid 2-related factor 2 (Nrf2), activator protein 1 (AP-1) and nuclear factor-kB (NF-kB), as well as mitogen-activated protein kinases (MAPKs)- dependent signaling pathways, which may ultimately promote cell survival and tumorigenesis (23-25).
Over time, epidemiological studies have reported a significant association between Cd²⁺ exposure and increased risk of oral squamous cell carcinoma (OSCC), the most common subtype of head and neck squamous cell carcinoma (HNSCC) (26-28). In this context, both environmental factors and genetic alterations in oncogenes and tumor suppressor genes play central roles in OSCC pathogenesis (29-33). Notably, chronic and prolonged exposure to Cd2+ - particularly through tobacco consumption - appears to contribute to carcinogenic transformation of the oral epithelial mucosa (9,30,34-37). However, the molecular mechanism underlying the Cd2+-induced toxicity in oral epithelial cells remains incompletely understood and requires further study.
In this study, we investigated the effects of Cd²⁺ acute exposure in OSCC cells derived from non-smoker and smoker patients - the latter being chronically exposed to roughly 4-5 times higher levels of Cd²⁺ compared to non-smokers. Our findings reveal that Cd²⁺ toxicity selectively affects OSCC cells derived from non-smokers whereas OSCC cells derived from smokers display resistance, likely due to the overexpression of the heavy metal detoxification protein metallothionein 2A (MT2A). Notably, we demonstrate for the first time that, in OSCC cells derived from non-smokers, ferroptosis is involved in Cd²⁺-induced cytotoxicity. Mechanistically, Cd2+ outcompetes Fe, thus leading to an early iron depletion, which in turn acts as a driving force for the nuclear receptor coactivator 4 (NCOA4)- mediated autophagic degradation of ferritin (ferritinohagy). Ferritinophagy, subsequently, determines an increase in labile iron pool (LIP), mitochondrial ROS production, and lipid peroxidation. Overall, this study uncovers a novel mechanism of Cd-induced cytotoxicity in OSCC cells, providing a basis for developing ferroptosis-based therapeutic strategies for Cd-associated diseases.
Materials and Methods
Cell lines and cell culture
Human oral squamous cell lines (OSCC) - CAL27, OT1109, SCC090, and SCC154 - were purchased from the American Type Culture Collection (ATCC, Rockville, MD, United States). CAL27 and OT1109 cells were derived from never-smoker patients, while SCC090 and SCC154 originated from tobacco users. Following ATCC instruction, CAL27 cells were grown in DMEM medium (Sigma-Aldrich, St. Louis, Missouri, United States ), while SCC154 cells were cultured in MEM (Sigma-Aldrich, St. Louis, Missouri, United States), both supplemented with 10% (v/v) fetal bovine serum (FBS) (Invitrogen, San Diego, CA), L-glutamine and 1% (v/v) penicillin and streptomycin (Sigma-Aldrich, St. Louis, Missouri, United States) at 37°C in a humidified incubator with 5% CO2 atmosphere. All cell lines were tested for mycoplasma contaminations and authenticated via short tandem repeat (STR) profiling.
Reagents and treatments
Cadmium chloride (CdCl2), ferrostatin-1 (Fer-1) and bafilomycin (Baf) were purchased from Sigma Aldrich (Sigma-Aldrich, St. Louis, MO, USA). Ferlixit (62.5 mg/5 mL, sodium ferric gluconate complex in sucrose, SANOFI) has been obtained from the outpatient pharmacy at the Unit of Cardiology, “Magna Graecia” University of Catanzaro. Cells were seeded in a 12- and 6-well plate in complete medium. Each compound was used at the following final concentrations: CdCl2 at 0.1, 1, 5, 10, 50 and 100μM for 12h; CdCl2 at 26.1μM for 30', 1h, 6h and 12h; Fer-1 at 100μM for 24h; Baf at 1μM for 12h; ferlixit at 25, 50 and 100μM for 12h. Treatments were performed at least three times on independent biological replicates. CAL27 were exposed to 10μM CdCl2 for 30 days to induce metal tolerance (CAL27T); this concentration was replenished every 2-3 passages to maintain tolerance.
Patients and clinical samples
Fourteen OSCC patients, 7 non-smokers and 7 smokers, underwent surgery at the Oral Pathology and Oral Surgery Unit of “Magna Graecia” University, between December 2020 and December 2022 (32,33). For each patient, primary tumor tissue specimens were collected within the macroscopic lesion boundaries defined visually and by palpation. All patients provided a written informed consent at the time of data collection. No information that could identify individual participants are available. The procedures reported in this study were performed in accordance with the Helsinki Declaration guidelines (2008) on human experimentation and good clinical practice (good clinical practice or GCP).
PI staining analysis
Cells were incubated with propidium iodide (PI) at 37°C for 15 min in the dark, washed twice with PBS, and analyzed using a BD LSRFortessa™ X-20 flow cytometer (BD Biosciences, San Jose, CA, USA). A total of 2×10⁴ events were acquired for each sample. Data analysis was carried out using FlowJo™ v10 Software (BD Biosciences, San Jose, CA). Each experiment was performed in triplicate.
Apoptosis assay
Apoptotic cells populations were identified using the Alexa Fluor®488 Annexin V/Dead Cell Apoptosis Kit (Thermo Fisher Scientific, Waltham, MA, USA (38). Briefly, 1×10⁵ single-cell suspensions from CAL27 and SCC154 cell lines were centrifuged and resuspended in 100μL 1X annexin-binding buffer. To each sample, 5μL Alexa Fluor®488 Annexin V and 1μL PI working solution (100μg/mL) were added. Samples were then incubated for 15' at room temperature in the dark. Each tube was diluted with 200 μL of Annexin Binding Buffer. Flow cytometry assays were performed using the BD LSRFortessa™ X-20 (BD Biosciences, San Jose, CA, USA). Data were acquired from three independent biological replicates and analyzed out using FlowJo™ v10 Software (BD Biosciences, San Jose, CA).
Cell viability assay (MTT)
Cell viability was assessed using the 3-[4,5-dimethylthiazolyl]-2,5-diphenyltetrazolium bromide (MTT) assay (Sigma-Aldrich, St. Louis, MO, USA) assay. Briefly, CAL27 and SCC154 cells (5 × 10⁴ cells/well) were seeded in a 24-well plates. Following exposure to CdCl2, cells were incubated with freshly prepared MTT solution (2 mg/mL) for 4h at 37 °C. Then, the supernatant was removed and replaced with 200μL of isopropanol to solubilize the resulting formazan crystals. Absorbance was measured at 595nm using a microplate spectrophotometer. Cell viability was expressed as a percentage relative to untreated control cells, which were set as 100%. The assay was performed at 0, 12, and 24h post-treatment. All experimental conditions were tested in triplicate across three independent experiments.
Wound healing assay
Cells (3 × 10⁵) were seeded in 12-well plates. A scratch was introduced using a sterile pipette tip, and wound closure was monitored at 0, 12, 24, 48, and 72 h using using the Leica THUNDER Microscope DMi8 (Leica Microsystems S.r.l., Wetzlar, Germany). The gap area was quantified using by using ImageJ software. All experiments were conducted in triplicate.
Total protein extraction and western Blot analysis
Total protein extracts were prepared using RIPA lysis buffer composed of 1M Tris HCl, Triton X-100, 3M NaCl, 0.5M EDTA, 10% SDS supplemented with cOmplete™ Protease Inhibitor Cocktail provided in EASYpacks (Roche Diagnostics, Mannheim, Germany) to prevent proteolytic degradation (39). Briefly, cells were lysed in ice-cold RIPA buffer and lysates were centrifuged at 12.000g for 30' at 4°C to remove insoluble debris. Protein concentration was determined using the Bio-Rad Protein Assay Dye according to manufacturer's instructions (Bio-Rad Laboratories, Hercules, California, United States). Equal amounts of protein (50μg) from each sample were separated by 8%-12% SDS-PAGE, run at 200V for 1h and 30'. Proteins were then transferred onto nitrocellulose membranes (Sigma-Aldrich, St. Louis, MO, United States) at 50V for 2h. Membranes were blocked with 5% non-fat milk or 5% BSA for 1h at room temperature, followed by overnight incubation at 4°C with the appropriate primary antibodies. The antibodies against ferritin heavy subunit (FtH1) (1:200, sc-376594), NCOA4 (1:500, sc-373739) and hypoxia inducible factor-1 alpha (HIF-1ɑ) (1:500, sc-10790) were purchased from Santa Cruz Biotechnology (Santa Cruz Biotechnology, Dallas, Texas, United States); antibody against glutathione peroxidase 4 (GPX4) (1:1000, ab19534) was purchased from Abcam (Abcam, Cambridge, UK), while antibodies against mechanistic target of rapamycin complex 1 (mTORC1) (1:500, 2972s), phosphorylated mTORC1 (p-mTORC1) (1:500, 5536s), microtubule associated protein 1 light chain 3B (LC3B) (1:500, #2775) and iron regulatory protein 1 (IRP1) (1:1000, 20272) were obtained from Cell Signaling Technology (Danvers, Massachusetts, United States). Membranes were washed for 30' and then incubated for 1h at room temperature with peroxidase-conjugated secondary antibodies (Peroxidase AffiniPure Sheep Anti-Mouse IgG, 1:10,000; Peroxidase AffiniPure Donkey Anti-Rabbit IgG, 1:10,000; Peroxidase AffiniPure Donkey Anti-Goat IgG, 1:10,000; Jackson ImmunoResearch Europe Ltd). Signals were detected using chemiluminescence reagents (ECL Western blotting detection system, Santa Cruz Biotechnology, Dallas, Texas) and acquired by Uvitec Alliance Mini HD9 (Uvitec Cambridge, United Kingdom). To calculate the relative expression of specific protein a mouse monoclonal IgG glyceraldehyde 3-phosphate dehydrogenase (GAPDH) HRP (1:3000; sc-47724) serves as references for sample loading. The protein band intensity on western blots was quantified and normalized to that of GAPDH by using ImageJ software.
Transmission Electron Microscopy (TEM) for Ultrastructural Morphological Changes
CAL27 and SCC154 cells (2×10⁶ cells/well), either untreated or exposed to CdCl2, were centrifuged, and the resulting pellets were fixed for 3h in 3% glutaraldehyde prepared in 0.1M phosphate buffer (pH 7.4). Sample were rinsed in PBS for 15'and post-fixed in osmium tetroxide (1%) for 2h. Dehydration was performed through a graded acetone series, followed by progressive infiltration with acetone/resin mixtures and final embedding in pure Araldite resin (Fluka). Ultrathin sections (60-90 nm in thickness) were obtained using a diamond knife, mounted on copper grids (G300 Cu), and analyzed using a Jeol JEM 1400-Plus electron microscope operating at 80kV (40).
Live-cell imaging of intracellular LIP
FerroOrange, a fluorescent probe selectively binds ferrous iron ions, was used to detect the LIP in live cells. CAL27 and SCC154 cells were seeded and treated as required. Subsequently, cells were incubated with 1μmol/L FerroOrange for 30' at 37°C. Fluorescence intensity was acquired using the Leica THUNDER Imaging Systems DMi8 (Leica Microsystems S.r.l., Wetzlar, Germany) following 12h of CdCl2 exposure. Each experiment was conducted in triplicate.
Measurement of mitochondrial membrane potential and mitochondrial ROS
Changes in mitochondrial membrane potential (ΔѰm) and mitochondrial ROS (mitoROS) production were measured by staining cells with TMRM (tetramethylrhodamine ethyl ester) dye (Thermo Fisher Scientific, Waltham, USA) and MitoSOX Red Mitochondrial Superoxide Indicator (Thermo Fisher Scientific Inc.), respectively. Upon treatments, cells were incubated with 5µM MitoSOX Red for 10' at 37°C for mitoROS detection, and with 100nM TMRE dye for 30' at 37°C for ΔѰm analysis. Cells were washed with PBS, centrifuged at 1000 r.p.m. for 3' and pellets were resuspended in 500μl of PBS. The analysis was performed through a FACS BD LSRFortessaTM X-20 cytofluorometer (BD Biosciences, San Jose, CA, United States). A minimum of 2×10⁵ cells was analyzed per condition. Fluorescence was measured using FlowJo™ v10 Software (BD Biosciences, San Jose, CA). Experiments were performed at least three times on independent biological replicates.
Lipid peroxidation analysis
Lipid peroxidation was investigated through flow cytometry using BODIPY™ 581/591C11 dye (Thermo Fisher Scientific, Waltham, United States). Briefly, cells were incubated at 37°C for 30' with 2.5µM BODIPY™ 581/591C11; unincorporated dye was removed by washing twice with PBS. Oxidation of BODIPY-C11 resulted in a shift of the fluorescence emission peak from ∼590 nm to ∼510 nm proportional to lipid ROS generation. Flow cytometry assay was performed using the BD LSRFortessa™ X-20 (BD Biosciences, San Jose, CA, United States). A minimum of 2×10⁵ cells was analyzed per condition. Data analysis was carried out using FlowJo™ v10 Software (BD Biosciences, San Jose, CA). Each experiment was performed in triplicate.
Immunofluorescence
Cells were cultured on cover slip and treated with or without CdCl2. Then, cells were fixed with 4% paraformaldehyde (Sigma Aldrich) and permeabilized with Triton-X-100 (41). Actin filaments were stained with Alexa Fluor® 488 phalloidin (or Alexa Fluor® 555 phalloidin) (1:400, Molecular Probes, Life Technologies), while GSH was recognized with monoclonal antibody (10 µg/ml DITTA) followed by Alexa Fluor 488 (or Alexa Fluor 555) anti-mouse antibody (Molecular Probes, Thermo Fisher Scientific). Finally, cell DNA was stained with Hoechst 33258 (1µg/ml, Molecular Probes, Thermo Fisher Scientific) and observed with a Leica Stellaris confocal microscopy system (40×, 63× or 100× objective) at 1024 × 1024 resolution pixel (42).
Inductively coupled mass spectrometer (ICP-MS) for Fe and Cd intracellular quantification
The analysis of microelements Fe and Cd in cell pellets was carried out using an ICP-MS iCAP RQ, (Thermo Fisher Scientific Inc., Bremen, Germany), equipped with a peristaltic pump and a CETAC ASX-520 auto-sampler (Thermo Scientific, Omaha, NE, USA), operating with argon gas of spectral purity (99.9995%). A tuning solution (iCAP Q/RQ Tune aqueous multielement standard solution, Thermo Scientific Bremen, Germany) was used daily to achieve mass calibration, and to maximize instrument sensitivity, resolution and ion signals, thus optimizing torch position, ion lenses, gas output, resolution axis and background. The optimal parameters are shown in Table 1.
Operating conditions and acquisition parameters for ICP-MS
| Parameter | Setting |
|---|---|
| RF power (W) | 500-1700 |
| Reflected power | < 10 |
| Plasma gas flow (L min-1) | 15 |
| Nebulizer gas flow (L min-1) | 1,00 |
| Auxiliary gas flow (L min-1) | 0,80 |
| He mode | collision cell mode |
| He gas flow (ml min-1) | 5,00 |
| Octopole bias (CCT bias) (V) | -21 |
| Quadrupole bias (pole bias) (V) | -18 |
Ultrapure water was obtained from a Milli-Q Integral 5 system (Millipore, Merck KGaA, Darmstadt, Germany). Nitric acid (HNO3, ≥69.0 TraceSELECT)) was purchased from Fluka analytical (Germany). Cd determination was performed by using a multielement ICP-MS calibration standards solution (IMS-102), containing 10µg mL-1 of As, Be, Cd, Co, Li, Ni, Se, Sr, V (Agilent, Santa Clara, California, USA). Single element analytical standards of Fe and Ca, containing 1000 µg mL-1 of each element, were purchased from Ultra Scientific Italia (Zedelgem, Belgium).
Sample mineralization was performed using an Anton Paar Multiwave 5000 digestion system equipped with a XF100 rotor, as reported by Cosco et al. (43) with some modifications. A preliminary cleaning step of PTFE vessels was carried out by adding 4mL of HNO3 and 4 ml of H2O, maintained at 1100W for 15min (44). Cell pellets were re-suspended in 5mL of ultrapure water, transferred to the vessels and digested with 3mL of nitric acid. The microwave digestion was achieved with the following operating conditions: up to 800W in 15min, hold at this power for 10 min. The mineralized samples were then collected into a graduated polypropylene test tube, diluted up to 10mL with ultrapure water, and stored at 4°C until analysis. External calibration curves were used for the microelement's quantification.
Transferrin Receptor (CD71) and NCOA4 transient knockdown
CAL27 and SCC154 cells were transfected using Lipofectamine™ 3000 Transfection Reagent (Thermo Fisher Scientific, Waltham, MA, United States) according to the manufacturer's protocol. CD71 and NCOA4 siRNAs were purchased from Thermo Fisher Scientific. To ensure an optimal control, cells were further transfected with Silencer™ Select Negative Control siRNA (ctrl) (Thermo Fisher Scientific, Waltham, MA, United States). The transfection efficiency was evaluated by using qRT-PCR.
RNA isolation and comparative qRT-PCR analysis
Total RNA extraction was obtained through the Trizol RNA isolation method (Life Technologies, Carlsbad, California, United States) as previously described (45-48). All samples were DNase treated (Thermo Fisher Scientific, Waltham, Massachusetts, United States) and purity/integrity check was performed spectroscopically before use (49). Then, 1µg of total RNA was retrotranscribed using Applied Biosystems™ High-Capacity cDNA Reverse Transcription Kit (Thermo Fisher Scientific, Waltham, Massachusetts, United States). qRT-PCR was performed using the SYBR™ Green qPCR Master Mix (Thermo Fisher Scientific, Waltham, Massachusetts, United States). Analysis was performed on Applied Biosystems™ QuantStudio™ 3 (Thermo Fisher Scientific, Waltham, Massachusetts, United States). The relative mRNA expression levels were calculated through the 2-ΔΔCT method and GAPDH was used as the housekeeping gene. Each experiment was performed in triplicate. Primers used for qRT-PCR are as follows: FtH1 (FW: 5'-CATCAACCGCCAGATCAAC-3', REV: 5'-GATGGCTTTCACCTGCTCA-3'); GPX4 (FW: 5'-ATCGACGGGCACATGGTTAA-3', REV: 5'-CGACGAGCTGAGTGTAGTTT-3'); MT2A (FW: 5'-CCTCCTCCAAGTCCCAGC-3', REV: 5'-CAGCAGCTTTTCTTGCAGGA-3'); HMOX1 (FW: 5'-CTTTCAGAAGGGCCAGGTGA-3', REV: 5'-CTTCACATAGCGCTGCATGG-3'); CD71 (FW: 5′-TGCTGCTTTCCCTTTCCTTG-3′, REV: 5′-GCTCGTGCCACTTTGTTCAA-3′); NCOA4 (FW: 5'-TGGAGCTTGCTATTGGTGGA-3', REV: 5'-CTGAGCCTGCTGTTGAAGTG-3'); GADPH (FW: 5′-CAAATTCCATGGCACCGTCA-3′, REV: 5′-GGCAGAGATGATGACCCTTT-3′).
Surface CD71 analysis
Cells were incubated with an anti-CD71 antibody (anti-human CD71-PE, Catalog No. 130-099-219, Miltenyi Biotec) for 30 minutes in the dark. Following two washes with PBS (1X), cells were acquired using a BD LSRFortessaTM X-20 flow cytometer (BD Biosciences). Data analysis was performed using FlowJo™ v10 Software (BD Biosciences, San Jose, CA). Three independent experiments were carried out.
Liquid chromatography tandem mass spectrometry (LC-MS/MS) analysis
All chemicals used in the experiments described in this section were purchased from Sigma- Aldrich unless otherwise specified. One hundred micrograms of protein extracts were diluted with RIPA buffer (150 mM NaCl, 1% Triton, 0,5% Sodium Deoxycolate, 50 mM Tris-HCl pH 8) to achieve an equal starting protein concentration (1 μg/μL) for both conditions. Subsequently, reduction and alkylation of disulfide bonds was performed by sequential addition of, respectively, 10 μL of 100 mM dithiothreitol (DDT) and 12 μL of 200 mM iodoacetamide (IAA); each step involved 1h of incubation on a Thermomixer at 37°C under gentle agitation (650 rpm). To quench residual iodoacetamide, 2 μL of 100 mM DTT was added and the reaction was allowed to proceed for 30 min at 37°C. Protein digestion was carried out according to the protein aggregation capture (PAC) protocol 1. For each tested condition, five or six technical replicates were performed. Briefly, a total of 10 μg of proteins were digested using 5 μL of MagReSyn Hydroxyl beads (100 μg of beads, Resyn Bioscienses) previously conditioned with 70% (v/v) acetonitrile (ACN). The precipitation of proteins was induced by adding pure ACN to reach a final concentration of 70% and samples were incubated in a Thermomixer at room temperature under shacking (1100 rpm) for 10 minutes. Subsequently, samples were placed on the magnetic rack and the supernatant was discarded. Beads were washed three times with 200μL of ACN and once with 200 ofμL 70% ethanol. Digestion was performed in 50 μL of 50 mM TEAB and trypsin was added at 1:50 enzyme-substrate ratio (overnight incubation at 37° C, 1100 rpm). The supernatant containing the digested peptides was harvested and beads were incubated again with 50μL of 0,1% FA (2 min at RT, 1100 rpm) to collect any residual peptides. The two supernatants were pooled together. Peptides were separated by an Easy nLC-1000 chromatographic instrument coupled to a Q- Exactive mass spectrometer (Thermo Scientific, Bremen, Germany) with a 70 min gradient time at a flow rate of 230 nl/min on a 15 cm, 75 μm i.d., in-house-made column packed with 3 μm C18 silica particles (Dr. Maisch). The gradient was generated using mobile phase A (0.1% FA, 2% ACN) and mobile phase B (0.1% FA and 80% ACN). Mobile phase B went from 4 to 24% in 35 min, from 24 to 45% in 23 min and from 45 to 100% in 5 min; the column was cleaned for 5 min with 100% of B. The DIA method consisted in a MS1 scan of 370-900 m/z at resolution of 70 000, an AGC target of 1e6 and maximum injection time of 50 ms, followed by 20 sequential MS2 windows acquired at 15 000 resolutions, with an AGC target of 1e6 and a maximum injection time of 60 ms. In detail, the 20 windows enclosed 4 windows with an isolation window of 30 m/z, 13 windows with an isolation window of 20 m/z and 3 windows with an isolation window of 50 m/z; the overlap for each window was equal to 1 m/z. Pathway enrichment analysis was performed using GSEABase (50) annotations and clusterProfiler (51). A Benjamini-Hochberg FDR cutoff of 0.05 was used for the analysis (52).
DNA damage evaluation
DNA damage was detected by performing the cytofluorimetric analysis of cell surface phospho-γ H2A Histone Family Member X (p-γH2AX). Briefly, cells either untreated or exposed to CdCl2, were fixed and permeabilized using the BD Cytofix/Cytoperm™ Fixation/Permeabilization Kit (Cat. No. 554714) and stained with Phospho-Histone H2A.X (Ser139) Monoclonal Antibody (CR55T33), PE, eBioscience™ (Thermo Fisher Scientific, Waltham, Massachusetts, United States, Catalog: 12-9865-42). After washing twice with PBS (1X), cells were acquired in a FACS BD LSRFortessaTM X-20 cytofluorometer (BD Biosciences). Data were analyzed using FlowJo™ v10 Software (BD Biosciences, San Jose, CA). Three independent experiments were conducted.
Cell cycle analysis
CAL27 and SCC154 cells (1 × 10⁶) were collected after 1 and 12h of CdCl₂ treatment, then fixed dropwise in 100% ethanol under continuous vortexing and stored at 4° C overnight. The following day, cells were rehydrated with PBS for 10' at room temperature and stained with a propidium iodide (PI) solution containing 50µg/mL PI (Sigma-Aldrich, St. Louis, MO, USA), 100 µg/mL DNase-free RNase A (Calbiochem, La Jolla, CA), and 0.01% NP-40 (USB, Cleveland, OH) in PBS. After 60' of incubation at room temperature, samples were analyzed by flow cytometry using the BD LSRFortessa™ X-20 (BD Biosciences, San Jose, CA). Data were processed with FlowJo™ v10 Software (BD Biosciences, San Jose, CA). All experiments were performed in triplicate.
Statistics
All data were analyzed using GraphPad Prism version 10 (GraphPad Software, San Diego, CA, USA). Comparisons between two groups were performed using the unpaired Student's t test, while differences among multiple groups were assessed using by one-way ANOVA. A p-value < 0.05 was considered statistically significant. Data-Independent Acquisition (DIA) mass spectrometric data were analyzed in library-free mode by Spectronaut software, (Biognosys, version 18.4) using the default settings 2. The raw data were searched against the human database (79,684 sequences downloaded on 30 May 2022). The report output was imported in Perseus (version 2.0.6.0, Max-Planck-Gesellschaft, München) to perform statistical analysis 1. In detail, protein intensity values were transformed in the logarithmic scale (log2); only proteins quantified in at least four replicates of at least one sample group were kept, while missing values were imputed using default settings (width of 0.3 SD; down shift of 1.8 SD). Differentially abundant proteins between two conditions were detected by Student's t-test corrected for multiple hypothesis testing with a Permutation-based FDR equal to 0.05. An S0 value of 0.2 was used.
Results
Ferroptosis and autophagy contribute to CdCl2- induced cytotoxicity in OSCC cells derived from never-smokers
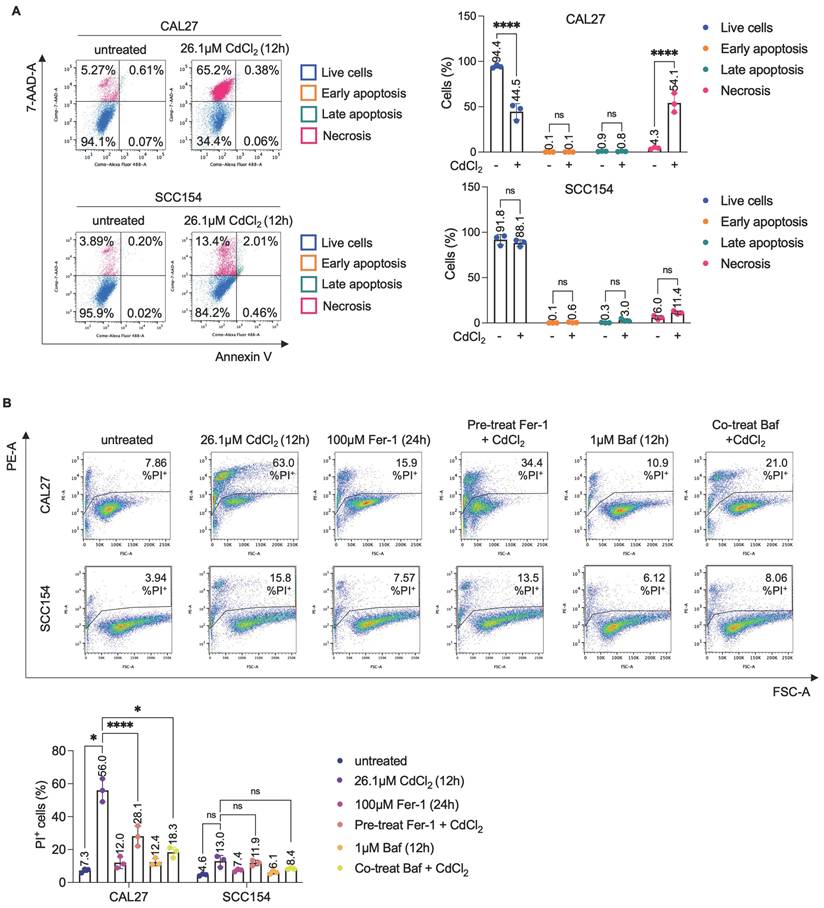
Cd2+ exerts cytotoxic effects in cancer cells through multiple pathways, which vary according to exposure conditions - including dose, duration, and cell type specificity (9,53). Here, to investigate the impact of CdCl2 in OSCC, we evaluated cell viability in a panel of four OSCC cell lines: CAL27, and OT1109 (derived from never-smoker patients), SCC090 and SCC154 (derived from smokers). Dose-response analyses revealed a marked sensitivity of CAL27 and OT1109 cells to CdCl2 exposure (0.1 μM to 100 μM, for 12 hours), with calculated IC50 values of 26.1 μM and 74 μM, respectively. Conversely, SCC090 and SCC154 cells exhibited higher tolerance to CdCl2 administration across the tested concentrations (Figure S1A). To elucidate the mode of cell death induced by CdCl2, we initially performed Annexin V/PI flow cytometry analysis. This assay excluded the involvement of apoptotic events, as no significant increase in Annexin V+ cells was observed following CdCl₂ treatment (Figure 1A). Then, we explored the contribution of ferroptosis and autophagy - two established forms of regulated cell death linked to oxidative stress. Pre-treatment with the ferroptosis inhibitor ferrostatin-1 (Fer-1) (100μM, 24h) or the autophagy inhibitor Bafilomycin A1 (Baf) (1μM, 12h) significantly reduced CdCl2-induced cytotoxicity in CAL27 cells, selected as representative of CdCl2- sensitive OSCC cell line, as evidenced by a decreased percentage of PI+ cells (Figure 1B). The protective effect of Fer-1 and Baf was not observed in SCC154 cells, a CdCl2- tolerant OSCC model. Furthermore, in these cells a dose- and time-dependent CdCl₂ treatment did not elicit pro-oncogenic effects, neither in terms of enhanced cell proliferation nor increased migratory capacity (Figure S1B-C). Collectively, these results demonstrate that CdCl₂ selectively induces cytotoxicity in OSCC cells from never-smoker patients, through mechanisms involving ferroptosis and autophagy activation.
Citotoxicity induced by CdCl2 is reversed by the ferroptosis and autophagy inhibitors, Fer-1 and Baf, only in CAL27 cells. (A) Representative plots of Annexin V/7-AAD apoptosis assay (left) and relative histograms (right) of CAL27 and SCC154 cells upon treatment with 26.01μM CdCl2 (12h). (B) PI flow cytometry assay and relative histograms of CAL27 and SCC154 cells treated with CdCl2 (26.01μM for 12h) alone or in combination with Fer-1 (100μM for 24h) and Baf (1μM for 12h). % of dead cells (PI positive) are reported in each dot plot. All data represent the mean of three independent experiments. Histograms are reported as mean ± SD. p-value: *≤0.05; ****≤0.0001. ns: not significant.
CdCl2 triggers NCOA4-mediated ferritinophagy in OSCC cells derived from never-smokers
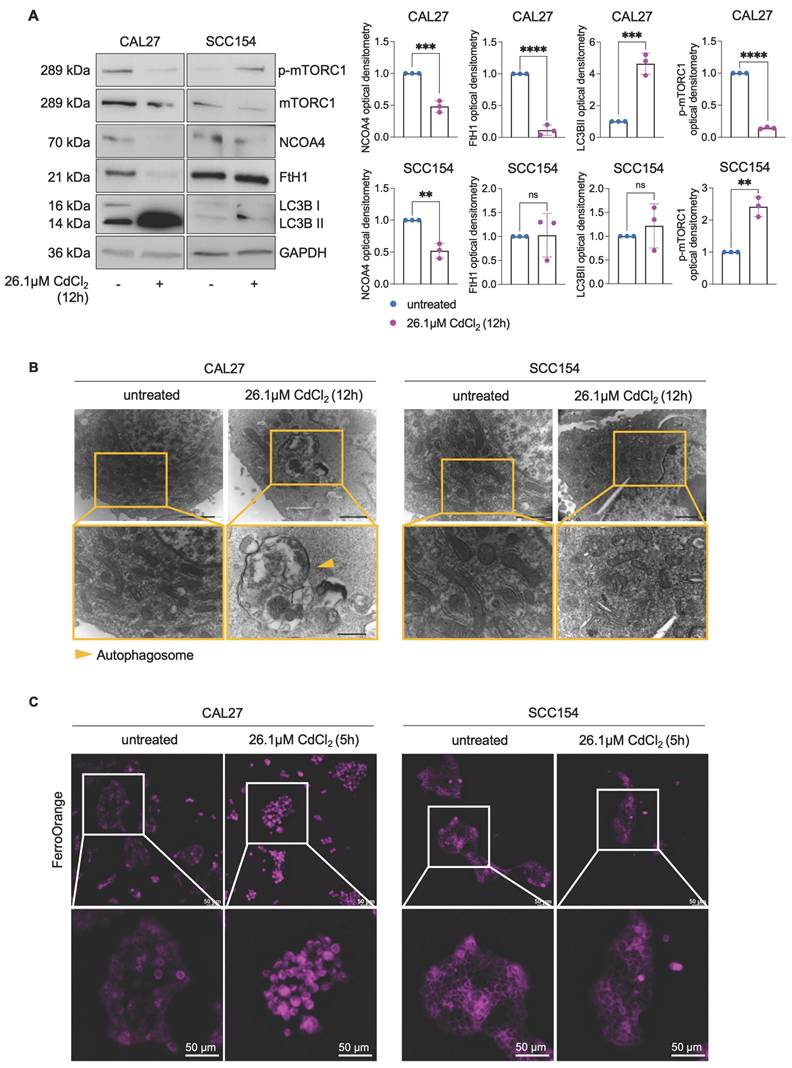
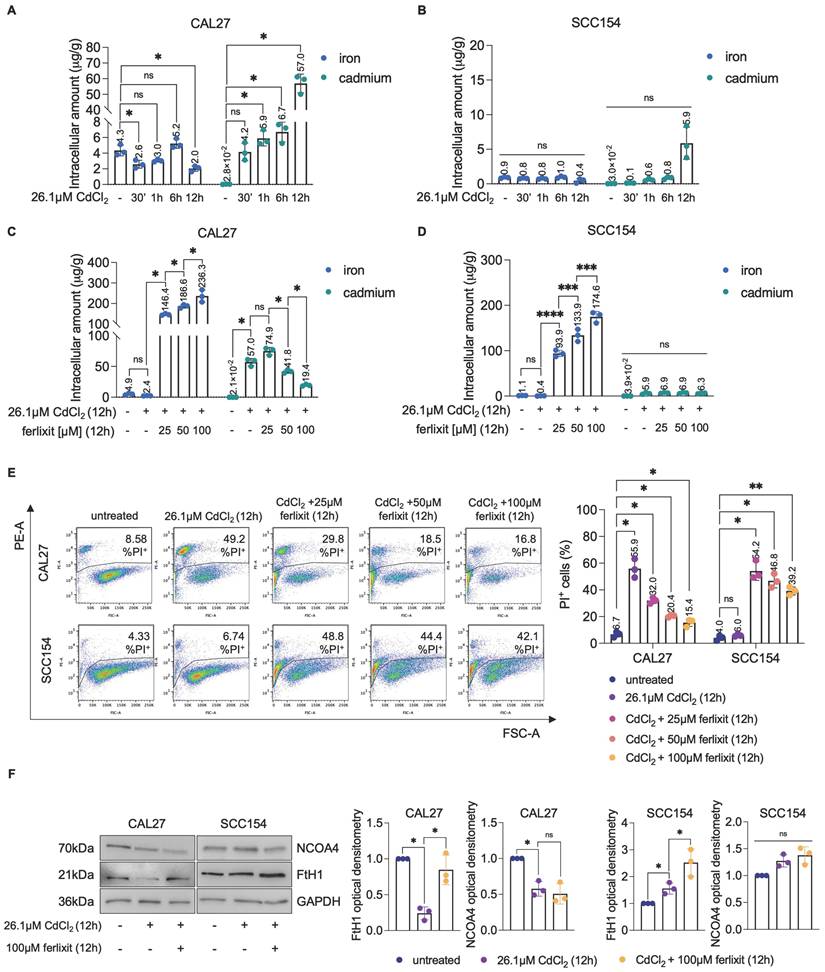
Autophagy plays a pivotal role in the execution of ferroptosis by promoting the degradation of FtH1, the main iron storage protein (54-56). This selective autophagic process, termed ferritinophagy, is orchestrated by the cargo receptor NCOA4, leading to the release of the LIP and the subsequent generation of ROS and lipid peroxidation (56,57). Whether ferritinophagy contributes to Cd2+-induced cytotoxicity in OSCC cells is still unknown. Here, we provide evidence that exposure to CdCl2 (26.1μM, 12h) markedly reduced both NCOA4 and FtH1 protein levels in CAL27. In contrast this effect was not observed in SCC154 cells, characterized by higher basal level of FtH1 compared to CAL27 cells (Figures 2A). These findings were further corroborated by the downregulation of phosphorylated mTORC1 (p-mTORC1), a master inhibitor of autophagy, coupled with the overexpression LC3B-II, a canonical marker of autophagosome formation, and the exclusive accumulation of autophagic vesicles in CAL27 cells (Figure 2A-B). Then, we monitored the real-time effect of CdCl2 on the intracellular LIP by using live-cell, time-lapse Leica THUNDER Imaging Systems DMi8 microscopy, with FerroOrange as a live fluorescent probe specific for ferrous iron (Fe2+). As shown in Movies S1-S4 and the representative frame in Figure 2C, CdCl2 exposure induced a substantial increase in the LIP after approximately 5h, which persisted for up to 8h in CAL27 cells.
CdCl2 administration induces NCOA4-mediated ferritinophagy in CAL27 cells. (A) Western blot analysis and relative optical densitometry of NCOA4, FtH1, LC3B (I-II) and mTORC1 and p-mTORC1 in CAL27 and SCC154 cells treated with 26.01μM CdCl2 (12h). GAPDH was used as normalization control for protein quantification. (B) Representative images of morphological and ultrastructural features detected by TEM in CAL27 and SCC154 upon treatment with CdCl2 (26.01μM for 12h). Yellow arrows, autophagosome. (C) Fluorescence microscopy analysis of LIP content with FerroOrange dye in CAL27 and SCC154 cells after treatment with 26.01μM CdCl2 (12h). All the experiments were carried out in triplicate. Histograms are reported as mean ± SD. p-value: **≤0.01; ***≤0.001; ****≤0.0001. ns: not significant.
Mitochondrial ROS drive ferroptosis triggered by CdCl2 in OSCC cells derived from never-smokers
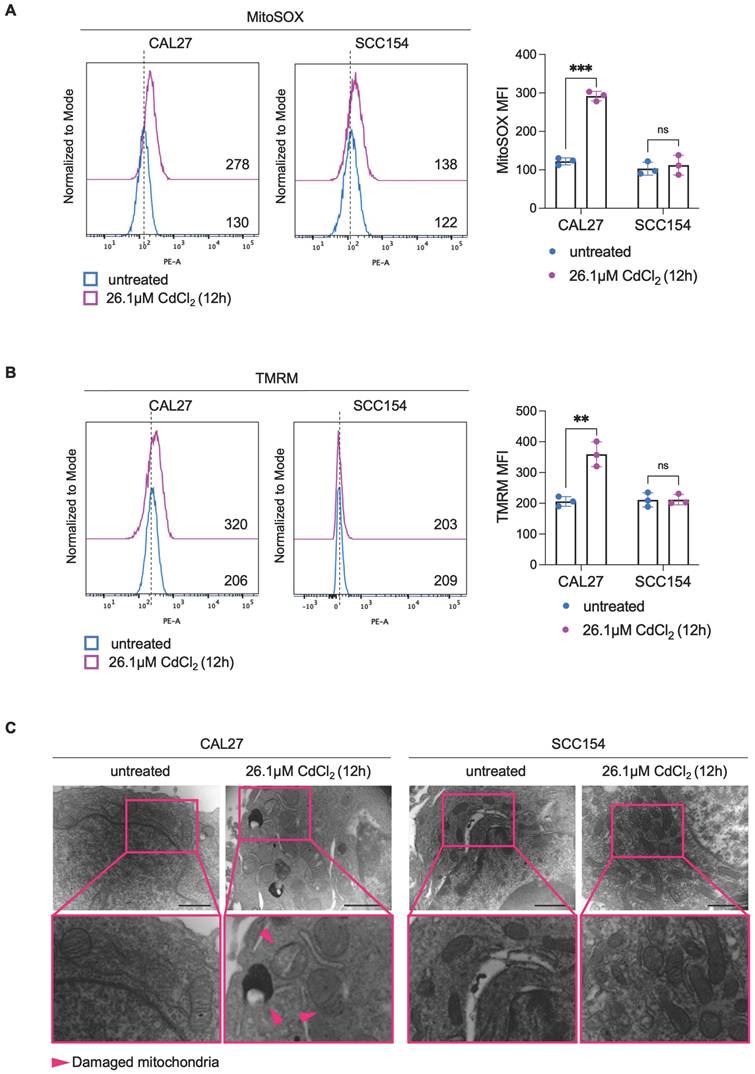
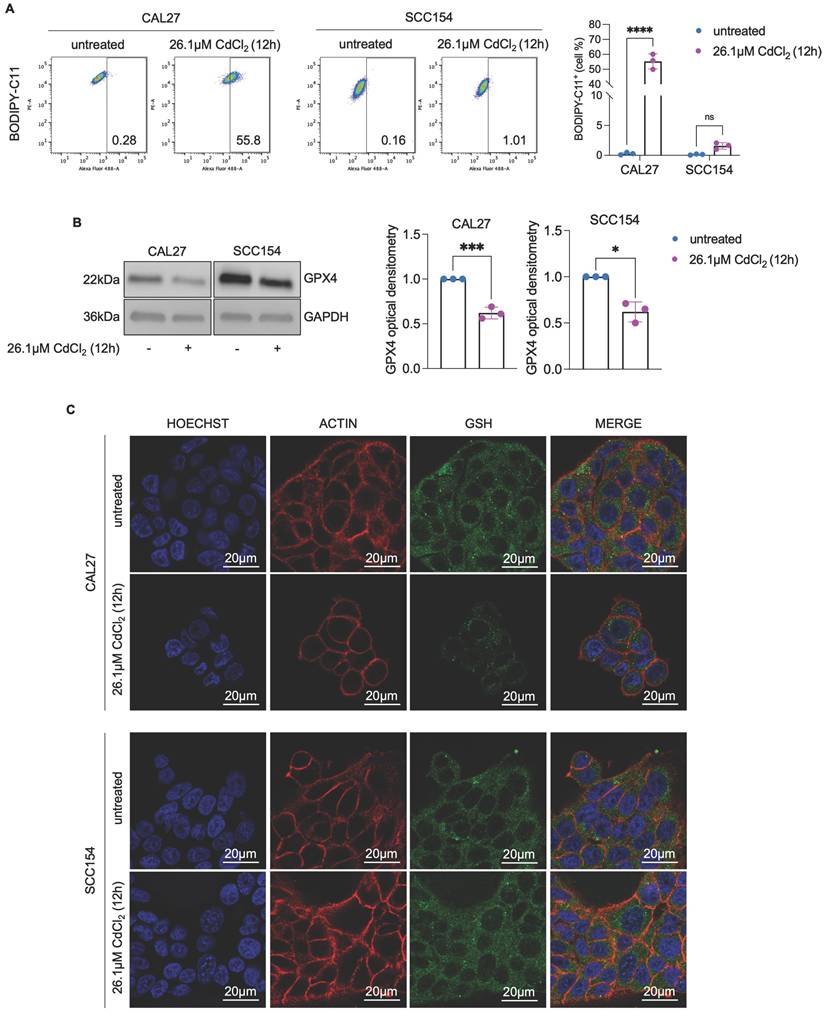
Mitochondrial metabolism and function are deeply perturbed during ferroptosis, contributing to the amplification of oxidative stress and cell death (58-60). However, whether mitoROS are implicated in Cd2+-induced ferroptosis in OSCC cells remains largely unexplored. To address this question, we first assessed mitoROS generation after treating CAL27 and SCC154 cells with 26.1 μM CdCl2 for 12h. Flow cytometry analysis using MitoSOXTM revealed that CdCl2 causes roughly a 2-fold increase in mitoROS levels in CAL27 (MFI, CAL27untreated: 130 vs. CAL2726.1μM CdCl2: 278, p-value ≤ 0.001) whereas no significant changes were observed in SCC154 cells (MFI, SCC154untreated: 122 vs. SCC15426.1μM CdCl2: 138) (Figure 3A). In agreement, we detected a marked increase in ΔѰm (TMRM MFI, CAL27untreated: 206 vs. CAL2726.1μM CdCl2: 320, p-value ≤ 0.001) along with the appearance of ultrastructural mitochondrial changes, indicative of mitochondrial dysfunction in CAL27 cells (Figure 3B-C). CdCl2 exposure strongly induced lipid peroxidation in CAL27, as demonstrated by a dramatic increase in C11-BODIPY+ cells compared to negative controls (CAL27untreated: 0.28% vs. CAL2726.1μM CdCl2: 55.8%, p-value ≤ 0.0001) (Figure 4A). This was accompanied by a downregulation of GPX4 and GSH levels (Figure 4B-C), indicating a profound impairment of the antioxidant defense system in CAL27 cells. It leaps to the eye that, as observed for FtH1, the basal levels of the antioxidant enzyme GPX4 are higher in SCC154 cells, derived from smokers, than in CAL27 derived from never-smokers. Moreover, although CdCl2 treatment led to GPX4 downregulation, GSH levels remained largely unaltered, suggesting the maintenance of the antioxidant homeostasis and a potential mechanism underlying CdCl2 tolerance in SCC154 cells. Finally, to confirm the role of ferroptosis in CdCl2-induced cell death, we examined the effect of Fer-1 and Baf on mitochondrial dysfunction and lipid peroxidation. As shown in Figure S2 and S3, Baf - but not Fer-1, effectively attenuated CdCl2-induced mitoROS production and mitochondrial membrane hyperpolarization; both Fer-1 and Baf strongly inhibited CdCl2- triggered lipid peroxidation (58,59).
CdCl2 treatment triggers mitochondrial dysfunction only in CAL27 cells. Flow cytometry analyses and relative histograms of mitochondrial ROS levels (A) and mitochondrial membrane potential (B) assessed by MitoSOX and TMRM reagents, respectively, in CAL27 and SCC154 cells following treatment with 26.01μM CdCl2 (12h). (C) Representative images of morphological and ultrastructural features detected by TEM in CAL27 and SCC154 upon treatment with CdCl2 (26.01μM for 12h). Pink arrows: damaged mitochondria. Each experiment was performed in triplicate. Histograms are presented as mean ± SD. p-value: ***≤0.001; ****≤0.0001. ns: not significant.
CAL27 cells shows lipid peroxidation after CdCl2 administration. (A) Flow cytometry analysis and relative histograms of lipid peroxidation quantified by using BODIPY-C11 in CAL27 and SCC154 cells upon treatment with 26.01μM CdCl2 (12h). (B) Western blot analysis and relative optical densitometry of GPX4 in CAL27 and SCC154 cells treated with 26.01μM CdCl2 (12h). GAPDH was used as normalization control for protein quantification. (C) Fluorescence microscopy analysis of GSH content in CAL27 and SCC154 cells after treatment with 26.01μM CdCl2 (12h). ACTIN and DAPI dyes were used to detect microfilament and nuclei, respectively. Scale bar: 20 μM. All data represent the mean of three independent experiments. Histograms are reported as mean ± SD. p-value: *≤0.05; ***≤0.001; ****≤0.0001.
Early iron depletion triggers ferritinophagy-mediated ferroptosis in CdCl2 -treated OSCC cells derived from never-smokers
A large part of Cd2+ toxicity has been attributed to its ability to compete with other essential metals, particularly iron (61,62). Cd2+ can outcompete iron during cellular uptake, leading to iron deficiency (62,63). Interestingly, ferritinophagy is considered a physiological response to cellular iron deficiency or starvation, leading to the release of large amounts of Fe2+ (64-66). Based on this evidence, we hypothesized that the NCOA4-mediated ferritinophagy observed in CAL27 cells upon 12h exposure to CdCl2 might be due to an early dysregulation of intracellular iron homeostasis. Hence, we quantified total intracellular Cd and Fe content in CAL27 and SCC154 cells at 30 min, 1h, 6h, and 12h exposure to 26.1μM CdCl2 by using ICP-MS. As shown in Figure 5A-B, although both cell lines exhibited comparable basal Cd levels (mean content, CAL27: 2.8 x 10⁻² μg/g vs SCC154: 3.0 x 10⁻² μg/g), CAL27 cells showed a pronounced and time-dependent accumulation of intracellular Cd, reaching 57.0 μg/g at 12h; conversely, intracellular Cd levels in SCC154 cells, remained substantially low, not exceeding the mean of 5.9 μg/g. Notably, as intracellular Cd levels increased, CAL27 cells underwent an early intracellular Fe depletion at 30 min (mean content, 4.3μg/g vs 2.6μg/g, p-value ≤ 0.05), followed by a transient recovery at 6h (mean content, 5.2μg/g), and a subsequent reduction at 12h (mean content, 2.0 μg/g). No significant changes in total intracellular Fe levels were observed in SCC154 cells (Figures 5A-B). These findings highlighted a striking difference in Cd accumulation capacity between the two OSCC cell lines and suggested that Cd2+ competes with Fe in CAL27 but not in SCC154 cells. To validate this hypothesis, we co-treated CAL27 and SCC154 cells with CdCl2 and increasing concentrations of ferlixit (Fe3+, 25μM, 50 μM, 100 μM) for 12h. Notably, in CAL27 cells, ferlixit supplementation resulted in a dose-dependent reduction of intracellular Cd (mean Cd content, CAL27CdCl2+25μMferlixit: 74.9μg/g, CAL27CdCl2+50μMferlixit: 41.8μg/g, CAL27CdCl2+100μMferlixit: 19.4μg/g, p-value ≤ 0.05; mean Fe content, CAL27CdCl2+25μMferlixit: 146.4μg/g, CAL27CdCl2+50μMferlixit: 186.6μg/g, CAL27CdCl2+100μMferlixit: 236.3μg/g, p-value ≤ 0.05) (Figures 5C) and a consequent reduction of cell death (Figure 5E). In contrast, in SCC154, iron supplementation did not alter intracellular Cd levels, but rather caused roughly 40-50% mortality (Figure 5D-E). Besides, ferlixit prevented the activation of ferritinophagy in CAL27 cells, as evidenced by the decrease of NCOA4 and the concomitant restoration of FtH1 (Figure 5F). Then, to assess the role of ferritinophagy in CdCl2-induced ferroptosis, we performed a transient knockdown of NCOA4 (Figure S4A). As reported in Figure S4B-C, although NCOA4 silencing restored FtH1 levels of CAL27 cells treated with CdCl2, it did not result in any significant change in cell death rates. This lack of effect can likely be attributed to a compensatory mechanism activated by CAL27 cells in response to iron depletion, involving the activation of IRP1 and the subsequent upregulation of the major iron uptake protein, CD71 (Figure S4B). Diversely, we found that transiently knocking down CD71 and blocking Fe intake exacerbated the cytotoxic effects of CdCl2 at 12h in CAL27 cells (Figure S4D-E). Collectively, these findings demonstrate a differential capacity for Cd accumulation between CAL27 and SCC154 cells; it appears that Cd outcompete Fe, leading to early iron depletion that may serve as the initiating trigger for ferritinophagy-mediated ferroptosis in OSCC cells derived from never-smokers.
CdCl2 citotoxicity is associated with the ability of cadmium to compete with iron. (A-B). Quantification of iron and cadmium intracellular amount through ICP-MS in CAL27 and SCC154 cells treated with 26.01μM CdCl2 at 30', 1h, 6h, and 12h. (C-D). ICP-MS analysis of iron and cadmium intracellular amount in CAL27 and SCC154 cells upon treatment with 26.01μM CdCl2 (12h) alone or in combination with ferlixit (25, 50 and 100μM for 12h). (E) PI flow cytometry assay and relative histograms of CAL27 and SCC154 cells treated with CdCl2 (26.01μM for 12h) alone or in combination with ferlixit (25, 50 and 100 μM for 12h). % of dead cells (PI positive) are reported in each dot plot. (F) Western blot analysis and relative optical densitometry of NCOA4 and FtH1 in CAL27 and SCC154 cells treated with 26.01μM CdCl2 (12h) alone or in combination with 100μM ferlixit (12h). GAPDH was used as normalization control for protein quantification. All data represent the mean of three independent experiments. Histograms are reported as mean ± SD. p-value: *≤0.05; **≤0.01; ***≤0.001; ****≤0.0001. ns: not significant.
Proteomic analysis reveals altered expression of proteins involved in iron homeostasis, hypoxia, and cell death in CdCl2 - treated OSCC cells derived from never-smokers
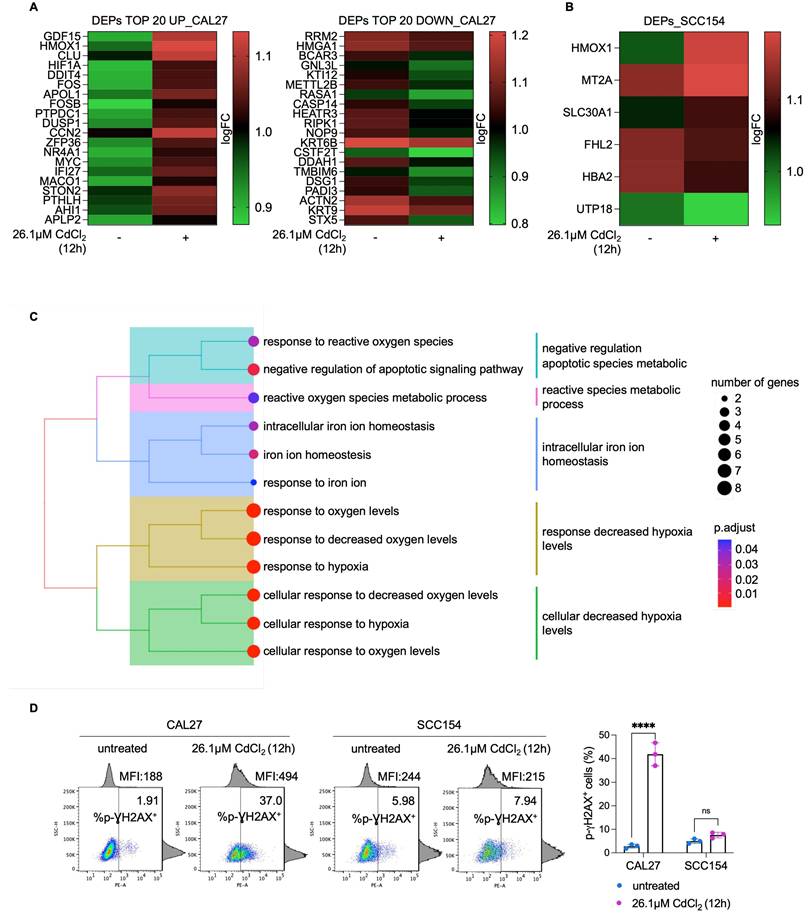
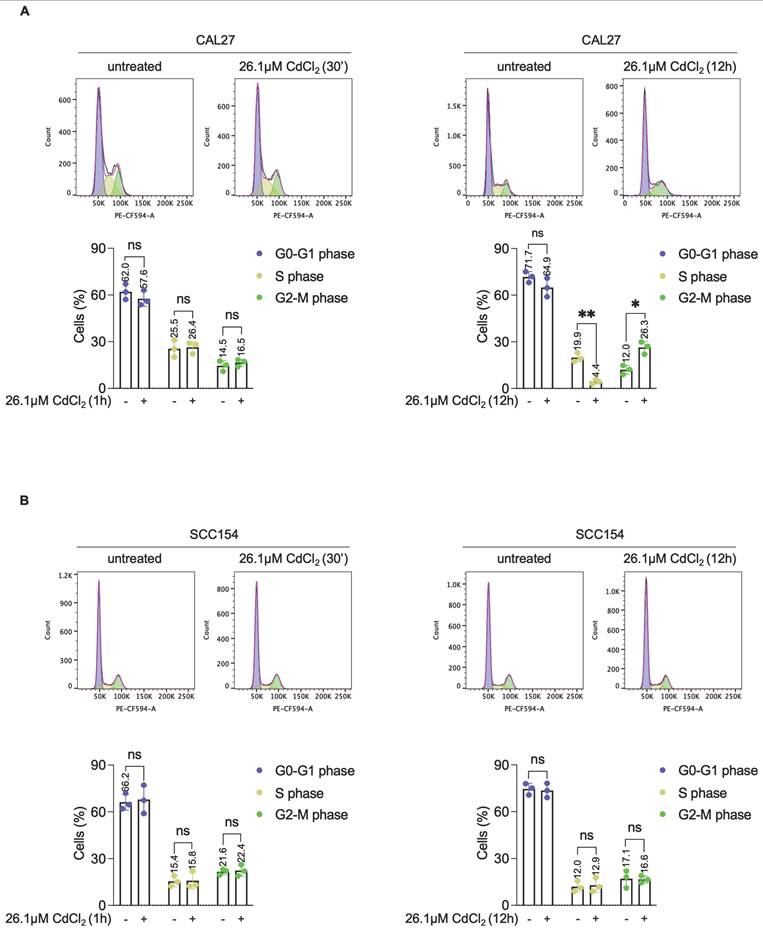
To elucidate the molecular mechanisms underlying the differential sensitivity and tolerance to Cd2+ between CAL27 and SCC154 OSCC cell lines, we performed a comparative proteomic analysis following 12h exposure to 26.1μM CdCl2. A total of 222 differentially expressed proteins (DEPs) were identified in CdCl2-treated CAL27 cells compared to untreated controls, with 90 upregulated and 132 downregulated proteins (FDR: 0.05) (Figure 6A; File S1). GSEA of the top 20 upregulated and the top 20 downregulated proteins in CAL27 cells revealed significant enrichment of biological processes related to response to reactive oxygen species, cellular response to hypoxia, intracellular iron ion homeostasis, and negative regulation of apoptotic signaling pathway (Figure 6C). In contrast, the number of DEPs identified in CdCl2-treated SCC154 cells compared to controls was limited to six; these included three upregulated proteins - heme oxygenase 1 (HMOX1), solute carrier family 30 member 1 (SLC30A1), and MT2A - and three downregulated proteins - Four and A Half LIM Domains 2 (FHL2), UTP18 Small Subunit Processome Component (UTP18), Hemoglobin Subunit Alpha 2 (HBA2) (FDR: 0.05) (Figure 6B). Gene Ontology of these DEPs in SCC154 cells showed significant enrichment for pathways involved in response to cadmium ion and detoxification of inorganic compounds (Table S1). Among the top 20 downregulated proteins in CAL27 cells was the iron-dependent ribonucleotide reductase M2 (RRM2), a key enzyme involved in DNA synthesis. RRM2 suppression is consistent with iron depletion and was accompanied by upregulation of hypoxia inducible factor-1 alpha (HIF-1α), a known sensor of cellular iron and oxygen levels. Given that RRM2 suppression is associated with impaired DNA repair and genome instability (67,68), we hypothesized that CdCl2-induced iron depletion might contribute to DNA damage in CAL27 cells. Supporting this hypothesis, flow cytometry assays revealed a marked increase in the percentage of pγ-H2AX+ CAL27 cells (mean %, CAL27untreated: 1.91 vs. CAL2726.1μM CdCl2: 37.0) following 12h treatment with CdCl2 treatment (Figure 6D). Notably, this was accompanied by a significant reduction of S-phase (mean %, CAL27untreated: 19.9 vs. CAL2726.1μM CdCl2: 4.4) and an accumulation of G2-phase CAL27 population (mean %, CAL27untreated: 12.0 vs. CAL2726.1μM CdCl2: 26.3) (Figure 7A). These effects were not observed in SCC154 cells (Figure 6D, Figure 7B).
Proteomic analysis of OSCC cells treated with CdCl2. (A) Heatmap of DEPs (TOP 20 up and TOP 20 down) in CAL27 cells treated with 26.01μM CdCl2 (12h) vs untreated. Color intensity is proportional to the magnitude of changes. Relative expression levels are shown in red (upregulation) and green (downregulation). (B) Heatmap of DEPs in SCC154 cells treated with 26.01μM CdCl2 (12h) vs untreated. Color intensity is proportional to the magnitude of changes. Relative expression levels are shown in red (upregulation) and green (downregulation). (C) GO analysis of of DEPs in CAL27 cells treated with 26.01μM CdCl2 (12h) vs untreated. The dot size denotes the number of DEPs, while colors correspond to the adjusted p-value range. (D) p-ƔH2AX flow cytometry analysis and relative histograms CAL27 and SCC154 cells treated with CdCl2 (26.01μM for 12h). % of positive (+) cells are reported in each dot plot. Each experiment was performed in triplicate. Histograms are presented as mean ± SD. p-value: ****≤0.0001. ns: not significant.
CdCl2 exposure induces G2-M phase arrest in CAL27 cells derived from never smokers. Cell cycle analysis via flow cytometry and relative histograms of CAL27 (A) and SCC154 (B) cells treated with 26.01μM CdCl2 for 1h and 12h. Each experiment was performed in triplicate. Histograms are presented as mean ± SD. p-value: *≤0.05; **≤0.01. ns: not significant.
Chronic exposure to CdCl2 induces adaptive tolerance in CAL27 cells
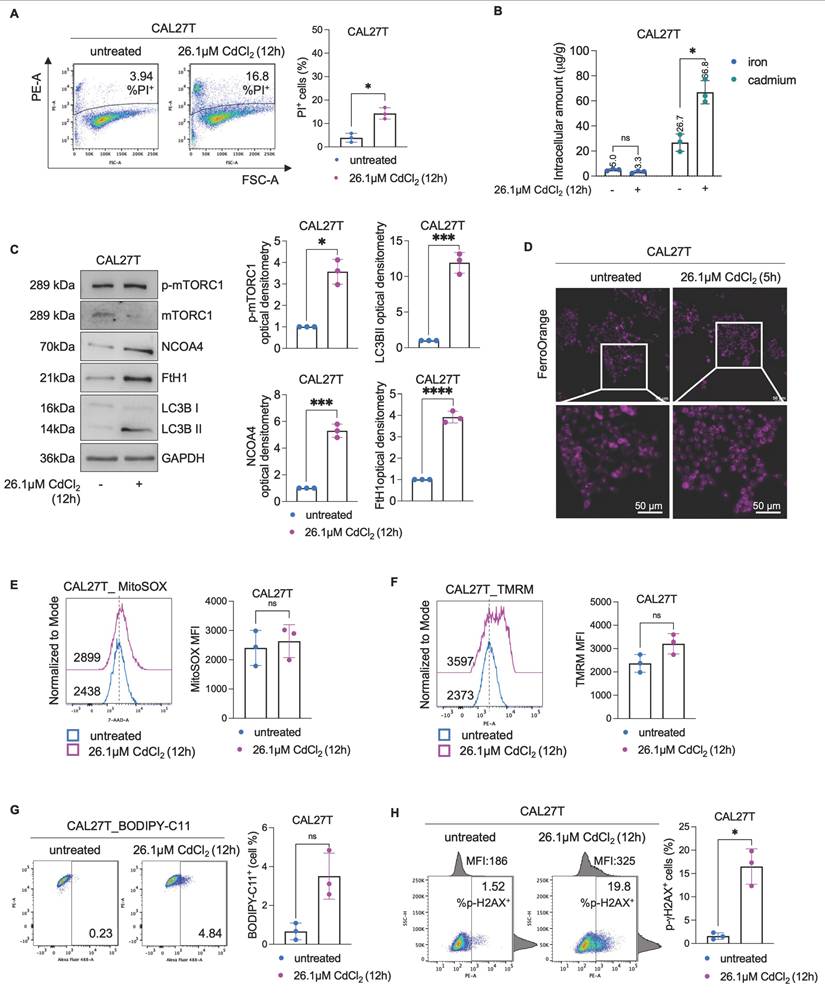
To investigate whether the prolonged exposure to low doses of Cd2+ can activate adaptive mechanisms promoting tolerance - as observed in SCC154 cells derived from a smoker patient -CAL27 cells were chronically exposed to 10 μM CdCl2 for 30 days (hereafter referred to as CAL27T). Following this treatment, CAL27T cells were exposed to 26.1μM CdCl2 for 12h. Noteworthy, the percentage of PI+ CAL27T cells was only 3.94% under basal condition and did not exceed 16.8% upon acute CdCl2 poisoning (Figure 8A). The capacity of CAL27T cells to accumulate Cd was also remarkably reduced. While the baseline intracellular Cd content was 26.7μg/g, Cd accumulation after 26.1μM CdCl2 exposure increased less than 3-fold reaching 66.8 μg/g. Furthermore, no variation in total intracellular iron levels was detected, suggesting the preservation of iron homeostasis (Figure 8B). Consistent with these findings, no evidence of ferritinophagy activation was observed in CAL27T cells. Although a slight increase in LC3BII levels was detected, markers of suppressed autophagy and restored iron storage, including p-mTORC1, NCOA4 and FTH1 protein levels, were all upregulated (Figure 8C). Moreover, the LIP, measured after 5h CdCl2 exposure (the time point at which LIP accumulation became evident in parental CAL27 cells), remained stable up to 12h (Figure 8D, Movies S5-6). In line with the attenuated iron dysregulation, HIF-1α remained unaltered (Figure S5), only slight increase in mitoROS production and ΔѰm variation were observed (Figures 8E-F), and lipid peroxidation remained limited to 4.84% (Figure 8G). Finally, the extent of DNA damage in CAL27T reached a maximum of 19.8%, corresponding to approximately half of that detected in their parental CdCl2- sensitive counterparts (Figure 8H).
Effects of CdCl2 exposure in CAL27T cells. To obtain CAL27T (CAL27 Tolerant to Cd) CAL27 were exposed to low doses of CdCl2 (10μM) for 30 days. (A) PI flow cytometry assay and relative histograms of CAL27T cells treated with CdCl2 (26.01μM for 12h). % of dead cells (PI positive) are reported in each dot plot. (B) Quantification of iron and cadmium intracellular amount through ICP-MS in CAL27T cells treated with 26.01μM CdCl2 (12h). (C) Western blot analysis and relative optical densitometry of NCOA4, FtH1, LC3B (I-II), mTORC1 and p-mTORC1 in CAL27T cells treated with 26.01μM CdCl2 (12h). GAPDH was used as normalization control for protein quantification. (D) Fluorescence microscopy analysis of LIP content with FerroOrange dye in CAL27T cells after treatment with 26.01μM CdCl2 (12h). Flow cytometry analyses and relative histograms of mitochondrial ROS amount (E), mitochondrial membrane potential (F) and lipid peroxidation (G) assessed by using MitoSOX, TMRM and BODIPY-C11 reagents, respectively, in CAL27T cells following treatment with 26.01μM CdCl2 (12h). Each experiment was performed in triplicate. Histograms are presented as mean ± SD. p-value: *≤0.05; ***≤0.001; ****≤0.0001. ns: not significant.
Discussion
Oxidative stress plays a pivotal role in both Cd2+-induced toxicity and carcinogenesis. Acute Cd2+ exposure leads to enhanced production of ROS and consequent oxidative damage through multiple mechanisms, including depletion of antioxidant scavengers, interference with antioxidant enzymes, and mitochondrial dysfunction (69-71). As a result, various forms of cell death, such as necrosis, apoptotic-like cell death, autophagy, and ferroptosis, can be triggered by acute Cd2+ toxicity (72-75). In contrast, prolonged exposure to low levels of Cd2+ enables cells to activate adaptive responses, upregulating genes involved in redox homeostasis, such as HMOX1, GSH, and MTs, which mitigate oxidative stress and, at the same time, allow for a continued proliferation of damaged cells, contributing to carcinogenesis (13,24,76,77). The tipping point between adaptation and injury depends on multiple cellular and environmental factors.
In this study, we explored the effects of acute Cd2+ exposure in OSCC cells and uncovered a fascinating dichotomy: CAL27 cells (from never-smokers) are highly sensitive to Cd2+ cytotoxicity, while SCC154 cells (from smokers) exhibit a striking tolerance. This observation led us to investigate the interplay between Cd-mediated dysregulation of iron homeostasis, autophagy, and ferroptosis. The literature reports conflicting findings regarding the effects of Cd2+ in OSCC cells; Fan, T. et al. showed that repeated Cd2+ exposure promotes migration and invasion of CAL27 cells via ROS/NUPR1-dependent autophagy (36), while So, K.Y. et al. found that Cd2+ exposure reduces the catalase (CAT) expression, increases HMOX1 and triggers apoptosis in YD8 and YD10B oral cancer cells (78). Here, we found that in never-smoker-derived OSCC cells, vulnerability to Cd2+ toxicity is linked to the disruption of iron homeostasis. As a divalent metal cation, Cd2+ competes with iron for cellular uptake and utilization, potentially displacing it in key enzymes involved in respiration, metabolism, DNA synthesis and repair (79). The effects of this competition vary by cell types. In human Burkitt lymphoma BJAB cells, Cd2+ decreases intracellular free Fe2+ and cell viability (80), while in rat liver, kidney, and testicular cancer cells, Cd2+ increases LIP and promotes ROS formation via Fenton reactions (81,82). In CAL27 cells, we observed that Cd2+ first causes rapid iron depletion, followed by delayed LIP accumulation, likely via NCOA4-mediated ferritinophagy. NCOA4 acts as an autophagic receptor targeting ferritin for degradation and releasing stored iron in response to iron starvation (83-85). Importantly, iron supplementation reduces both Cd2+ accumulation and cytotoxicity, while CD71 knockdown exacerbates Cd2+-induced cell death in CAL27 cells, likely impairing iron uptake. These results align with previous findings in other systems where increased intracellular iron protects against Cd2+-induced ROS and cytotoxicity (86). While we did not directly address the mechanisms of Cd2+ accumulation in CAL27 cells, our data suggest that (61-63) competition for CD71, a primary cellular iron transporter, could play a role. Indeed, CAL27 cells express higher CD71 levels and accumulate more Cd than SCC154 cells (Figure S6A). Further studies are warranted.
Excessive ferritinophagy can trigger ferroptosis, the pioneer of the metals-induced RCD modes (65), caused by iron-dependent peroxidation of polyunsaturated fatty acids (87,88). While typically associated with iron, emerging evidence suggest that non-ferrous metals, such as Cd2+ can also induce ferroptosis by promoting ferritinophagy and iron overload (89-92). Here, we demonstrate that in CAL27 cells Cd2+-induced ferritinophagy leads to FtH1 degradation, increased LIP, mitochondrial ROS production, mitochondrial membrane hyperpolarization, disruption of GSH/GPX4 antioxidant system, lipid peroxidation, and ultimately ferroptosis. Interestingly, NCOA4 knockdown in CAL27 cells did not prevent CdCl2-induced cell death; instead, it activated the IRP system and upregulated CD71, potentially promoting iron uptake, and maintaining ferroptosis susceptibility. Pharmacological inhibition of lipid peroxidation by using Fer-1 reduced Cd2+-cytotoxicity but not mitochondrial dysfunction, while autophagy inhibition by Baf mitigated both lipid peroxidation and mitochondrial damage, suggesting that ferritinophagy-mediated mitoROS may be an upstream event in Cd2+-induced ferroptosis. However, contributions from other forms of autophagy cannot be excluded.
In contrast, OSCC cells derived from smokers (SCC154), display high baseline antioxidant capacity, including elevated FtH1, GPX4, MT2A, and HMOX1, consistent with chronic adaptation to Cd exposure via tobacco use. MT2A detoxifies Cd and scavenges ROS (93), while HMOX1, a stress-inducible enzyme, is upregulated in response to oxidative stress and facilitates heme degradation (78,94). Notably, both CAL27 and SCC154 upregulate HMOX1 following CdCl2 exposure, but only SCC154 cells are protected from ferroptosis, likely due to more effective antioxidant and iron-handling mechanisms. Factors such as differential regulation of ferritinophagy, GSH levels, and lipid repair pathways may contribute to the observed cell-type-specific responses. GSH levels also increase in SCC154 cells after Cd2+ exposure further supporting their enhanced resistance. Extending these observations to clinical specimens, we found that HMOX1, MT2A, and FtH1 were significantly overexpressed in OSCC tissues derived from 7 OSCC smoker patients compared to 7 OSCC never-smoker patients (Figure S6B), supporting the in vivo relevance of our findings.
CAL27T cells - generated by chronic low dose of Cd exposure, acquire tolerance to acute CdCl2 treatment, do not undergo ferritinophagy or ferroptosis, and do not show iron depletion or HIF-1α overexpression, unlike parental CAL27 cells. These data suggest that HIF-1α stabilization is not a general response to CdCl2 exposure but is instead linked to iron-dependent stress in sensitive cells, potentially contributing to Cd cytotoxicity.
Beyond immediate toxicity, our results reveal that Cd2+ exposure has long-term effects: in sensitive CAL27 cells, Cd2+-induced iron depletion and oxidative stress downregulate RRM2, reduce S-phase entry, increase G2 accumulation, and elevate γH2AX, indicating DNA damage. Given the reduced proportion of cells in S-phase, we propose this damage is not solely replication-dependent, but may arise from oxidative injury, impaired DNA repair, or checkpoint failure with significant implications for oral cancer progression.
In summary, our findings provide new insights into the mechanism of Cd2+ cytotoxicity in OSCC cells, revealing striking differences between cells from never-smokers and smokers. Sensitivity in non-smokers-derived cells is linked to autophagic ferroptosis and disrupted iron homeostasis while smokers-derived cells exhibit resistance through upregulated antioxidant defenses and metal detoxification. Chronic exposure to Cd2+, as experienced by smokers, induces adaptive responses that mitigate toxicity but may also foster cancer development through persistent cellular stress and genetic instability. These findings underscore the need to consider individual exposure histories when assessing environmental risks and highlight the importance of further studies to clarify mechanisms of Cd2+ accumulation, adaptive resistance, and long-term consequences in OSCC.
Abbreviation
ROS: reactive oxygen species; RCD: regulated cell death; Fe²⁺: iron; Cu²⁺: copper; Ca²⁺: calcium; Zn²⁺: zinc; Mn²⁺: manganese; Cd²⁺: cadmium; GSH: glutathione; IARC: international agency for research on cancer; Nrf2: nuclear factor erythroid 2-related factor 2; AP-1: activator protein 1; NF-kB: nuclear factor-kB; MAPKs: mitogen-activated protein kinases; OSCC: oral squamous cell carcinoma; HNSCC: head and neck squamous cell carcinoma; MT2A: metallothionein 2A; NCOA4: nuclear receptor coactivator 4; FBS: fetal bovine serum; CdCl2: cadmium chloride; Fer-1: ferrostatin-1; Baf: bafilomycin; CAL27T: CAL27 tolerant; PI: iodide propidium; FtH1: ferritin heavy subunit; GPX4: glutathione peroxidase 4; MFRN1: mitoferrin 1; mTORC1: mechanistic target of rapamycin complex 1; p-mTORC1: phosphorylated mTORC1; LC3B: microtubule associated protein 1 light chain 3B; GAPDH: glyceraldehyde 3-phosphate dehydrogenase; TEM: transmission electron microscopy; LIP: labile iron pool; ΔѰm: mitochondrial membrane potential; mitoROS: mitochondrial ROS; TMRE: tetramethylrhodamine ethyl ester; ICP-MS: inductively coupled plasma mass spectrometry; HNO3: nitric acid; CD71: transferrin receptor; LC-MS/MS: liquid chromatography tandem mass spectrometry; DDT: dithiothreitol; IAA: iodoacetamide; PAC: protein aggregation capture; CAN: acetonitrile; pγ-H2AX+: phospho-γ H2A histone family member X; DIA: data-independent acquisition; DEPs: differentially expressed proteins; HMOX1: heme oxygenase 1; SLC30A1: solute carrier family 30 member 1; FHL2: four and a half LIM domains 2; UTP18: small subunit processome component; HBA2: hemoglobin subunit alpha 2; RRM2: ribonucleotide reductase M2; HIF-1α: hypoxia inducible factor-1 alpha; NUPR1: nuclear protein 1; CAT: antioxidant enzyme catalase; IRP1: iron regulatory protein 1.
Supplementary Material
Supplementary figures and tables.
Movies S1-S6, File S1.
Acknowledgements
We thank Caterina Alessi for the technical support.
Data availability
The datasets of proteomics analysis are available as supplementary materials.
Author contributions
FSC, FB, and AMB conceived and designed the work; LP and EG acquired data; LP, EG, SBu, AA, SBo, MF, AP, LEP, AGiul, MG, GS, GF, CG, GN, AGiud, and FSC analyzed and interpreted data for the work; LP, EG, FB, and AMB drafted the work; FB and AMB revised the work critically for important intellectual content. All the authors approved the final version to be published and agreed to be accountable for all aspects of the work in ensuring that questions related to the accuracy or integrity of any part of the work are appropriately investigated and resolved.
Competing Interests
The authors have declared that no competing interest exists.
References
1. You Y, Guo Z, Wolter T, Hu Q. Intracellular metal ion-based chemistry for programmed cell death. Chem Soc Rev. 2025Feb3;54(3):1552-1582
2. Lai Y, Gao F fen, Ge R ting, Liu R, Ma S, Liu X. Metal ions overloading and cell death. Cell Biol Toxicol. 2024;40(1):1-17 Available from: https://link.springer.com/article/10.1007/s10565-024-09910-4
3. Gu J, Guo C, Ruan J, Li K, Zhou Y, Gong X. et al. From ferroptosis to cuproptosis, and calcicoptosis, to find more novel metals-mediated distinct form of regulated cell death. Apoptosis. 2024;29(5-6):586-604 Available from: https://pubmed.ncbi.nlm.nih.gov/38324163/
4. Li Y, Du Y, Zhou Y, Chen Q, Luo Z, Ren Y. et al. Iron and copper: critical executioners of ferroptosis, cuproptosis and other forms of cell death. Cell Communication and Signaling 2023 21:1. 2023;21(1):1-19 Available from: https://biosignaling.biomedcentral.com/articles/10.1186/s12964-023-01267-1
5. Dagdag O, Quadri TW, Haldhar R, Kim SC, Daoudi W, Berdimurodov E. et al. An Overview of Heavy Metal Pollution and Control. ACS Symposium Series. 2023;1456:3-24 Available from: https://pubs.acs.org/doi/full/10.1021/bk-2023-1456.ch001
6. Battaglia AM, Sacco A, Giorgio E, Petriaggi L, Elzanowska J, Cruz AR. et al. Expulsion of iron-rich ferritin via CD63-mediated exosome drives ferroptosis resistance in ovarian cancer cells. Front Cell Dev Biol. 2025;13:1532097
7. Kubier A, Wilkin RT, Pichler T. Cadmium in soils and groundwater: A review. Appl Geochem. 2019;108:1 Available from: https://pmc.ncbi.nlm.nih.gov/articles/PMC7147761/
8. Tchounwou PB, Yedjou CG, Patlolla AK, Sutton DJ. Heavy Metals Toxicity and the Environment. EXS. 2012;101:133 Available from: https://pmc.ncbi.nlm.nih.gov/articles/PMC4144270/
9. Peana M, Pelucelli A, Chasapis CT, Perlepes SP, Bekiari V, Medici S. et al. Biological Effects of Human Exposure to Environmental Cadmium. Biomolecules. 2023;13(1):36 Available from: https://www.mdpi.com/2218-273X/13/1/36/htm
10. Qu F, Zheng W. Cadmium Exposure: Mechanisms and Pathways of Toxicity and Implications for Human Health. Toxics. 2024 12(6). Available from: http://www.ncbi.nlm.nih.gov/pubmed/38922068
11. Ma Y, Su Q, Yue C, Zou H, Zhu J, Zhao H. et al. The Effect of Oxidative Stress-Induced Autophagy by Cadmium Exposure in Kidney, Liver, and Bone Damage, and Neurotoxicity. Int J Mol Sci. 2022 23(21). Available from: https://pubmed.ncbi.nlm.nih.gov/36362277/
12. Nair AR, DeGheselle O, Smeets K, Van Kerkhove E, Cuypers A. Cadmium-Induced Pathologies: Where Is the Oxidative Balance Lost (or Not)? International Journal of Molecular Sciences. 2013;14(3):6116-43 Available from: https://www.mdpi.com/1422-0067/14/3/6116/htm
13. Branca JJV, Fiorillo C, Carrino D, Paternostro F, Taddei N, Gulisano M. et al. Cadmium-Induced Oxidative Stress: Focus on the Central Nervous System. Antioxidants 2020, Vol 9, Page 492. 2020;9(6):492 Available from: https://www.mdpi.com/2076-3921/9/6/492/htm
14. Nawrot T, Plusquin M, Hogervorst J, Roels HA, Celis H, Thijs L. et al. Environmental exposure to cadmium and risk of cancer: A prospective population-based study. Lancet Oncology. 2006;7(2):119-26 Available from: http://www.thelancet.com/article/S1470204506705459/fulltext
15. Huff J, Lunn RM, Waalkes MP, Tomatis L, Infante PF. Cadmium-induced Cancers in Animals and in Humans. Int J Occup Environ Health. 2007;13(2):202 Available from: https://pmc.ncbi.nlm.nih.gov/articles/PMC3399253/
16. Hartwig A. Cadmium and cancer. Met Ions Life Sci. 2013;11:491-507 Available from: https://pubmed.ncbi.nlm.nih.gov/23430782/
17. Waalkes MP. Cadmium carcinogenesis. Mutation Research/Fundamental and Molecular Mechanisms of Mutagenesis. 2003Dec10;533(1-2):107-20
18. Agents Classified by the IARC Monographs, Volumes 1-137 - IARC Monographs on the Identification of Carcinogenic Hazards to Humans. Available from: https://monographs.iarc.who.int/agents-classified-by-the-iarc/
19. Luevano J, Damodaran C. A Review of Molecular Events of Cadmium-Induced Carcinogenesis. J Environ Pathol Toxicol Oncol. 2014;33(3):183 Available from: https://pmc.ncbi.nlm.nih.gov/articles/PMC4183964/
20. Zhu Y, Costa M. Metals and molecular carcinogenesis. Carcinogenesis. 2020;41(9):1161 Available from: https://pmc.ncbi.nlm.nih.gov/articles/PMC7513952/
21. Alhmoud JF, Woolley JF, Al Moustafa AE, Malki MI. DNA Damage/Repair Management in Cancers. Cancers (Basel). 2020;12(4):1050 Available from: https://pmc.ncbi.nlm.nih.gov/articles/PMC7226105/
22. Benbrahim-Tallaa L, Waterland RA, Dill AL, Webber MM, Waalkes MP. Tumor Suppressor Gene Inactivation during Cadmium-Induced Malignant Transformation of Human Prostate Cells Correlates with Overexpression of de Novo DNA Methyltransferase. Environ Health Perspect. 2007Oct;115(10):1454 Available from: https://pmc.ncbi.nlm.nih.gov/articles/PMC2022656/
23. He X, Chen MG, Ma Q. Activation of Nrf2 in defense against cadmium-induced oxidative stress. Chem Res Toxicol. 2008;21(7):1375-83 Available from: https://pubmed.ncbi.nlm.nih.gov/18512965/
24. Liu J, Qu W, Kadiiska MB. Role of oxidative stress in cadmium toxicity and carcinogenesis. Toxicol Appl Pharmacol. 2009;238(3):209-14 Available from: https://pubmed.ncbi.nlm.nih.gov/19236887/
25. Aversa I, Chirillo R, Chiarella E, Zolea F, Di Sanzo M, Biamonte F. et al. Chemoresistance in H-Ferritin Silenced Cells: The Role of NF-κB. Int J Mol Sci. 2018 19(10)
26. Jiang X, Wu J, Wang J, Huang R. Tobacco and oral squamous cell carcinoma: A review of carcinogenic pathways. Tob Induc Dis. 2019;17(April):29 Available from: https://pmc.ncbi.nlm.nih.gov/articles/PMC6752112/
27. Kamalesh R, Saravanan A. Heavy metal exposure as a risk factor in oral cancer. Cancer Pathogenesis and Therapy. 2024;2(3):215 Available from: https://pmc.ncbi.nlm.nih.gov/articles/PMC11252503/
28. Satir S. The relationship between oral cancer and cadmium: a review. Mol Biol Rep. 2022;49(3):2413-9 Available from: https://pubmed.ncbi.nlm.nih.gov/34822067/
29. He S, Chakraborty R, Ranganathan S. Proliferation and Apoptosis Pathways and Factors in Oral Squamous Cell Carcinoma. Int J Mol Sci. 2022 23(3). Available from: https://pubmed.ncbi.nlm.nih.gov/35163485/
30. Tan Y, Wang Z, Xu M, Li B, Huang Z, Qin S. et al. Oral squamous cell carcinomas: state of the field and emerging directions. Int J Oral Sci. 2023;15(1):44 Available from: https://pmc.ncbi.nlm.nih.gov/articles/PMC10517027/
31. Antonelli A, Battaglia AM, Sacco A, Petriaggi L, Giorgio E, Barone S. et al. Ferroptosis and oral squamous cell carcinoma: connecting the dots to move forward. Frontiers in oral health. 2024 5. Available from: https://pubmed.ncbi.nlm.nih.gov/39296524/
32. Sacco A, Battaglia AM, Santamaria G, Buffone C, Barone S, Procopio A. et al. SOX2 promotes a cancer stem cell-like phenotype and local spreading in oral squamous cell carcinoma. PLoS One. 2023 18(12). Available from: https://pubmed.ncbi.nlm.nih.gov/38096163/
33. Biamonte F, Buffone C, Santamaria G, Battaglia AM, Mignogna C, Fortunato L. et al. Gene expression analysis of autofluorescence margins in leukoplakia and oral carcinoma: A pilot study. Oral Dis. 2021 27(2)
34. Tavakoli Pirzaman A, Ebrahimi P, Niknezhad S, vahidi T, Hosseinzadeh D, Akrami S. et al. Toxic mechanisms of cadmium and exposure as a risk factor for oral and gastrointestinal carcinomas. Hum Exp Toxicol. 2023 42. Available from: https://journals.sagepub.com/doi/full/10.1177/09603271231210262
35. Senevirathna K, Mahakapuge TAN, Ileperuma P, Jayawardana NU, Jayarathne L, Weerasekara R. et al. Correlation between serum heavy metals and the risk of oral squamous cell carcinoma and oral potentially malignant disorders. Scientific Reports 2024 14:1. 2024;14(1):1-8 Available from: https://www.nature.com/articles/s41598-024-70057-7
36. Fan T, Chen Y, He Z, Wang Q, Yang X, Ren Z. et al. Inhibition of ROS/NUPR1-dependent autophagy antagonises repeated cadmium exposure -induced oral squamous cell carcinoma cell migration and invasion. Toxicol Lett. 2019Oct10;314:142-52
37. Kwon MY, Park E, Lee SJ, Chung SW. Heme oxygenase-1 accelerates erastin-induced ferroptotic cell death. Oncotarget. 2015;6(27):24393-403 Available from: https://pubmed.ncbi.nlm.nih.gov/26405158/
38. Battaglia AM, Sacco A, Aversa I, Santamaria G, Palmieri C, Botta C. et al. Iron-mediated oxidative stress induces PD-L1 expression via activation of c-Myc in lung adenocarcinoma. Front Cell Dev Biol. 2023Jun12;11:1208485
39. Di Sanzo M, Cozzolino F, Battaglia AM, Aversa I, Monaco V, Sacco A. et al. Ferritin Heavy Chain Binds Peroxiredoxin 6 and Inhibits Cell Proliferation and Migration. Int J Mol Sci. 2022 23(21). Available from: /pmc/articles/PMC9654362/
40. Di Vito A, Chiarella E, Sovereto J, Bria J, Perrotta ID, Salatino A. et al. Novel insights into the pharmacological modulation of human periodontal ligament stem cells by the amino-bisphosphonate Alendronate. Eur J Cell Biol. 2023Dec1;102(4):151354
41. Scotto di Carlo F, Russo S, Muyas F, Mangini M, Garribba L, Pazzaglia L. et al. Profilin 1 deficiency drives mitotic defects and reduces genome stability. Commun Biol. 2023 6(1). Available from: https://pubmed.ncbi.nlm.nih.gov/36599901/
42. Bulotta S, Cerullo A, Barsacchi R, Palma C De, Rotiroti D, Clementi E. et al. Endothelial nitric oxide synthase is segregated from caveolin-1 and localizes to the leading edge of migrating cells. Exp Cell Res. 2006;312(6):877-89 Available from: https://pubmed.ncbi.nlm.nih.gov/16427620/
43. Cosco D, Bruno F, Castelli G, Puleio R, Bonacci S, Procopio A. et al. Meglumine Antimoniate-Loaded Aqueous-Core PLA Nanocapsules: Old Drug, New Formulation against Leishmania-Related Diseases. Macromol Biosci. 2021;21(7):2100046 Available from: https://onlinelibrary.wiley.com/doi/full/10.1002/mabi.202100046
44. Chiesa LM, Ceriani F, Procopio A, Bonacci S, Malandra R, Panseri S. et al. Exposure to metals and arsenic from yellow and red tuna consumption. Food Additives & Contaminants: Part A. 2019;36(8):1228-35 Available from: https://www.tandfonline.com/doi/abs/10.1080/19440049.2019.1619944
45. Zolea F, Biamonte F, Candeloro P, Di Sanzo M, Cozzi A, Di Vito A. et al. H ferritin silencing induces protein misfolding in K562 cells: A Raman analysis. Free Radic Biol Med. 2015Dec1;89:614-23
46. Di Sanzo M, Aversa I, Santamaria G, Gagliardi M, Panebianco M, Biamonte F. et al. FTH1P3, a Novel H-Ferritin Pseudogene Transcriptionally Active, Is Ubiquitously Expressed and Regulated during Cell Differentiation. PLoS One. 2016;11(3):e0151359 Available from: https://journals.plos.org/plosone/article?id=10.1371/journal.pone.0151359
47. Tamariz-Amador LE, Battaglia AM, Maia C, Zherniakova A, Guerrero C, Zabaleta A. et al. Immune biomarkers to predict SARS-CoV-2 vaccine effectiveness in patients with hematological malignancies. Blood Cancer Journal. 2021;11(12):1-13 Available from: https://www.nature.com/articles/s41408-021-00594-1
48. Garofalo E, Biamonte F, Palmieri C, Battaglia AM, Sacco A, Biamonte E. et al. Severe and mild-moderate SARS-CoV-2 vaccinated patients show different frequencies of IFNγ-releasing cells: An exploratory study. PLoS One. 2023 18(2). Available from: https://pubmed.ncbi.nlm.nih.gov/36757971/
49. Biamonte F, Zolea F, Santamaria G, Battaglia AM, Cuda G, Costanzo F. Human haematological and epithelial tumor-derived cell lines express distinct patterns of onco-microRNAs. Cell Mol Biol. 2017 63(11)
50. GSEABase: Gene set enrichment data structures and methods version 1.52.1 from Bioconductor. Available from: https://rdrr.io/bioc/GSEABase/
51. Yu G, Wang LG, Han Y, He QY. clusterProfiler: an R package for comparing biological themes among gene clusters. OMICS. 2012;16(5):284-7 Available from: https://pubmed.ncbi.nlm.nih.gov/22455463/
52. De Vitis C, Battaglia AM, Pallocca M, Santamaria G, Mimmi MC, Sacco A. et al. ALDOC- and ENO2- driven glucose metabolism sustains 3D tumor spheroids growth regardless of nutrient environmental conditions: a multi-omics analysis. Journal of Experimental & Clinical Cancer Research 2023 42:1. 2023;42(1):1-25 Available from: https://jeccr.biomedcentral.com/articles/10.1186/s13046-023-02641-0
53. Qu F, Zheng W. Cadmium Exposure: Mechanisms and Pathways of Toxicity and Implications for Human Health. Toxics 2024, Vol 12, Page 388. 2024;12(6):388 Available from: https://www.mdpi.com/2305-6304/12/6/388/htm
54. Tang D, Chen X, Kang R, Kroemer G. Ferroptosis: molecular mechanisms and health implications. Cell Research 2020 31:2. 2020;31(2):107-25 Available from: https://www.nature.com/articles/s41422-020-00441-1
55. Hou W, Xie Y, Song X, Sun X, Lotze MT, Zeh HJ. et al. Autophagy promotes ferroptosis by degradation of ferritin. Autophagy. 2016;12(8):1425 Available from: https://pmc.ncbi.nlm.nih.gov/articles/PMC4968231/
56. Park E, Chung SW. Cell Death & Disease ROS-mediated autophagy increases intracellular iron levels and ferroptosis by ferritin and transferrin receptor regulation. Available from: https://doi.org/10.1038/s41419-019-2064-5.
57. Hou W, Xie Y, Song X, Sun X, Lotze MT, Zeh HJ. et al. Autophagy promotes ferroptosis by degradation of ferritin. Autophagy. 2016;12(8):1425-8 Available from: https://pubmed.ncbi.nlm.nih.gov/27245739/
58. Dixon SJ, Lemberg KM, Lamprecht MR, Skouta R, Zaitsev EM, Gleason CE. et al. Ferroptosis: an iron-dependent form of nonapoptotic cell death. Cell. 2012;149(5):1060-72 Available from: https://pubmed.ncbi.nlm.nih.gov/22632970/
59. Battaglia AM, Chirillo R, Aversa I, Sacco A, Costanzo F, Biamonte F. Ferroptosis and Cancer: Mitochondria Meet the “Iron Maiden” Cell Death. Cells 2020, Vol 9, Page 1505. 2020;9(6):1505 Available from: https://www.mdpi.com/2073-4409/9/6/1505/htm
60. Li J, Jia YC, Ding YX, Bai J, Cao F, Li F. The crosstalk between ferroptosis and mitochondrial dynamic regulatory networks. Int J Biol Sci. 2023;19(9):2756-71 Available from: https://www.ijbs.com://creativecommons.org/licenses/by/4.0/
61. Ezim OE, Kidi L, Ndufeiya-Kumasi LC, Abarikwu SO. Iron Administration Partially Ameliorates Cadmium-Induced Oxidative Damage in the Liver and Kidney of Rats. Sucharitakul P, editor. J Toxicol. 2024;2024(1):6197553 Available from: https://onlinelibrary.wiley.com/doi/full/10.1155/2024/6197553
62. Fujiwara Y, Lee JY, Banno H, Imai S, Tokumoto M, Hasegawa T. et al. Cadmium induces iron deficiency anemia through the suppression of iron transport in the duodenum. Toxicol Lett. 2020;332:130-9 Available from: https://pubmed.ncbi.nlm.nih.gov/32645461/
63. Satarug S, Massányi P, Tokar EJ, Tokumoto M, Lee JY, Fujiwara Y. et al. Long-Term Exposure to Cadmium Causes Hepatic Iron Deficiency through the Suppression of Iron-Transport-Related Gene Expression in the Proximal Duodenum. Toxics 2023, Vol 11, Page 641. 2023;11(7):641 Available from: https://www.mdpi.com/2305-6304/11/7/641/htm
64. Jin X, Jiang C, Zou Z, Huang H, Li X, Xu S. et al. Ferritinophagy in the etiopathogenic mechanism of related diseases. J Nutr Biochem. 2023 117. Available from: https://pubmed.ncbi.nlm.nih.gov/37061010/
65. Battaglia AM, Sacco A, Perrotta ID, Faniello MC, Scalise M, Torella D. et al. Iron Administration Overcomes Resistance to Erastin-Mediated Ferroptosis in Ovarian Cancer Cells. Front Oncol. 2022 12
66. Battaglia AM, Sacco A, Vecchio E, Scicchitano S, Petriaggi L, Giorgio E. et al. Iron affects the sphere-forming ability of ovarian cancer cells in non-adherent culture conditions. Front Cell Dev Biol. 2023 11. Available from: https://pubmed.ncbi.nlm.nih.gov/38033861/
67. Zuo Z, Zhou Z, Chang Y, Liu Y, Shen Y, Li Q. et al. Ribonucleotide reductase M2 (RRM2): Regulation, function and targeting strategy in human cancer. Genes Dis. 2024Jan1;11(1):218-33
68. Nzengue Y, Steiman R, Garrel C, Lefèbvre E, Guiraud P. Oxidative stress and DNA damage induced by cadmium in the human keratinocyte HaCaT cell line: role of glutathione in the resistance to cadmium. Toxicology. 2008;243(1-2):193-206 Available from: https://pubmed.ncbi.nlm.nih.gov/18061332/
69. Manca D, Ricard AC, Van Tra H, Chevalier G. Relation between lipid peroxidation and inflammation in the pulmonary toxicity of cadmium. Arch Toxicol. 1994;68(6):364-9 Available from: https://pubmed.ncbi.nlm.nih.gov/8092928/
70. Bagchi D, Vuchetich PJ, Bagchi M, Hassoun EA, Tran MX, Tang L. et al. Induction of oxidative stress by chronic administration of sodium dichromate [chromium VI] and cadmium chloride [cadmium II] to rats. Free Radic Biol Med. 1997;22(3):471-8 Available from: https://pubmed.ncbi.nlm.nih.gov/8981039/
71. Liu F, Jan KY. DNA damage in arsenite- and cadmium-treated bovine aortic endothelial cells. Free Radic Biol Med. 2000;28(1):55-63 Available from: https://pubmed.ncbi.nlm.nih.gov/10656291/
72. Messner B, Türkcan A, Ploner C, Laufer G, Bernhard D. Cadmium overkill: autophagy, apoptosis and necrosis signalling in endothelial cells exposed to cadmium. Cell Mol Life Sci. 2015;73(8):1699 Available from: https://pmc.ncbi.nlm.nih.gov/articles/PMC4805700/
73. Templeton DM, Liu Y. Multiple roles of cadmium in cell death and survival. Chem Biol Interact. 2010;188(2):267-75 Available from: https://pubmed.ncbi.nlm.nih.gov/20347726/
74. Kim SC, Cho MK, Kim SG. Cadmium-induced non-apoptotic cell death mediated by oxidative stress under the condition of sulfhydryl deficiency. Toxicol Lett. 2003Oct15;144(3):325-36
75. Liu W, Dai N, Wang Y, Xu C, Zhao H, Xia P. et al. Role of autophagy in cadmium-induced apoptosis of primary rat osteoblasts. Scientific Reports 2016 6:1. 2016;6(1):1-8 Available from: https://www.nature.com/articles/srep20404
76. Francis Stuart SD, Villalobos AR. GSH and Zinc Supplementation Attenuate Cadmium-Induced Cellular Stress and Stimulation of Choline Uptake in Cultured Neonatal Rat Choroid Plexus Epithelia. Int J Mol Sci. 2021;22(16):8857 Available from: https://pmc.ncbi.nlm.nih.gov/articles/PMC8396310/
77. So KY, Oh SH. Cadmium-induced heme-oxygenase-1 expression plays dual roles in autophagy and apoptosis and is regulated by both PKC-δ and PKB/Akt activation in NRK52E kidney cells. Toxicology. 2016;370:49-59 Available from: https://pubmed.ncbi.nlm.nih.gov/27658547/
78. So KY, Oh SH. Heme oxygenase-1-mediated apoptosis under cadmium-induced oxidative stress is regulated by autophagy, which is sensitized by tumor suppressor p53. Biochem Biophys Res Commun. 2016;479(1):80-5 Available from: https://pubmed.ncbi.nlm.nih.gov/27620489/
79. Ali Hussein M, Kamalakkannan A, Valinezhad K, Kannan J, Paleati N, Saad R. et al. The dynamic face of cadmium-induced Carcinogenesis: Mechanisms, emerging trends, and future directions. Curr Res Toxicol. 2024 6. Available from: https://pubmed.ncbi.nlm.nih.gov/38706786/
80. Nemmiche S, Guiraud P. Cadmium-induced oxidative damages in the human BJAB cells correlate with changes in intracellular trace elements levels and zinc transporters expression. Toxicol In Vitro. 2016;37:169-77 Available from: https://pubmed.ncbi.nlm.nih.gov/27647474/
81. Koizumi T, Li ZG. Role of oxidative stress in single-dose, cadmium-induced testicular cancer. Journal of Toxicology and Environmental Health, Part A Current Issues. 1992;37(1):25-36 Available from: https://www.tandfonline.com/doi/abs/10.1080/15287399209531654
82. Casalino E, Calzaretti G, Sblano C, Landriscina C. Molecular inhibitory mechanisms of antioxidant enzymes in rat liver and kidney by cadmium. Toxicology. 2002Sep30;179(1-2):37-50
83. Santana-Codina N, Mancias JD. The Role of NCOA4-Mediated Ferritinophagy in Health and Disease. Pharmaceuticals. 2018 11(4). Available from: /pmc/articles/PMC6316710/
84. Fang Y, Chen X, Tan Q, Zhou H, Xu J, Gu Q. Inhibiting Ferroptosis through Disrupting the NCOA4-FTH1 Interaction: A New Mechanism of Action. ACS Cent Sci. 2021;7(6):980-9 Available from: https://pubs.acs.org/doi/full/10.1021/acscentsci.0c01592
85. Bellelli R, Federico G, Matte' A, Colecchia D, Iolascon A, Chiariello M. et al. NCOA4 Deficiency Impairs Systemic Iron Homeostasis. Cell Rep. 2016;14(3):411-21 Available from: https://pubmed.ncbi.nlm.nih.gov/26776506/
86. Probst S, Fels J, Scharner B, Wolff NA, Roussa E, van Swelm RPL. et al. Role of hepcidin in oxidative stress and cell death of cultured mouse renal collecting duct cells: protection against iron and sensitization to cadmium. Arch Toxicol. 2021;95(8):2719-35 Available from: https://pubmed.ncbi.nlm.nih.gov/34181029/
87. Dixon SJ. Ferroptosis: bug or feature? Immunol Rev. 2017;277(1):150-7 Available from: https://pubmed.ncbi.nlm.nih.gov/28462529/
88. Dixon SJ, Stockwell BR. The Hallmarks of Ferroptosis. https://doi.org/101146/annurev-cancerbio-030518-055844. 2019;3(1):35-54 Available from: /pb-assets/assets/images/social-media/facebook-cover/CA_Journal_Cover_Facebook-1539113409273.png
89. Aschner M, Skalny A V, Martins AC, Sinitskii AI, Farina M, Lu R. et al. Ferroptosis as a mechanism of non-ferrous metal toxicity. Arch Toxicol. 2022;96(9):2391-417 Available from: https://pubmed.ncbi.nlm.nih.gov/35727353/
90. Zhao C, Yu D, He Z, Bao L, Feng L, Chen L. et al. Endoplasmic reticulum stress-mediated autophagy activation is involved in cadmium-induced ferroptosis of renal tubular epithelial cells. Free Radic Biol Med. 2021Nov1;175:236-48
91. Jia D, Zhang M, Li M, Gong W, Huang W, Wang R. et al. NCOA4-mediated ferritinophagy participates in cadmium-triggered ferroptosis in spermatogonia. Toxicology. 2024 505. Available from: https://pubmed.ncbi.nlm.nih.gov/38768701/
92. He Z, Shen P, Feng L, Hao H, He Y, Fan G. et al. Cadmium induces liver dysfunction and ferroptosis through the endoplasmic stress-ferritinophagy axis. Ecotoxicol Environ Saf. 2022Oct15;245:114123
93. Yang R, Roshani D, Gao B, Li P, Shang N. Metallothionein: A Comprehensive Review of Its Classification, Structure, Biological Functions, and Applications. Antioxidants. 2024;13(7):825 Available from: https://www.mdpi.com/2076-3921/13/7/825/htm
94. Lv YT, Liu T Bin, Li Y, Wang ZY, Lian CY, Wang L. HO-1 activation contributes to cadmium-induced ferroptosis in renal tubular epithelial cells via increasing the labile iron pool and promoting mitochondrial ROS generation. Chem Biol Interact. 2024Aug25;399:111152
Author contact
![]() Corresponding author: Anna Martina Battaglia; Email: am.battagliait, Phone number: +3909613694105.
Corresponding author: Anna Martina Battaglia; Email: am.battagliait, Phone number: +3909613694105.