Impact Factor ISSN: 1449-2288




Int J Biol Sci 2027; 23(1):99-118. doi:10.7150/ijbs.139485 This issue Cite
Research Paper
FAT1 Promotes EGFR-TKI Resistance in Non-Small Cell Lung Cancer Cells by Inducing Mitophagy
Chen Ding1,2#, Hua Huang1#, Zexia Zhao1#, Wenhao Zhao1, Xuanguang Li1, Hongbing Zhang1, Minghui Liu1, Chen Chen3, Yongwen Li3, Hongyu Liu3  , Jun Chen1,2,3
1. Department of Lung Cancer Surgery, Center of Thoracic Surgery, Tianjin Medical University General Hospital, Tianjin 300052, People's Republic of China.
2. Department of Thoracic Surgery, First Affiliated Hospital, School of Medicine, Shihezi University, Shihezi 832003, China.
3. Tianjin Key Laboratory of Lung Cancer Metastasis and Tumor Microenvironment, Tianjin Lung Cancer Institute, Tianjin Medical University General Hospital, Tianjin 300052, People's Republic of China.
# These authors contributed equally in this work.
Received 2026-6-17; Accepted 2026-9-25; Published 2027-1-1
Abstract
EGFR-TKIs improve NSCLC outcomes, but acquired resistance persists. The role of mitochondrial homeostasis remains unclear. TKI-resistant NSCLC models were established. Mitochondrial function, ROS, and mitophagy were assessed in resistant versus parental cells and after FAT1 knockdown. Mechanisms were explored via protein interaction and ubiquitination assays. In vivo studies validated therapeutic relevance. Resistant NSCLC cells displayed increased mitochondrial content, elevated mitochondrial membrane potential, and higher ATP production, together with evidence of enhanced mitophagy and reduced ROS accumulation. FAT1 was significantly upregulated in these cells and correlated with heightened drug resistance, enhanced proliferation and migration, and inhibited apoptosis. FAT1 deficiency decreased mitochondrial function and disrupted mitophagy, resulting in ROS accumulation and restored EGFR-TKI sensitivity. Treatment with the ROS scavenger NAC partially rescued the increased EGFR-TKI sensitivity induced by FAT1 knockdown. Chloroquine-induced autophagy inhibition also counteracted resistance. Mechanistically, FAT1 depletion reduced USP38 expression, whereas USP38 promoted PINK1 deubiquitination by limiting K48-linked ubiquitination, thereby maintaining PINK1 stability. In vivo, FAT1 knockdown improved the antitumor effect of EGFR-TKIs treatment, inhibiting tumor growth and decreasing PINK1 and Ki67 expression. FAT1 contributes to resistance through the USP38-PINK1 axis, enhancing mitophagy and reducing ROS. Modulation of the FAT1-USP38-PINK1 axis may represent a potential strategy to overcome EGFR-TKI resistance in NSCLC.
Keywords: FAT1, NSCLC, EGFR-TKIs, resistance, mitophagy
Introduction
Worldwide, lung cancer is the leading cause of cancer-related death [1]. In the past decade, targeted therapies for non-small cell lung cancer (NSCLC) have addressed the significant gap in treatment options for patients with targetable driver mutations [2, 3]. Epidermal growth factor receptor-tyrosine kinase inhibitors (EGFR-TKIs) [4], which include first-generation EGFR-TKIs such as gefitinib [5] and erlotinib [6] and third-generation EGFR-TKIs such as osimertinib [7], offer substantial therapeutic benefits and improved prognosis for EGFR mutation-positive patients and have been approved for use in patients with EGFR mutations in first- and second-line settings [3]. However, while EGFR-TKIs initially exhibit favorable and sustained therapeutic responses, most patients develop acquired resistance [8], which leads to tumor recurrence and progression. Notably, resistance to osimertinib often limits the effectiveness of subsequent EGFR-TKI therapies, although the pattern of cross-resistance varies depending on the underlying resistance mechanisms [9]. Therefore, determining the underlying mechanisms of acquired resistance to EGFR-TKIs is key to delaying and overcoming this resistance and has become a critical clinical challenge.
Acquired resistance is driven by complex mechanisms [10]. Resistance to first-generation EGFR-TKIs may be caused by several mechanisms [11], including the development of a secondary EGFR mutation (such as the T790M mutation [12]), amplification of the MET gene [13], or activation of other pathway molecules. In the FLAURA analysis of first-line osimertinib, EGFR C797S were among the most frequent acquired genomic alterations [14, 15]. MET amplification is also a recognized mechanism of acquired resistance to EGFR-TKIs [16]. However, the mechanisms underlying many cases of resistance to first- and third-generation EGFR-TKIs are unknown.
In recent years, considerable attention has been paid to the role of mitochondrial homeostasis and metabolic reprogramming in tumorigenesis and progression [17]. An increasing body of evidence suggests that mitochondrial metabolic reprogramming and an imbalance in mitochondrial homeostasis, induced by genetic and/or environmental factors, play crucial roles in the initiation and development of certain types of cancers [18]. Mitophagy, which is a selective autophagic process that degrades superfluous or damaged mitochondria, serves as a vital component for cellular and mitochondrial quality control [19]. By eliminating dysfunctional mitochondria, mitophagy prevents excessive ROS accumulation [20], apoptosis, and inflammatory responses, thereby maintaining metabolic homeostasis. Emerging evidence [21, 22] highlights the pivotal role of mitophagy in tumor development and therapy resistance and has linked enhanced mitophagy to cancer cell drug resistance, suggesting that inhibition of mitophagy may be one way to overcome resistance. However, whether mitophagy plays a role in EGFR-TKIs acquired resistance is unclear.
The FAT family (FAT atypical cadherin family) encodes protocadherins and includes FAT1, FAT2, FAT3, and FAT4 [23, 24]. In particular, FAT1 plays important roles in development and disease and is among the frequently altered genes in several human cancers. It is primarily expressed in proliferating epithelial tissues during normal development, such as in the neuroepithelium, lung, and kidney [25]. Its expression peaks during embryonic development and gradually decreases in adulthood. It influences multiple signaling pathways through protein-protein interactions, such as epithelial-mesenchymal transition (EMT) [26] and the Hippo signaling pathway [27]. Substantial evidence indicates that the aberrant expression of FAT1 plays an essential role in cancer initiation and progression and may affect tumor prognosis. FAT1 exhibits both oncogenic and tumor-suppressive properties, with its function varying among cancers. For example, in hepatocellular carcinoma [28], it acts as a tumor promoter by enhancing cell migration through regulation of EMT-related genes. Conversely, in certain squamous cell carcinomas, FAT1 appears to function as a tumor suppressor through mechanisms involving key signaling pathways such as Hippo/YAP and MAPK/ERK [29]. These diverse biological functions suggest that FAT1 may serve as an important regulator of tumor behavior and therapeutic responses.
In our previous pan-cancer analysis, we identified FAT1 as a potential therapeutic candidate and immunotherapy-associated biomarker across multiple cancer types, including NSCLC [30]. However, this previous study was primarily based on bioinformatic analyses, and the functional role and underlying mechanisms of FAT1 in EGFR-TKI resistance remain largely unknown. Given the potential involvement of FAT1 in tumor signaling regulation and treatment response, we hypothesized that FAT1 may contribute to acquired EGFR-TKI resistance in NSCLC.
Mitochondrial homeostasis has recently emerged as an important determinant of cancer cell survival and therapeutic response, particularly during the development of drug resistance. Interestingly, emerging evidence suggests that FAT1 may also participate in mitochondrial regulation. Previous studies have implicated FAT1 in mitochondrial regulation in specific cellular contexts. For example, FAT1 accumulates in vascular smooth muscle cell mitochondria and regulates mitochondrial activity during vascular injury-induced proliferative responses [25]. Although FAT1 has been implicated in cancer, kidney and muscle development, and neuropsychiatric disease [31], its role in regulating mitochondrial homeostasis in cancer cells and its contribution to EGFR-TKI resistance remain largely unexplored. Therefore, investigating the potential link between FAT1 and mitochondrial regulation may help clarify the mechanisms by which FAT1 contributes to EGFR-TKI resistance in NSCLC.
In light of the clinical challenge posed by acquired resistance to EGFR-TKIs in NSCLC and the emerging links between mitochondrial homeostasis, mitophagy, and drug resistance, further investigation into the underlying mechanisms is warranted. FAT1, a large cadherin family member, has been implicated in tumor progression and mitochondrial regulation, yet its role in EGFR-TKI resistance remains poorly understood. The aim of the present study was to determine whether FAT1 contributes to acquired resistance to EGFR-TKIs in NSCLC and to elucidate the potential mechanisms involved, with a particular focus on mitochondrial function and mitophagy. Clarifying the role of FAT1 in this context may provide novel insights into therapeutic strategies to restore EGFR-TKI sensitivity in resistant NSCLC.
Methods
Cell lines, cell culture, and transfection
The NSCLC cell lines used in this study were purchased from the Chinese Academy of Sciences Cell Bank (H1975: RRID CVCL_1511; PC9: RRID CVCL_B260). All cells were STR-validated at Genechem (Shanghai, China) and tested for mycoplasma contamination. The cells were maintained in a humidified atmosphere at 37°C with 5% CO2 in either RPMI 1640 medium or DMEM (Gibco, Grand Island, NY, USA) supplemented with 10% fetal bovine serum (Newzerum, Christchurch, New Zealand).
Both H1975 and PC9 cells were chronically exposed to increasing concentrations of osimertinib and gefitinib, respectively, starting from 1 µM until reaching the maximum tolerated dose of 8 µM. Following this adaptation period, the cells were maintained in a medium containing 1 µM of the respective drug. The drug was withdrawn three days prior to any subsequent analysis.
Small interfering RNA (siRNA) was procured from Ribobio (Guangzhou, China). The specific knockdown sequences are listed in Supplementary Table 1. Transfection of siRNA duplexes was conducted using Lipofectamine 2000 (#12566014, Thermo Fisher Scientific, Waltham, MA, USA) following the manufacturer's protocol. For stable transfection, lentiviral particles were obtained from GeneChem (Shanghai, China), and stable cell lines were established according to the supplier's instructions. In this study, since the lentiviral vector used for FAT1 knockdown carries a green fluorescent protein (GFP) tag, transient siRNA-mediated gene knockdown was adopted for experiments involving dual-color immunofluorescence and flow cytometry to avoid potential interference from GFP fluorescence.
Reagents
Gefitinib (ZD1839) and osimertinib (AZD9291) were obtained from Selleck Chemicals (Shanghai, China). In accordance with the supplier's instructions and optimized for our specific cell systems, compounds were administered for 48 hours to ensure the subsequent observation of functional changes. Carbonyl Cyanide m-Chlorophenylhydrazone (CCCP) and Chloroquine (CQ) were obtained from Sigma (CCCP: C2759; CQ: C6628, Saint Louis, MO, USA). N-acetyl-L-cysteine (NAC) was obtained from Beyotime (S0077, Shanghai, China).
Transwell assay
Cells were resuspended and seeded into the upper chamber of a Transwell insert (Corning, Corning, NY, USA). For invasion assays, the upper chamber was pre-coated with 30 μL of Matrigel (Corning), which was allowed to polymerize prior to cell seeding. The lower chamber was filled with 500 μL of medium supplemented with 10% fetal bovine serum. After 24 hours of incubation, the cells that had migrated/invaded through the membrane were fixed, stained with crystal violet, imaged, and quantified.
CCK-8 assay
Following cell counting, the cells were resuspended to the desired concentration, mixed thoroughly, and seeded into a 96-well plate. In this study, for proliferation assays, H1975/AR cells were seeded at a density of 3,000 cells/well/100 µL medium, and PC9/AB2 cells at 5,000 cells/well/100 µL medium. For IC50 determination assays, H1975/AR cells were seeded at 5,000 cells/well/100 µL, and PC9/AB2 cells were seeded at 8,000 cells/well/100 µL. After cell attachment, the culture medium was removed following drug treatment, and 100 µL of 10% CCK-8 solution (APExBIO, Shanghai, China) was added to each well. The plate was shielded from light and incubated for 1 hour. Absorbance was measured at 450 nm using a microplate reader.
Protein extraction and western blotting
Cells were harvested by scraping and centrifuged at 14,000 × g for 15 minutes at 4°C to obtain whole-cell lysates. Total protein was extracted using lysis buffer (Beyotime, Shanghai, China) supplemented with protease inhibitor (Solarbio, Beijing, China) and phosphatase inhibitor (Beyotime, Shanghai, China). Protein samples of equal quantity (30 µg per lane) were separated by electrophoresis on 10% SDS-polyacrylamide gels alongside pre-stained protein markers and subsequently transferred to a PVDF membrane (Merck, Darmstadt, Germany).
The membrane was blocked for 1 hour at room temperature with 5% non-fat milk in Tris-buffered saline, followed by incubation with primary antibodies diluted in blocking buffer at 4°C overnight. The primary antibodies used in this study, along with their corresponding dilution factors, are provided in Supplementary Table 2. The membrane was incubated for 1 hour at room temperature with species-appropriate horseradish peroxidase (HRP)-conjugated secondary antibodies (anti-rabbit, AS014; anti-mouse, AS003; Abclonal, China). Protein bands were visualized using a chemiluminescence system.
RNA extraction and qRT-PCR
Total RNA was extracted using the RNA Fast Extraction Kit (Sparkjade, Shandong, China) and reverse-transcribed into cDNA using a Reverse Transcription Kit (Takara, Beijing, China). PCR amplification was performed using a standard protocol under appropriate thermal cycling conditions. The reaction procedure was as follows: initial denaturation at 95°C for 30 seconds; followed by 40 cycles, each consisting of denaturation at 95°C for 10 seconds and annealing/extension at 60°C for 30 seconds; and finally, a melting curve analysis (ramping from 60°C to 95°C). The primer sequences used in this study are listed in Supplementary Table 3. Data were analyzed using the comparative Ct method (2^-ΔΔCt). The results were normalized to the expression of the internal control gene, GAPDH.
Flow cytometry for apoptosis
Cells were collected and processed in accordance with the protocol of the apoptosis detection kit (BD Biosciences, CA, USA). Apoptotic cells were subsequently quantified by flow cytometry.
MitoTracker Red staining
To detect functionally active mitochondria with intact membrane potential, cells were stained using Mito Tracker Red. The fluorescence accumulation of this probe depends on mitochondrial membrane potential, thereby specifically labeling the population of functionally active mitochondria. Sterile coverslips were placed in a 6-well plate, and cells were seeded into each well. After cell attachment, Mito Tracker Red stock solution (M22426, Thermo Fisher Scientific) was diluted in DMSO to a working concentration of 1:2000 in culture medium. One milliliter of the working solution was added to each well, and the cells were incubated at 37°C protected from light for 20-30 minutes. The cells were then washed with PBS for subsequent staining or mounting.
MitoSOX staining and total ROS measurement
MitoSOX reagent (M36008, Thermo Fisher Scientific) was reconstituted in 13 µL of DMSO as a stock solution. After cell attachment, the stock solution was diluted 1:5000 in culture medium to obtain the working solution. One milliliter of this solution was added to each well, followed by incubation at 37°C in the dark for 20 minutes. The cells were then washed with PBS before further analysis.
For total ROS detection, cells were collected and stained using a commercial ROS detection kit (S0033S, Beyotime) according to the manufacturer's instructions. After staining, the cells were washed three times with serum-free medium and resuspended in PBS. Total ROS-associated fluorescence was assessed by flow cytometry.
Mito-Keima assay
To assess mitophagy, NSCLC cells stably expressing lentivirus-encoded mito-Keima were established. Cells were then treated as indicated, including comparison between EGFR-TKI-sensitive and EGFR-TKI-resistant cells, or resistant cells subjected to FAT1 knockdown and EGFR-TKI treatment. CCCP treatment was used as a positive control for mitophagy induction. Images were acquired by confocal microscopy using dual excitation at 458 nm and 561 nm. Mitophagy activity was quantified as the 561/458 fluorescence ratio.
Immunofluorescence staining
After cell attachment to coverslips, the cells were fixed with universal tissue fixative (Servicebio, Beijing, China) for 20 minutes and washed with PBS. Permeabilization was performed using 0.5% Triton X-100 for 15 minutes, followed by blocking with 1% bovine serum albumin in PBS for 40 minutes. The cells were then incubated with primary antibody at 4°C overnight. After removal of the primary antibody and washing with PBS, the samples were incubated with a fluorophore-conjugated secondary antibody for 40 minutes in the dark. For nuclear staining, the cells were mounted using an anti-fade mounting medium containing DAPI (Beyotime). Imaging and analysis were conducted using a confocal microscope (Olympus, Tokyo, Japan).
ATP detection and measurement of the mitochondrial membrane potential (JC-1 staining)
ATP levels were quantified using a commercial ATP detection kit (Beyotime) according to the manufacturer's instructions. Relative light units (RLUs) were measured with a luminometer, and ATP concentrations were calculated based on a standard curve.
For mitochondrial membrane potential assessment, cells were resuspended in 1 mL of culture medium containing 10 µL of 200 µM JC-1 stock solution (HY-K0601, MCE, Shanghai, China). After incubation at 37°C in the dark for 20 minutes, the cells were washed with PBS, resuspended in 500 µL PBS, and analyzed by flow cytometry.
Transmission electron microscopy
For transmission electron microscopy (TEM), a minimum of 3 × 10⁶ cells were collected. After being washed in PBS, 200 µL of PBS was added to gently resuspend and mix the cells. Cells were harvested by centrifugation at 4 °C, after which the supernatant was discarded. The resulting cell pellets were fixed by adding 2.5% glutaraldehyde solution and maintained at 4 °C for 24 hours. The specimens were processed for TEM by trained personnel in the electron microscopy facility (Hitachi HT7800, Hitachi, Japan).
Cells were randomly selected from each group for TEM observation. Multiple randomly selected fields from each cell were examined, and all identifiable mitochondria within each analyzed cell were included for quantitative analysis. Mitochondrial number and mitophagy rate were quantified according to predefined morphological criteria. The mitophagy rate was defined as the proportion of mitochondria associated with or enclosed by autophagy-related structures relative to the total number of mitochondria analyzed. Mitophagy-related structures were defined as mitochondria enclosed within double-membrane autophagic structures or mitochondria exhibiting obvious ultrastructural degradation features.
Cellular oxygen consumption rate
The oxygen consumption rate (OCR) was analyzed using the Seahorse assay kit (103015-100, Agilent Technologies, Santa Clara, CA, USA) following the manufacturer's instructions. Briefly, Cells were seeded in 24-well plates. H1975/AR and PC9/AB2 cells were plated at densities of 2.1×10⁴ and 4×10⁴ cells per well, respectively. Several wells were left without cells as blank controls. After seeding, plates were placed in a humidified incubator at 37°C with 5% CO₂. Assays were initiated following complete cell attachment. The probe plate was hydrated, the cells were washed, and drugs were added to the designated drug treatment wells. The basal respiratory metabolism of the cells was measured using a Seahorse XF Analyzer (Agilent Technologies).
In vivo tumor xenograft assay
Quantified suspensions of scrambled or stable FAT1-knockdown cells were subcutaneously inoculated into immunodeficient mice at predetermined cell densities. Treatment intervention was initiated when the average tumor volume reached approximately 100 mm³. The mice were randomly divided into 4 groups (n=5 per group) and administered either vehicle control (0.9% sodium chloride) or EGFR-TKIs via oral gavage. The dosage regimens were as follows: osimertinib at 10 mg/kg/day and gefitinib at 50 mg/kg/day. After the treatment, the xenograft tumors were surgically resected, digitally documented, and subjected to volumetric measurement for comparative analysis. Volume (mm3) = [length × width2] × 0.5. The experiments on the animals were approved by the ethics committee of Tianjin Medical University General Hospital.
Immunohistochemistry
Immunohistochemical staining was performed according to standardized protocols [32]. Briefly, following antigen retrieval and blocking, tissue sections were incubated with primary antibodies at 4°C overnight. After thorough PBS washing, the sections were incubated with the corresponding secondary antibodies for 1 hour at room temperature, followed by chromogenic development using 3,3'-diaminobenzidine (DAB; Servicebio, Wuhan, China). Counterstaining was performed with hematoxylin, and slides were mounted with neutral resin mounting medium. All stained sections were digitally scanned using the Panoramic MIDI whole-slide scanning system (3DHISTECH, Hungary).
Bioinformatics analysis and statistical analysis
RNA expression data related to lung adenocarcinoma (LUAD) patients were obtained from The Cancer Genome Atlas (TCGA-LUAD) database. The GEO dataset GSE172002 was obtained from the Gene Expression Omnibus (GEO) database. In the TCGA-LUAD cohort, patients were stratified into FAT1 high-expression and low-expression groups according to the median expression level of FAT1. Differentially expressed genes (DEGs) between the two groups were identified using the limma package in R. Genes with |log2 fold change (FC)| > 1 and P < 0.05 were considered significantly differentially expressed. Subsequently, Gene Ontology (GO) enrichment analysis was performed to annotate the biological functions of DEGs and explore the biological processes and potential regulatory pathways associated with FAT1-related gene expression alterations. The GEO dataset was preprocessed and normalized according to the standard procedures recommended for the corresponding platform, and samples were grouped according to the experimental design of the dataset. Data were analyzed using GraphPad Prism 8.0 software (GraphPad Software Inc., CA, USA). Data are presented as the mean ± standard deviation from three independent experiments. Statistical tests were applied based on the assumption that the data met the prerequisites for parametric analysis. Comparisons between two groups were performed using two-tailed Student's t-test. Comparisons among multiple groups were analyzed by one-way analysis of variance (ANOVA) with Dunnett's post hoc test. For datasets involving two independent variables (e.g., tumor growth, CCK-8 assay), two-way ANOVA was employed. A p-value of less than 0.05 was considered statistically significant.
Results
Enhanced mitochondrial function is maintained in NSCLC cells with acquired resistance to EGFR-TKIs
Two pairs of EGFR-TKI-resistant NSCLC cell lines were established by exposing EGFR-TKI-sensitive lung cancer cells (H1975 and PC9) to low doses of EGFR-TKIs for at least 2 months. Drug sensitivity of the parental cells (H1975 and PC9) and their resistant counterparts (H1975/AR and PC9/AB2) was first evaluated using colony formation assay. Resistant cells formed significantly more colonies than parental cells under osimertinib or gefitinib treatment (Fig. S1A), indicating reduced drug sensitivity. Consistent with these findings, CCK-8 assay, provided as supportive evidence, showed that the resistant cell lines had significantly higher IC50 values than their parental counterparts (Fig. S1B, C). Together, these results confirmed the successful establishment of acquired EGFR-TKI-resistant cell models.
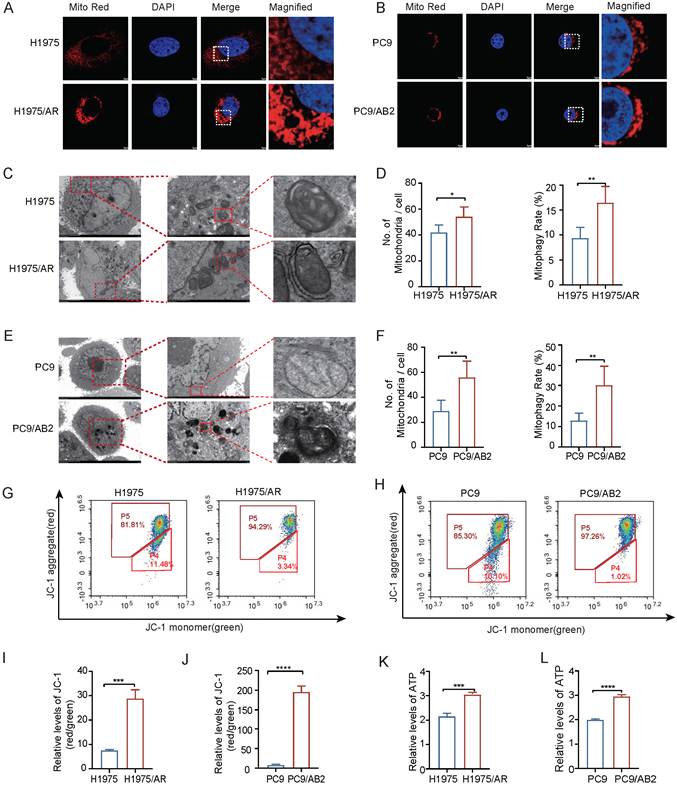
Next, mitochondrial parameters were compared between the resistant cell lines and their respective parental cells. Mito Tracker Red staining revealed increased mitochondrial fluorescence intensity in EGFR-TKI-resistant cells, suggesting enhanced mitochondrial membrane potential-dependent mitochondrial activity (Fig. 1A, B, and Fig. S1D, E). TEM analysis further showed that drug-resistant cells contained a greater number of mitochondria with relatively preserved ultrastructural integrity. In addition, quantitative ultrastructural evaluation revealed an increased frequency of mitophagy-related structures in resistant cells compared with their sensitive counterparts (Fig. 1C-F). Flow cytometry analysis of the mitochondrial membrane potential showed elevated membrane potential in the resistant cells compared to their parental counterparts (Fig. 1G-J). In addition, ATP production was higher in resistant cells (Fig. 1K, L). Taken together, these findings collectively indicate that EGFR-TKI-resistant NSCLC cells possess increased mitochondrial content and enhanced mitochondrial activity relative to their parental cells, prompting us to further investigate the role of mitophagy in maintaining mitochondrial homeostasis in resistant cells.
EGFR-TKI-resistant NSCLC cells display enhanced mitochondrial content and activity. (A, B) Representative Mito Tracker Red staining images showing increased mitochondrial fluorescence intensity in EGFR-TKI-resistant H1975/AR and PC9/AB2 cells compared with their parental counterparts. Scale bar, 5µm. (C-F) Transmission electron microscopy reveals differences in mitochondrial number and morphology between sensitive and resistant cells. Scale bar: C: 5µm and 1µm; E: 5µm and 2µm. (G-J) Comparison of the mitochondrial membrane potential between sensitive and resistant cells. (K, L) ATP production in sensitive and resistant cells. (mean±SD, n=3, *p<0.05, **p<0.01, ***p<0.001).
FAT1 expression is significantly upregulated in EGFR-TKI-resistant NSCLC cells
In the publicly available GEO database, the following observations were made (Fig. S1F): FAT1 expression was significantly higher in EGFR-TKI-resistant cell lines than in sensitive cell lines (GSM5239638 and GSM5239639 represent paired parental osimertinib-sensitive and resistant cells, while GSM5239640 and GSM5239641 represent paired parental gefitinib-sensitive and resistant cells). In addition, analysis of high and low FAT1 expression data revealed significant enrichment of FAT1 expression in several biological processes and cellular components, such as the estrogen metabolic process and mitochondrial protein-containing complexes (Fig. S1G). To build on these findings, western blot and RT-PCR assays were performed to analyze the differences in FAT1 protein and mRNA expression between sensitive and resistant cell lines. The results revealed that FAT1 mRNA and protein levels were significantly higher in the H1975/AR and PC9/AB2 resistant cell lines than in their sensitive counterparts (H1975 and PC9) (Fig. 2A, B).
FAT1 is upregulated in EGFR-TKI-resistant NSCLC cells and promotes malignant phenotypes. (A, B) FAT1 expression is elevated in resistant cells. (C, D) Validation of FAT1 knockdown. (E, F) Colony formation assays showing that FAT1 depletion reduces clonogenic survival of resistant cells under EGFR-TKI treatment, indicating restored drug sensitivity. (G) Apoptosis is enhanced in resistant FAT1-knockdown cells. (H) Western blot analysis of apoptosis-related proteins. (I, J) FAT1 knockdown slows proliferation in resistant cells. (K-N) FAT1 knockdown reduces migration and invasion in resistant cells. Scale bar: 100µm. (mean ± SD, n=3, *p<0.05, ***p<0.001, ****p<0.0001).
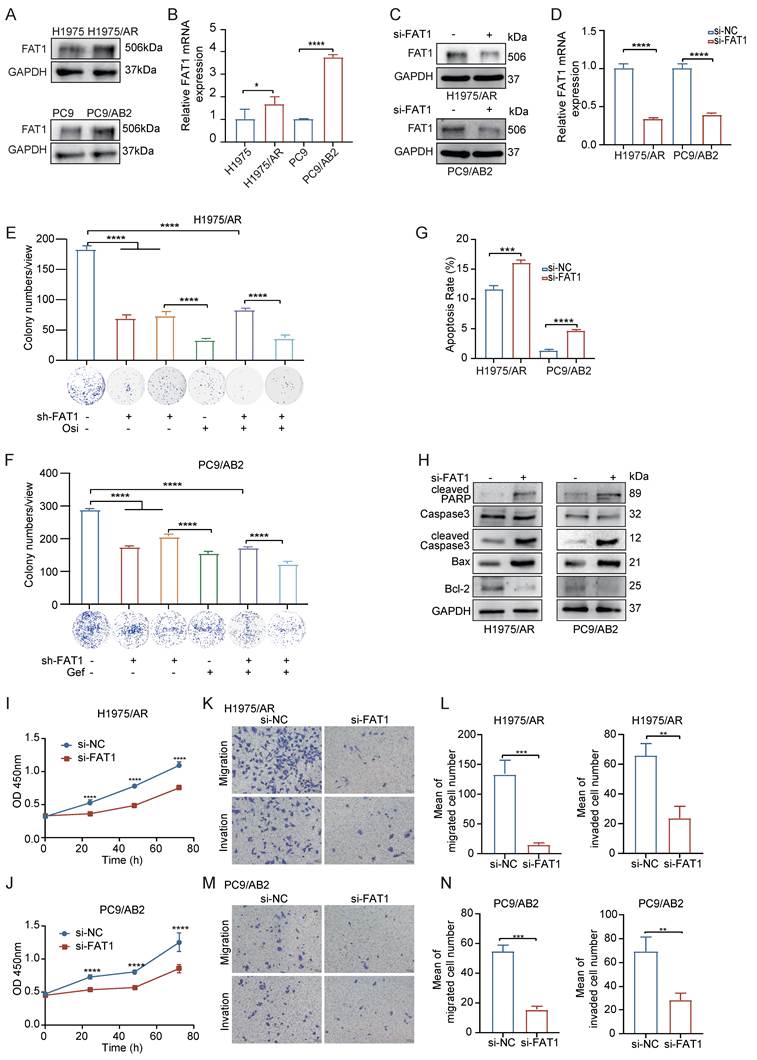
To investigate the functional role of FAT1, we conducted FAT1 knockdown experiments in the resistant cells (Fig. 2C, D). FAT1 depletion markedly reduced colony formation in resistant cells in the presence of EGFR-TKIs, indicating restored drug sensitivity (Fig. 2E, F). Consistent with these results, CCK-8 assay also suggested that FAT1 knockdown increased the sensitivity of NSCLC EGFR-TKI-resistant cells to EGFR-TKIs (Fig. S1H). Apoptosis assays further showed elevated apoptosis rates following FAT1 knockdown. This was evidenced by increased cleavage of caspase-3 and PARP, while total caspase-3 levels remained largely unchanged. In addition, alterations in the expression of BCL-2 and BAX proteins were observed (Fig. 2G, H). In addition, FAT1 knockdown slowed cell proliferation (Fig. 2I, J) and reduced the migration and invasion capabilities (Fig. 2K-N) of the resistant cells. These findings confirm that FAT1 is significantly upregulated in EGFR-TKI-resistant NSCLC cells and likely serves a crucial function in sustaining drug resistance and promoting malignant cellular behaviors.
Knockdown of FAT1 induces mitochondrial dysfunction in resistant cells
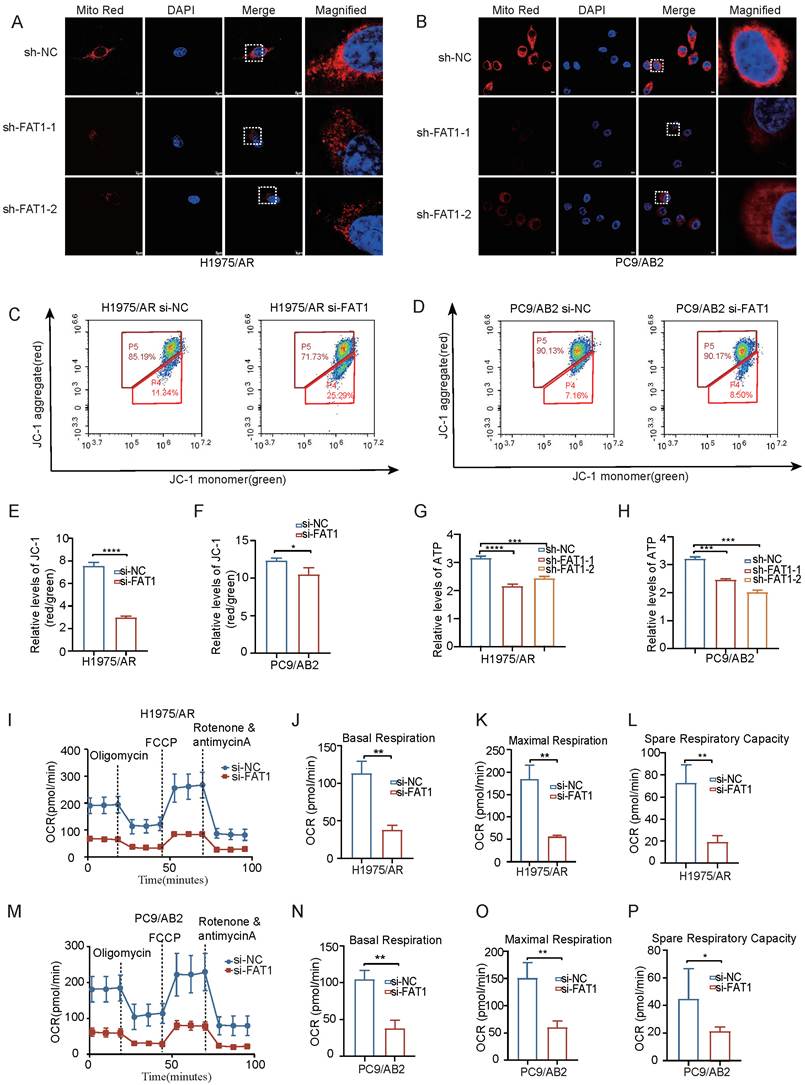
Cao et al. [25] reported that FAT1 colocalizes with mitochondria and modulates cellular functions by regulating mitochondrial stability. Consistent with this observation, confocal microscopy showed partial colocalization of FAT1 with Mito Tracker Red-labeled mitochondria in EGFR-TKI-resistant NSCLC cells (Fig. S2A). We next investigated whether FAT1 depletion affects mitochondrial function in resistant cells, Mito Tracker Red staining revealed reduced fluorescence intensity following FAT1 knockdown, indicating decreased membrane potential-dependent mitochondrial fluorescence (Fig. 3A, B, and Fig. S2B, C). Flow cytometry analysis using JC-1 staining showed that FAT1 knockdown reduced mitochondrial membrane potential in resistant cells (Fig. 3C-F). Moreover, FAT1 knockdown resulted in reduced ATP production (Fig. 3G, H). OCR assays revealed that FAT1 knockdown significantly reduced mitochondrial respiratory function in EGFR-TKI-resistant cells, as evidenced by decreased basal respiration and impaired maximal respiratory capacity (Fig. 3I-P). Thus, loss of FAT1 impairs both basal and reserve respiratory capacity, highlighting its critical role in maintaining mitochondrial bioenergetics in drug-resistant cells. Collectively, these results suggest that FAT1 is overexpressed and associated with enhanced mitochondrial function in EGFR-TKI-resistant NSCLC cells. Knockdown of FAT1 induces mitochondrial damage and dysfunction in the resistant NSCLC cells.
FAT1 maintains mitochondrial functional stability in drug resistant cells. (A, B) Representative MitoTracker Red staining images showing reduced mitochondrial fluorescence intensity in resistant cells after FAT1 knockdown. Scale bar: 20µm. (C-F) JC-1 flow cytometry plots showing decreased mitochondrial membrane potential after FAT1 knockdown. (G, H) Decreased ATP production following FAT1 knockdown. (I-P) Reduced oxygen consumption rate (OCR) following FAT1 knockdown. (mean±SD, n=3, *p<0.05, **p<0.01, ***p<0.001).
FAT1 knockdown induces mitochondrial ROS accumulation and ROS scavenger reduces the sensitivity of NSCLC cells to EGFR-TKIs
Mitochondrial damage can lead to the production of ROS, potentially causing oxidative stress and disrupting cellular homeostasis. We thus assessed total ROS levels and mitochondrial ROS (mROS) levels in EGFR-TKI-sensitive and EGFR-TKI-resistant NSCLC cells using flow cytometry and immunofluorescence staining. Immunofluorescence staining confirmed that mROS production was lower in EGFR-TKI-resistant cells than in EGFR-TKI-sensitive NSCLC cells (Fig. S2D-G), indicating better mitochondrial functionality in resistant cells. Similarly, total ROS production was reduced in EGFR-TKI-resistant cells (Fig. S2H, I), as determined using flow cytometry. Following FAT1 knockdown, an increase was found in the levels of both mROS (Fig. 4A and Fig. S2J, K) and total ROS (Fig. 4B, C) in EGFR-TKI-resistant NSCLC cells with both immunofluorescence and flow cytometry. These results suggest that FAT1 deficiency induces ROS accumulation and disrupts mitochondrial integrity.
ROS is a critical mediator of FAT1-induced drug resistance. (A) Knockdown of FAT1 increases mROS levels. Scale bar, 5µm. (B, C) Knockdown of FAT1 elevates total cellular ROS levels. (D, E) EGFR-TKIs induced mitochondrial ROS accumulation in FAT1-knockdown cells is reversed by NAC. Scale bar, 5µm. (F, G) Colony formation assays showing that NAC partially restores clonogenic survival reduced by FAT1 knockdown under EGFR-TKI treatment. (H-K) TKI-induced apoptosis in FAT1-knockdown cells is reversed by NAC, and western blot analysis of apoptosis-related protein markers. (Osi: 5µM, Gef: 3µM, NAC: 5mM, mean±SD, n=3, *p<0.05, **p<0.01, ***p<0.001).
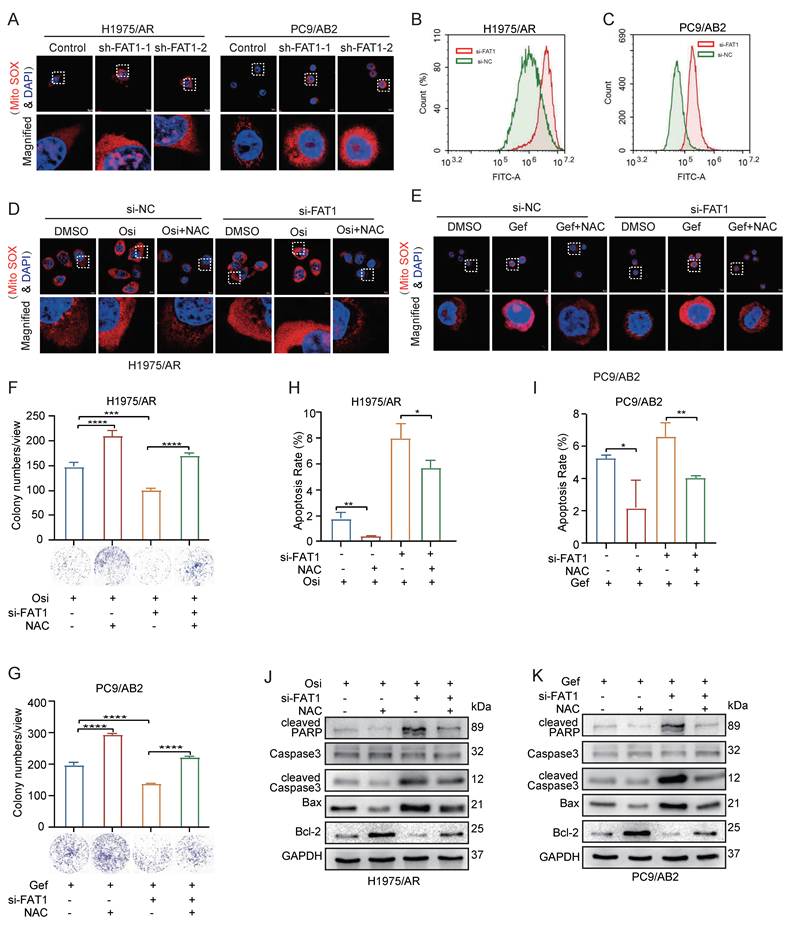
To determine whether FAT1-mediated EGFR-TKI resistance in NSCLC is dependent on mROS production, we used the ROS scavenger NAC to evaluate the impact of mROS on sensitivity to EGFR-TKIs. Following FAT1 knockdown, immunofluorescence staining revealed that EGFR-TKI treatment led to increased mROS fluorescence intensity in both the control and knockdown groups, indicating that EGFR-TKIs induce mitochondrial damage and elevate mROS levels. However, treatment with NAC effectively reduced mROS production in all groups (Fig. 4D, E and Fig. S2L, M), demonstrating that NAC reduces FAT1 knockdown-induced mROS accumulation and partially restores EGFR-TKI resistance.
To further determine whether FAT1-mediated EGFR-TKI resistance depends on mROS regulation, we assessed drug sensitivity after FAT1 knockdown and subsequent NAC treatment using a colony formation assay. FAT1 depletion markedly reduced clonogenic survival of resistant cells under EGFR-TKI treatment (Fig. 4F, G), whereas NAC treatment partially restored colony formation, indicating that the enhanced drug sensitivity caused by FAT1 knockdown could be reversed by ROS scavenging. Consistent with these findings, CCK-8 assay showed a similar trend (Fig. S2N). In addition, FAT1 knockdown significantly enhanced EGFR-TKI-induced apoptosis, as evidenced by increased cleavage of caspase-3 and PARP, while total caspase-3 levels remained largely unchanged. This pro-apoptotic effect was further supported by a notable upregulation of the pro-apoptotic protein BAX and a concurrent decrease in the anti-apoptotic protein BCL-2. Flow cytometric quantification of apoptotic cell populations consistently validated these molecular changes. Notably, NAC treatment attenuated the apoptosis induced by FAT1 knockdown (Fig. 4H-K). These findings demonstrate that NAC effectively reverses the increased EGFR-TKI sensitivity caused by FAT1 knockdown, indicating that a FAT1-induced reduction in mROS is a critical factor driving EGFR-TKI resistance in NSCLC cells.
FAT1 maintains mitophagy and enhances EGFR-TKI-resistance of NSCLC cells
Damaged mitochondria can produce large amounts of ROS while simultaneously emitting self-clearance signals through mitophagy. FAT1 deficiency induces the accumulation of total ROS and mROS, leading to cellular and mitochondrial damage. Based on these findings, we hypothesized that the FAT1 deficiency-induced elevation in mROS may potentially result from defective mitophagy-mediated regulation, which could partially contribute to altered EGFR-TKI sensitivity in NSCLC cells. To investigate this, we examined mitophagy-related markers. First, to confirm that the cell lines used in this study are capable of mitophagy, we induced mitophagy using the mitochondrial uncoupler CCCP. The results showed that CCCP treatment significantly enhanced the colocalization of LC3B and Mito Tracker Red (Fig. S3A-C). Concurrently, Western blot analysis confirmed that CCCP effectively increased the protein level of LC3B (Fig. S3D). In parallel, mito-Keima analysis further demonstrated that CCCP treatment increased mitochondrial delivery to acidic lysosomal compartments, providing additional evidence for mitophagy activation (Fig. S3E, F). Building upon this validated experimental system, we further compared mitophagy activity between sensitive and resistant cells, as well as under FAT1 knockdown and EGFR-TKI treatment conditions. Resistant cells exhibited a significantly higher LC3B-Mito Tracker Red colocalization coefficient than sensitive cells, indicating enhanced recruitment of autophagic machinery to mitochondria (Fig. 5A and Fig. S3G). Consistently, mito-Keima analysis further demonstrated that resistant cells displayed higher mitophagy activity than sensitive cells (Fig. 5B and Fig. S3H), supporting enhanced mitophagy in EGFR-TKI-resistant NSCLC cells. In resistant cells, FAT1 knockdown significantly reduced the colocalization of LC3B with Mito Tracker Red, whereas EGFR-TKI treatment increased their colocalization coefficient (Fig. 5C, D, and Fig. S3I). Similarly, mito-Keima analysis showed that FAT1 knockdown suppressed, whereas EGFR-TKI treatment enhanced, mitophagy activity in resistant H1975/AR and PC9/AB2 cells (Fig. 5E, F, and Fig. S3J, K). Consistently, TEM revealed that FAT1 knockdown resulted in reduced mitochondrial numbers, swollen and deformed cristae, and fewer mitophagy-related ultrastructural events in resistant cells (Fig. 5G, H). Together, these findings indicate that mitophagy is enhanced in resistant NSCLC cells and that FAT1 is required for maintaining mitophagy in the resistant state.
FAT1 maintains mitophagy in EGFR-TKI-resistant NSCLC cells. (A) Immunofluorescence staining shows LC3B and Mito Tracker Red colocalization in sensitive and resistant NSCLC cells. Scale bar, 5µm. (B) mito-Keima analysis showing increased mitophagy activity in resistant cells compared with sensitive cells. Scale bar, 5µm. (C, D) Immunofluorescence analysis of LC3B and Mito Tracker Red colocalization in resistant cells following FAT1 knockdown and TKI treatment. Scale bar, 5µm. (E, F) Representative mito-Keima images showing altered mitophagy activity in resistant H1975/AR and PC9/AB2 cells under FAT1 knockdown and/or EGFR-TKI treatment. Scale bar, 5µm. (G, H) Transmission electron microscopy reveals mitochondrial alterations in FAT1-deficient cells. Scale bar, 5µm and 1µm. (I, J) Western blot analysis showing LC3B expression after FAT1 knockdown and TKI treatment. (K) Western blot analysis of LC3B expression after chloroquine (CQ) treatment. (Osi: 5µM, Gef: 3µM, CQ: 10µM, mean ± SD, n = 3, **p<0.01, ***p<0.001, ****p<0.0001).
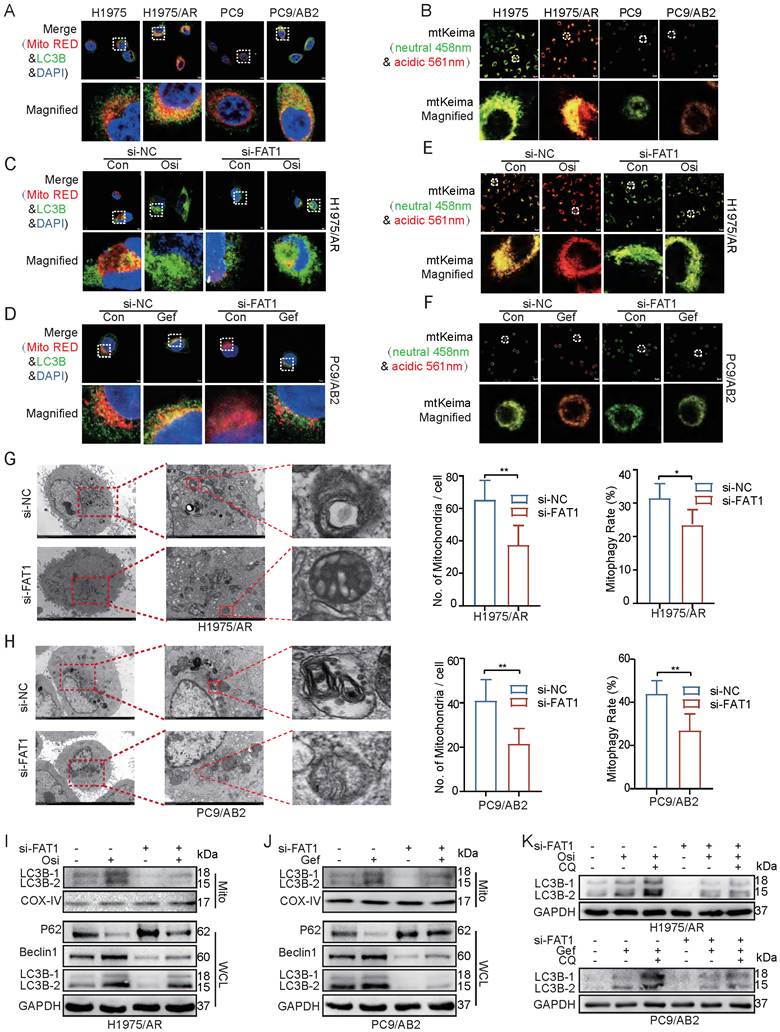
To further assess the role of FAT1 in mitophagy, we analyzed autophagy related proteins in both whole-cell lysates and isolated mitochondrial fractions. In whole cell lysates from EGFR-TKI-resistant cells, FAT1 knockdown was accompanied by changes in LC3B, Beclin-1, and p62 levels, suggesting that general autophagy may also be affected. In contrast, mitochondrial fraction analysis showed reduced mitochondrial LC3B levels after FAT1 knockdown, consistent with impaired mitophagy. EGFR-TKI treatment was associated with increased LC3B levels under the indicated conditions (Fig. 5I, J). In addition, chloroquine (CQ), which blocks autophagosome and lysosome fusion, caused LC3B accumulation, and LC3B levels were further increased under combined CQ treatment, FAT1 knockdown, and EGFR-TKI exposure (Fig. 5K). Together with the Mito Tracker Red-LC3B colocalization, mito-Keima analysis, mitochondrial LC3B accumulation, and TEM observations, these results provide strong evidence that FAT1 maintains mitophagy in resistant NSCLC cells.
To validate the hypothesis that mitophagy regulates ROS production and subsequently modulates EGFR-TKI sensitivity in NSCLC cells, we treated both control and FAT1-knockdown groups with CQ and NAC and assessed the sensitivity of the cells to EGFR-TKIs. Together, these findings support that mitophagy-mediated control of mROS contributes to FAT1-dependent EGFR-TKI resistance in NSCLC cells, whereas the addition of NAC partially reversed this effect (Fig. S4A, B). Consistent with these results, CCK-8 assay also showed the same trend (Fig. S4C). Flow cytometric analysis further demonstrated that CQ treatment increased apoptosis in resistant cells, which was similarly attenuated by NAC (Fig. S4D, E). Western blot analysis of apoptosis-related markers showed that the CQ-induced increase in apoptosis was accompanied by increased cleaved caspase-3 and cleaved PARP levels, increased BAX, and decreased BCL-2, and these effects were mitigated by NAC treatment (Fig. S4F, G). Together, these findings support that mitophagy-mediated control of mROS contributes to FAT1-dependent EGFR-TKI resistance in NSCLC cells.
FAT1 depletion promotes K48-linked ubiquitination and destabilization of PINK1
To investigate the downstream targets of FAT1 in its regulation of mitophagy, we focused on three key pathways implicated in mitophagy: PINK1/Parkin, BNIP3/NIX, and FUNDC1-mediated pathways [33]. Co-immunoprecipitation analysis showed that FAT1 and PINK1 co-immunoprecipitated in resistant NSCLC cells (Fig. 6A, B), indicating an association between the two proteins within a protein complex, and FAT1 knockdown significantly reduced PINK1 expression (Fig. 6C). To assess the impact of FAT1 on PINK1 protein stability, we used the proteasome inhibitor MG-132, finding that it restored PINK1 levels (Fig. 6D). In addition, application of the protein synthesis inhibitor cycloheximide (CHX) demonstrated that the half-life of PINK1 protein was significantly shortened following FAT1 knockdown (Fig. 6E, F and Fig. S5A, B). These results indicate that FAT1 depletion reduces PINK1 protein stability through a proteasome-dependent mechanism. Further analysis revealed that FAT1 knockdown significantly increased PINK1 ubiquitination (Fig. 6G).
FAT1 promotes PINK1 stability and regulates EGFR-TKI resistance. (A, B) Immunoprecipitation (IP) assays demonstrate the interaction between FAT1 and PINK1. (C) Knockdown of FAT1 reduces PINK1 expression. (D) The proteasome inhibitor MG-132 increases PINK1 levels. (E, F) Cycloheximide (CHX) reveals a shorter PINK1 half-life after FAT1 knockdown. (G) FAT1 knockdown increases the ubiquitination of PINK1. (H) FAT1 knockdown selectively enhances the K48-linked, but not K63-linked, ubiquitination of PINK1. (I) K48R ubiquitin mutant abolishes the increase in PINK1 ubiquitination induced by FAT1 knockdown, whereas PINK1 ubiquitination remains increased after FAT1 knockdown in the presence of the K63R ubiquitin mutant. (J, K) Colony formation assays showing that knockdown of FAT1 or PINK1 enhances EGFR-TKI sensitivity, with a stronger effect observed after combined knockdown. (mean±SD, n=3, ns p>0.05, ****p<0.0001).
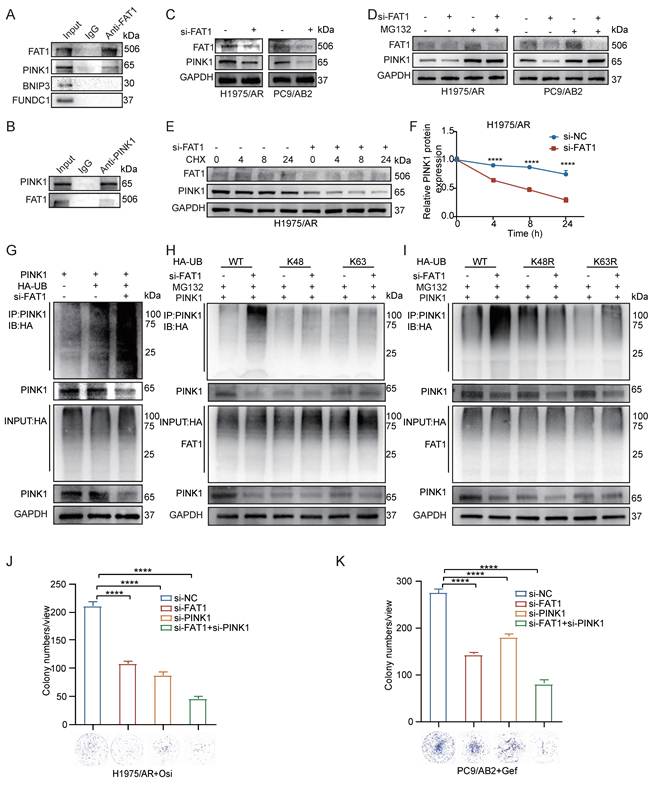
To characterize the ubiquitin linkage associated with FAT1-dependent changes in PINK1 stability, we examined ubiquitin linkage types. FAT1 knockdown increased the K48-linked ubiquitination of PINK1, while K63 ubiquitin chains remained unaffected (Fig. 6H). Mutational analysis further demonstrated that the K48R mutant abolished the increase in PINK1 ubiquitination caused by FAT1 knockdown, whereas the K63R mutant showed no significant effect, suggesting that FAT1 depletion promotes PINK1 destabilization in association with increased K48-linked ubiquitination (Fig. 6I). These findings indicate that K48-linked ubiquitination is involved in FAT1-associated regulation of PINK1 stability. Consistently, loss of FAT1 or PINK1 reduced LC3B-Mito Tracker Red colocalization, and this reduction was more pronounced in the combined knockdown group (Fig. S5C, D). These results were further supported by western blot analysis of autophagy-related markers (Fig. S5E). In parallel, colony formation assays demonstrated that knockdown of either FAT1 or PINK1 enhanced the sensitivity of resistant NSCLC cells to EGFR-TKIs, with the combined knockdown showing a stronger inhibitory effect on clonogenic survival (Fig. 6J, K). Consistent with these findings, CCK-8 assay also indicated increased drug sensitivity after FAT1 or PINK1 knockdown (Fig. S5F). Together, these findings indicate that FAT1 depletion is associated with increased K48-linked ubiquitination and reduced stability of PINK1, accompanied by impaired mitophagy and enhanced EGFR-TKI sensitivity. These observations prompted us to investigate the deubiquitinase responsible for regulating PINK1 stability downstream of FAT1-associated signaling.
FAT1 modulates PINK1 stability through USP38-mediated deubiquitination
Our findings suggested that FAT1-mediated regulation of PINK1 ubiquitination contributes to EGFR-TKI resistance. To elucidate the molecular mechanism underlying FAT1-associated regulation of PINK1 stability, we performed a systematic screen of more than 40 deubiquitinases in EGFR-TKI-resistant cell lines following FAT1 knockdown. Using a screening threshold of fold change > 2.0, qRT-PCR analysis showed that FAT1 depletion markedly reduced USP38 mRNA abundance in both resistant cell lines (Fig. 7A). Consistently, western blotting demonstrated a corresponding decrease in USP38 protein levels (Fig. 7B). These findings identified USP38 as a candidate downstream regulator associated with FAT1-dependent control of PINK1 stability and prompted us to further investigate the functional relationship between USP38 and PINK1. Under endogenous conditions, co-immunoprecipitation assays demonstrated a specific interaction between USP38 and PINK1 (Fig. 7C). Under exogenous overexpression conditions, co-immunoprecipitation assays further supported an interaction between USP38 and PINK1 (Fig. S6A, B). Immunofluorescence microscopy further supported their functional relationship, showing clear colocalization of USP38 and PINK1 in cells (Fig. S6C).
FAT1 modulates PINK1 stability through USP38-mediated deubiquitination. (A) qRT-PCR analysis showing changes in deubiquitinase expression after FAT1 knockdown. (B) FAT1 knockdown leads to decreased USP38 expression. (C) Immunoprecipitation (IP) reveals an interaction between PINK1 and USP38. (D) PINK1 expression is reduced following USP38 knockdown. (E) PINK1 expression is increased following USP38 overexpression. (F, G) The proteasome inhibitor MG-132 upregulates PINK1 levels. (H-K) USP38 prolongs the half-life of PINK1 protein. (L) USP38 knockdown increases PINK1 ubiquitination. (M) USP38 knockdown enhances the K48-linked ubiquitination of PINK1. (N) K48R ubiquitin mutant abolishes the USP38 knockdown-induced increase in PINK1 ubiquitination, whereas PINK1 ubiquitination remains increased after USP38 knockdown in the presence of the K63R ubiquitin mutant. (O, P) Colony formation assays showing that USP38 knockdown sensitizes resistant cells to EGFR-TKIs and that this effect is reversed by PINK1 overexpression. (mean±SD, n=3, ****p<0.0001).
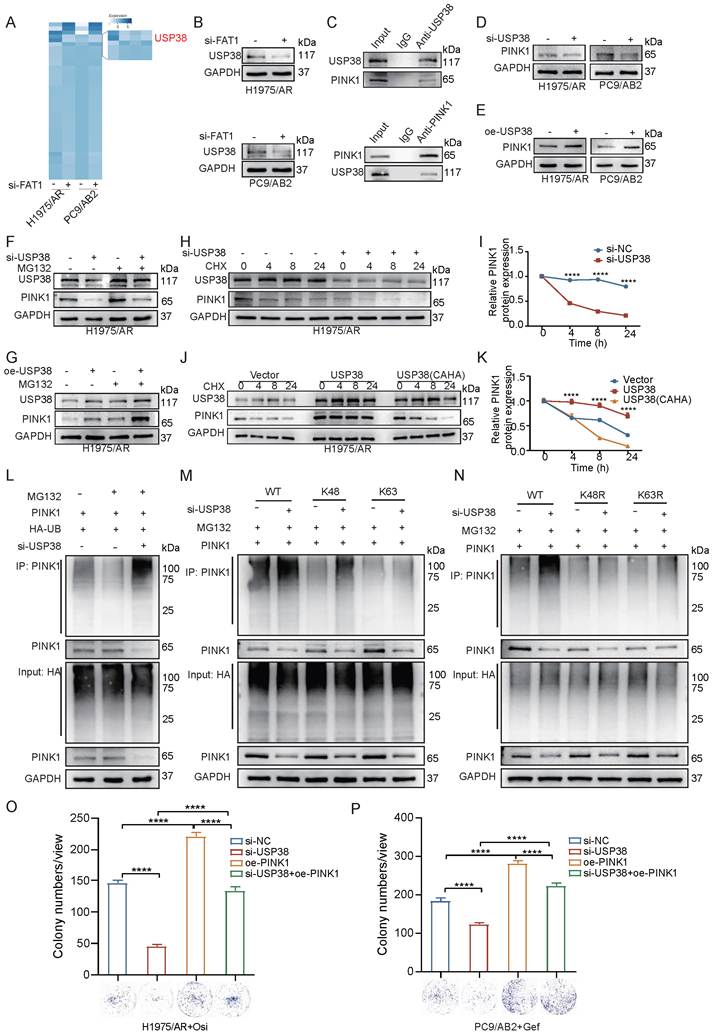
To determine the regulatory role of USP38 in PINK1 protein homeostasis, we modulated USP38 expression in both resistant cell lines (Fig. S6D-F). USP38 knockdown decreased PINK1 levels, while its overexpression increased PINK1 abundance (Fig. 7D, E). Importantly, MG-132 treatment restored PINK1 expression following USP38 knockdown (Fig. 7F). Conversely, USP38 overexpression increased PINK1 abundance, and PINK1 remained elevated in the presence of MG-132 (Fig. 7G and Fig. S6G), further supporting a proteasome-dependent mechanism of PINK1 regulation by USP38. CHX chase experiments demonstrated that USP38 depletion significantly reduced the half-life of PINK1, whereas USP38 overexpression prolonged it. The catalytically inactive USP38 mutant (CAHA) failed to stabilize PINK1, confirming the essential role of the deubiquitinase activity of USP38 (Fig. 7H-K and Fig. S6H, I). Ubiquitination assays provided mechanistic insights: USP38 knockdown enhanced PINK1 ubiquitination, while USP38 overexpression attenuated it. The USP38-CAHA mutant showed no effect on PINK1 ubiquitination, reinforcing the requirement for enzyme activity (Fig. 7L and Fig. S6J). Linkage-specific analysis identified K48-linked polyubiquitination as the predominant mechanism for USP38-mediated PINK1 stabilization (Fig. 7M, N). Functionally, USP38 knockdown sensitized both resistant cell lines to EGFR-TKIs, as demonstrated by reduced clonogenic survival in colony formation assays. This sensitization was reversed by PINK1 overexpression (Fig. 7O, P). Consistent with these findings, CCK-8 assay showed a similar trend (Fig. S6K), further supporting a functional relationship between the USP38-PINK1 axis and drug resistance. Taken together, these findings demonstrate that FAT1 modulates PINK1 protein stability through USP38-mediated K48-linked deubiquitination, thereby promoting EGFR-TKI resistance in NSCLC.
FAT1 knockdown potentiates tumor growth inhibition by EGFR-TKIs in xenograft models
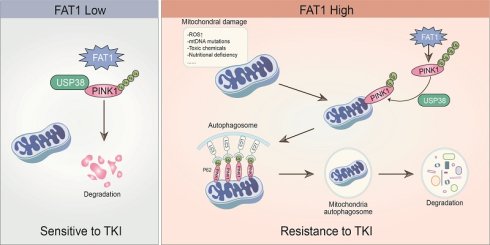
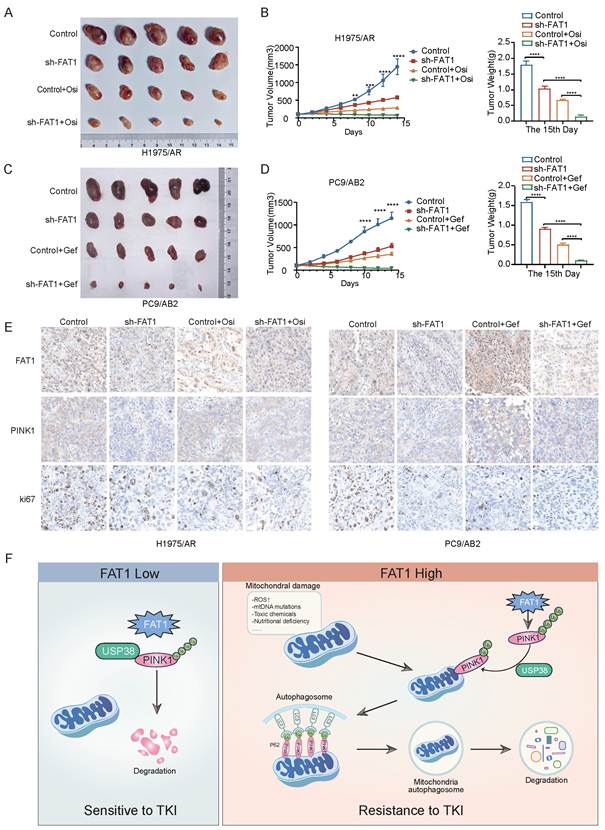
FAT1 expression is upregulated in EGFR-TKI-resistant NSCLC cells, which may contribute to resistance to EGFR-TKI therapy. To overcome EGFR-TKI resistance in cancer treatment, we tested the feasibility of combination therapy comprising FAT1 knockdown and EGFR-TKIs in a mouse xenograft model. We established subcutaneous tumor models in immunodeficient mice using either wild type or FAT1 knockdown EGFR-TKI-resistant NSCLC cells and treated the mice with EGFR-TKIs. In the mouse models, FAT1 knockdown significantly reduced tumor size and weight. Compared to FAT1 knockdown treatment alone, combination therapy with EGFR-TKIs further inhibited tumor growth and resulted in greater tumor growth inhibition (Fig. 8A-D). Immunohistochemical staining of mouse tumor tissues showed that, consistent with previous results, FAT1 knockdown led to decreased expression of PINK1, and the levels of the tumor proliferation marker Ki67 gradually decreased as the tumor volume shrank (Fig. 8E, and Fig. S7A-F). These findings demonstrate that FAT1 knockdown inhibits tumor proliferation in vivo and that, in combination with EGFR-TKI treatment, further decreases tumor volume. This highlights that FAT1 depletion may restore EGFR-TKI sensitivity in resistant cells. Taken together, these findings support a model in which FAT1 modulates PINK1 stability through USP38-mediated deubiquitination, thereby contributing to mitophagy and EGFR-TKI resistance in NSCLC (Fig. 8F).
In vivo Xenograft Model. (A-D) FAT1 knockdown combined with TKI treatment reduces tumor volume in mice. (E) Immunohistochemistry results showing FAT1, PINK1, and Ki67 expression in mouse tumor tissues. Scale bar, 50 µm. (F) A proposed model for the FAT1-USP38-PINK1 axis in regulating mitophagy and TKI resistance in NSCLC. (mean±SD, n=5, **p<0.01, ***p<0.001, ****p<0.0001).
Discussion
Lung cancer remains the leading cause of cancer-related mortality in China [34], and acquired resistance to EGFR-TKIs continues to be a major clinical challenge. Here, we demonstrate that FAT1 plays a pivotal role in sustaining mitochondrial homeostasis and contributes to EGFR-TKI resistance in NSCLC. Loss of FAT1 disrupts mitochondrial function and sensitizes resistant cells to EGFR-TKIs, highlighting FAT1 as a potential resistance-associated regulator. FAT1 is a multifunctional regulatory protein involved in diverse biological processes, including EMT, cell adhesion, and tumor progression. Although our study demonstrates that the FAT1/USP38/PINK1/mitophagy axis contributes to EGFR-TKI resistance, we cannot completely exclude the possibility that other FAT1-regulated pathways may also participate in the proliferation and migration phenotypes observed after FAT1 depletion. Further studies are required to elucidate the relative contribution of different FAT1-associated signaling pathways in EGFR-TKI resistance.
Mitophagy serves as a core mechanism for maintaining organelle quality control [35] and plays a critical yet complex role in the response of tumor cells to treatment stress. Emerging evidence highlights the pivotal role of mitophagy in tumor development and therapy resistance and has linked enhanced mitophagy to resistance to cancer cell drugs [36, 37]. For instance, Glytsou et al. [38] demonstrated that MARCH5 promotes resistance to BH3 mimetics, a class of therapeutic agents that bind to and mimic the BH3 domain of BCL-2 family proteins, inhibiting their anti-apoptotic function and restoring apoptosis in cancer cells. The study further revealed that MARCH5 confers resistance by regulating MFN2-mediated mitophagy and mitochondrial quality control, suggesting that inhibition of mitophagy may provide a promising approach to reverse such resistance. Similarly, the CRL4CUL4A/DDB1 complex is significantly upregulated in cisplatin-resistant ovarian cancer cells. Knockdown of CRL4CUL4A/DDB1 induces mitochondrial dysfunction, triggers mitophagy, and suppresses cell proliferation in resistant ovarian cancer cells, indicating that CRL4CUL4A/DDB1 regulates chemoresistance in these cells by modulating mitochondrial dynamics and mitophagy [39]. In our study, we found enhanced mitochondrial function in NSCLC cells with acquired resistance to EGFR-TKIs. In addition, elevated mitophagy enhanced the resistance of NSCLC cells to EGFR-TKIs. Treatment with CQ, an autophagy inhibitor, markedly reversed EGFR-TKI resistance, confirming that mitophagy inhibition can effectively restore drug sensitivity. Together with previous results indicating that induction of mitophagy acts as a cytoprotective mechanism in resistant cells, we believe that targeted disruption of this process represents a promising therapeutic strategy to overcome acquired resistance to EGFR-TKIs.
Mitophagy and mROS together form a tightly interconnected adaptive regulatory network that contributes to the development of tumor drug resistance [40]. By selectively removing dysfunctional mitochondria, mitophagy restricts the excessive production of mROS, thereby preventing its accumulation to apoptosis-inducing toxic levels [41]. It also recycles organellar components to support energy metabolism, which promotes tumor cell survival under therapeutic pressure [42, 43]. However, this protective mechanism inadvertently facilitates the emergence of drug resistance. Our findings revealed that low levels of mROS in resistant cells are associated with enhanced mitochondrial function. Treatment with the ROS scavenger NAC enhanced EGFR-TKI resistance, further supporting the protective role of mROS control. These results align with previous studies indicating that moderate mROS levels promote cell survival, whereas excessive mROS triggers apoptosis [44, 45]. Notably, our data highlight the dual role of mROS in EGFR-TKI resistance and underscore that maintaining redox homeostasis is essential for the survival of resistant cells.
We found that FAT1 plays a central role in mediating mitochondrial function and mitophagy and enhancing resistance to EGFR-TKIs in lung cancer cells. FAT1, functioning as either a tumor suppressor or oncogene, plays important roles in cancer development. Its expression is significantly upregulated in hepatocellular carcinoma tissues [46] but markedly downregulated in esophageal squamous cell carcinoma [47] compared to normal tissues. Studies have shown the involvement of FAT1 in CDK4/6 inhibitor resistance in breast cancer treatment [48]. However, the specific mechanisms of FAT1 in EGFR-TKI resistance, as well as the therapeutic potential of targeting FAT1 to overcome EGFR-TKI resistance, remain to be elucidated. Our findings demonstrate that FAT1 is significantly upregulated in EGFR-TKI-resistant NSCLC cells. FAT1-deficient resistant cells exhibit features of mitochondrial dysfunction, including reduced membrane potential, impaired mitophagy, and accumulated ROS, indicating that FAT1 exerts a protective role in drug-resistant NSCLC cells. Moreover, we demonstrated that FAT1 maintains the EGFR-TKI-resistant phenotype by regulating mROS homeostasis through mitophagy. The reversal of sensitization by NAC further confirms mROS as a critical determinant of EGFR-TKI resistance.
Specifically, we found that FAT1 plays a central role in mediating mitochondrial function and mitophagy by regulating the deubiquitination process. Mechanistically, our findings identify USP38 as an important component linking FAT1-associated regulation to PINK1 stability. FAT1 depletion increased K48-linked ubiquitination of PINK1 and shortened its protein half-life, indicating enhanced proteasomal turnover of PINK1. Screening of deubiquitinases further revealed a consistent reduction in USP38 mRNA and protein levels following FAT1 depletion. Subsequent functional analyses demonstrated that USP38 associates with PINK1 and preserves PINK1 protein stability by limiting K48-linked ubiquitination, whereas the catalytically inactive USP38 mutant failed to exert this protective effect. Together, these findings support a FAT1-USP38-PINK1 regulatory axis in which FAT1-associated maintenance of USP38 abundance contributes to PINK1 stabilization, while USP38 serves as the enzymatic regulator of PINK1 deubiquitination. Sustained PINK1 stability may thereby promote mitophagy and mitochondrial quality control, ultimately supporting the survival of EGFR-TKI-resistant NSCLC cells. Notably, USP30 is an established regulator of the PINK1/Parkin pathway [49]. However, USP30 expression was not substantially altered in our DUB screen following FAT1 depletion, suggesting that USP38 may represent an additional PINK1-regulatory deubiquitinase in this experimental context. Our study demonstrates that FAT1 enhances mitophagy by promoting USP38-mediated stabilization of PINK1 protein. This stabilization antagonizes K48-linked ubiquitination and proteasomal degradation of PINK1, thereby maintaining efficient mitochondrial quality control.
Several limitations of this study should be acknowledged. First, although our findings demonstrate that FAT1 contributes to EGFR-TKI resistance in experimental models, the clinical relevance of FAT1 in EGFR-TKI-treated patients requires further validation. Currently, publicly available datasets with comprehensive information on EGFR mutation status, EGFR-TKI treatment response, and FAT1 expression are limited, preventing direct evaluation of FAT1 as a predictive biomarker for EGFR-TKI resistance. Future studies using well-annotated clinical cohorts are needed to determine whether FAT1 expression can predict therapeutic response or clinical outcomes in patients receiving EGFR-TKI therapy. Second, although FAT1 depletion reduced both USP38 mRNA abundance and protein levels, suggesting that FAT1 may act upstream of USP38, the specific signaling mechanisms underlying this regulation remain to be elucidated. FAT1 has been implicated in several signaling pathways, including Hippo/YAP, Wnt/β-catenin, and MAPK/ERK, which may potentially contribute to the regulation of USP38 expression. Further studies are warranted to determine whether these pathways participate in the FAT1-dependent regulation of USP38. Meanwhile, co-immunoprecipitation assays demonstrated an interaction between FAT1 and PINK1; however, the molecular nature and functional significance of this interaction within the FAT1-USP38-PINK1 regulatory axis remain incompletely understood. In particular, whether FAT1 directly binds PINK1 or exerts a scaffolding role in facilitating the formation of the USP38-PINK1 complex warrants further investigation. Despite these limitations, our findings support a FAT1-associated mitochondrial regulatory pathway in which FAT1 modulates USP38-mediated stabilization of PINK1, thereby contributing to enhanced mitophagy and EGFR-TKI resistance in NSCLC. These findings extend the current understanding of acquired EGFR-TKI resistance beyond canonical genetic alterations by highlighting mitochondrial quality control and redox homeostasis as important components of the resistant phenotype. Although further studies are required to clarify the precise molecular regulation of the FAT1-USP38-PINK1 axis, validate its clinical relevance, and determine whether FAT1 or its downstream effectors can be effectively targeted, modulation of this pathway may represent a potential strategy for restoring EGFR-TKI sensitivity. Further investigation of FAT1-associated mitophagy and its therapeutic tractability may therefore provide new opportunities for overcoming acquired EGFR-TKI resistance in NSCLC.
Conclusion
In summary, our findings identify a FAT1-USP38-PINK1 regulatory axis associated with mitochondrial homeostasis and acquired EGFR-TKI resistance in NSCLC. FAT1 depletion reduced USP38 abundance, whereas USP38 stabilized PINK1 through K48-linked deubiquitination, thereby supporting mitophagy and redox homeostasis in resistant cells. The resulting maintenance of mitochondrial integrity and the redox balance enables cancer cells to evade EGFR-TKI-induced stress. Genetic depletion of FAT1, together with modulation of autophagy and ROS pathways, resensitizes resistant tumors to EGFR-TKIs in vitro and in vivo. These findings not only elucidate a novel molecular mechanism underlying EGFR-TKI resistance but also highlight the therapeutic potential of disrupting mitochondrial quality control pathways in combination with existing targeted therapies. Future efforts to develop specific strategies targeting FAT1-associated pathways or downstream effectors may provide a promising approach to overcome resistance and improve outcomes in EGFR-mutant NSCLC patients.
Supplementary Material
Supplementary methods and figures.

Acknowledgements
Funding
This work was supported by National Natural Science Foundation of China (82473191 and 82172569), Tianjin Key Medical Discipline Construction Project (TJYXZDXK-3-002B, TJYXZDXK-3-006A-2), Natural Science Foundation of Tianjin (23JCZDJC00710, 24JCYBJC00330, 23JCYBJC01010), Beijing Science and Technology Innovation Medical Development Fund grant (KC2023-JX-0288-PZ78). Funding sources had no role in study design, data collection, and analysis; in the decision to publish; or in the preparation of the manuscript.
Data availability statement
The original contributions presented in the study are included in the article. Further inquiries can be directed to the corresponding authors.
Ethics approval and compliance
All animal experiments were approved by the institutional animal care and use committee of Tianjin Medical University General Hospital and were conducted in strict accordance with the institutional guidelines and the Chinese Council on Animal Research Guidelines for the Care and Use of Laboratory Animals. The maximum permitted tumor volume (2000 mm³) set by the ethics committee was strictly observed throughout the study.
Authorship contribution statement
Chen Ding: Writing - original draft, Project administration, Methodology, Data curation. Hua Huang: Writing - review & editing, Supervision, Conceptualization, Formal analysis. Zexia Zhao: Supervision, Investigation, Methodology. Wenhao Zhao: Supervision, Formal analysis, Data curation. Xuanguang Li: Formal analysis, Data curation. Hongbing Zhang: Data curation, Conceptualization. Minghui Liu: Data curation, Conceptualization. Chen Chen: Methodology. Yongwen Li: Supervision, Investigation. Hongyu Liu: Writing - review & editing, Project administration, Data curation. Jun Chen: Supervision, Funding acquisition, Formal analysis.
Competing Interests
The authors have declared that no competing interests exist.
References
1. Leiter A, Veluswamy RR, Wisnivesky JP. The global burden of lung cancer: current status and future trends. Nat Rev Clin Oncol. 2023;20:624-39
2. Meyer ML, Fitzgerald BG, Paz-Ares L, Cappuzzo F, Janne PA, Peters S. et al. New promises and challenges in the treatment of advanced non-small-cell lung cancer. Lancet. 2024;404:803-22
3. Wang M, Herbst RS, Boshoff C. Toward personalized treatment approaches for non-small-cell lung cancer. Nat Med. 2021;27:1345-56
4. Lynch TJ, Bell DW, Sordella R, Gurubhagavatula S, Okimoto RA, Brannigan BW. et al. Activating mutations in the epidermal growth factor receptor underlying responsiveness of non-small-cell lung cancer to gefitinib. N Engl J Med. 2004;350:2129-39
5. Maemondo M, Inoue A, Kobayashi K, Sugawara S, Oizumi S, Isobe H. et al. Gefitinib or chemotherapy for non-small-cell lung cancer with mutated EGFR. N Engl J Med. 2010;362:2380-8
6. Zhou C, Wu YL, Chen G, Feng J, Liu XQ, Wang C. et al. Erlotinib versus chemotherapy as first-line treatment for patients with advanced EGFR mutation-positive non-small-cell lung cancer (OPTIMAL, CTONG-0802): a multicentre, open-label, randomised, phase 3 study. Lancet Oncol. 2011;12:735-42
7. Soria JC, Ohe Y, Vansteenkiste J, Reungwetwattana T, Chewaskulyong B, Lee KH. et al. Osimertinib in Untreated EGFR-Mutated Advanced Non-Small-Cell Lung Cancer. N Engl J Med. 2018;378:113-25
8. Wu SG, Shih JY. Management of acquired resistance to EGFR TKI-targeted therapy in advanced non-small cell lung cancer. Mol Cancer. 2018;17:38
9. Passaro A, Janne PA, Mok T, Peters S. Overcoming therapy resistance in EGFR-mutant lung cancer. Nat Cancer. 2021;2:377-91
10. Rotow J, Bivona TG. Understanding and targeting resistance mechanisms in NSCLC. Nat Rev Cancer. 2017;17:637-58
11. Hsu WH, Yang JC, Mok TS, Loong HH. Overview of current systemic management of EGFR-mutant NSCLC. Ann Oncol. 2018;29:i3-i9
12. Sequist LV, Waltman BA, Dias-Santagata D, Digumarthy S, Turke AB, Fidias P. et al. Genotypic and histological evolution of lung cancers acquiring resistance to EGFR inhibitors. Sci Transl Med. 2011;3:75ra26
13. Wolf J, Seto T, Han JY, Reguart N, Garon EB, Groen HJM. et al. Capmatinib in MET Exon 14-Mutated or MET-Amplified Non-Small-Cell Lung Cancer. N Engl J Med. 2020;383:944-57
14. Wang S, Tsui ST, Liu C, Song Y, Liu D. EGFR C797S mutation mediates resistance to third-generation inhibitors in T790M-positive non-small cell lung cancer. J Hematol Oncol. 2016;9:59
15. Chmielecki J, Gray JE, Cheng Y, Ohe Y, Imamura F, Cho BC. et al. Candidate mechanisms of acquired resistance to first-line osimertinib in EGFR-mutated advanced non-small cell lung cancer. Nat Commun. 2023;14:1070
16. Bean J, Brennan C, Shih JY, Riely G, Viale A, Wang L. et al. MET amplification occurs with or without T790M mutations in EGFR mutant lung tumors with acquired resistance to gefitinib or erlotinib. Proc Natl Acad Sci U S A. 2007;104:20932-7
17. Yoo HC, Park SJ, Nam M, Kang J, Kim K, Yeo JH. et al. A Variant of SLC1A5 Is a Mitochondrial Glutamine Transporter for Metabolic Reprogramming in Cancer Cells. Cell Metab. 2020;31:267-83 e12
18. Ji X, Yang Z, Li C, Zhu S, Zhang Y, Xue F. et al. Mitochondrial ribosomal protein L12 potentiates hepatocellular carcinoma by regulating mitochondrial biogenesis and metabolic reprogramming. Metabolism. 2024;152:155761
19. Panigrahi DP, Praharaj PP, Bhol CS, Mahapatra KK, Patra S, Behera BP. et al. The emerging, multifaceted role of mitophagy in cancer and cancer therapeutics. Semin Cancer Biol. 2020;66:45-58
20. Su L, Zhang J, Gomez H, Kellum JA, Peng Z. Mitochondria ROS and mitophagy in acute kidney injury. Autophagy. 2023;19:401-14
21. Wang Q, Zeng F, Sun Y, Qiu Q, Zhang J, Huang W. et al. Etk Interaction with PFKFB4 Modulates Chemoresistance of Small-cell Lung Cancer by Regulating Autophagy. Clin Cancer Res. 2018;24:950-62
22. Limagne E, Nuttin L, Thibaudin M, Jacquin E, Aucagne R, Bon M. et al. MEK inhibition overcomes chemoimmunotherapy resistance by inducing CXCL10 in cancer cells. Cancer Cell. 2022;40:136-52 e12
23. Peng Z, Gong Y, Liang X. Role of FAT1 in health and disease. Oncol Lett. 2021;21:398
24. Dunne J, Hanby AM, Poulsom R, Jones TA, Sheer D, Chin WG. et al. Molecular cloning and tissue expression of FAT, the human homologue of the Drosophila fat gene that is located on chromosome 4q34-q35 and encodes a putative adhesion molecule. Genomics. 1995;30:207-23
25. Cao LL, Riascos-Bernal DF, Chinnasamy P, Dunaway CM, Hou R, Pujato MA. et al. Control of mitochondrial function and cell growth by the atypical cadherin Fat1. Nature. 2016;539:575-8
26. Hu X, Zhai Y, Kong P, Cui H, Yan T, Yang J. et al. FAT1 prevents epithelial mesenchymal transition (EMT) via MAPK/ERK signaling pathway in esophageal squamous cell cancer. Cancer Lett. 2017;397:83-93
27. Martin D, Degese MS, Vitale-Cross L, Iglesias-Bartolome R, Valera JLC, Wang Z. et al. Assembly and activation of the Hippo signalome by FAT1 tumor suppressor. Nat Commun. 2018;9:2372
28. Meng P, Zhang YF, Zhang W, Chen X, Xu T, Hu S. et al. Identification of the atypical cadherin FAT1 as a novel glypican-3 interacting protein in liver cancer cells. Sci Rep. 2021;11:40
29. Kim KT, Kim BS, Kim JH. Association between FAT1 mutation and overall survival in patients with human papillomavirus-negative head and neck squamous cell carcinoma. Head Neck. 2016;38(Suppl 1):E2021-9
30. Ding C, Huang H, Wu D, Chen C, Hua Y, Liu J. et al. Pan-cancer analysis predict that FAT1 is a therapeutic target and immunotherapy biomarker for multiple cancer types including non-small cell lung cancer. Front Immunol. 2024;15:1369073
31. Ahmed AF, de Bock CE, Sontag E, Hondermarck H, Lincz LF, Thorne RF. FAT1 cadherin controls neuritogenesis during NTera2 cell differentiation. Biochem Biophys Res Commun. 2019;514:625-31
32. Gong H, Li Y, Yuan Y, Li W, Zhang H, Zhang Z. et al. EZH2 inhibitors reverse resistance to gefitinib in primary EGFR wild-type lung cancer cells. BMC Cancer. 2020;20:1189
33. Wang S, Long H, Hou L, Feng B, Ma Z, Wu Y. et al. The mitophagy pathway and its implications in human diseases. Signal Transduct Target Ther. 2023;8:304
34. Wang C, Chen B, Liang S, Shao J, Li J, Yang L. et al. China Protocol for early screening, precise diagnosis, and individualized treatment of lung cancer. Signal Transduct Target Ther. 2025;10:175
35. Ni HM, Williams JA, Ding WX. Mitochondrial dynamics and mitochondrial quality control. Redox Biol. 2015;4:6-13
36. Sun Y, Shen W, Hu S, Lyu Q, Wang Q, Wei T. et al. METTL3 promotes chemoresistance in small cell lung cancer by inducing mitophagy. J Exp Clin Cancer Res. 2023;42:65
37. Tang Y, Wang L, Qin J, Lu Y, Shen HM, Chen HB. Targeting mitophagy to promote apoptosis is a potential therapeutic strategy for cancer. Autophagy. 2023;19:1031-3
38. Glytsou C, Chen X, Zacharioudakis E, Al-Santli W, Zhou H, Nadorp B. et al. Mitophagy Promotes Resistance to BH3 Mimetics in Acute Myeloid Leukemia. Cancer Discov. 2023;13:1656-77
39. Meng Y, Qiu L, Zeng X, Hu X, Zhang Y, Wan X. et al. Targeting CRL4 suppresses chemoresistant ovarian cancer growth by inducing mitophagy. Signal Transduct Target Ther. 2022;7:388
40. Lu D, Li Y, Niu X, Sun J, Zhan W, Shi Y. et al. STAT2/SLC27A3/PINK1-Mediated Mitophagy Remodeling Lipid Metabolism Contributes to Pazopanib Resistance in Clear Cell Renal Cell Carcinoma. Research (Wash D C). 2024;7:0539
41. Song SB, Jang SY, Kang HT, Wei B, Jeoun UW, Yoon GS. et al. Modulation of Mitochondrial Membrane Potential and ROS Generation by Nicotinamide in a Manner Independent of SIRT1 and Mitophagy. Mol Cells. 2017;40:503-14
42. Poole LP, Macleod KF. Mitophagy in tumorigenesis and metastasis. Cell Mol Life Sci. 2021;78:3817-51
43. Debnath J, Gammoh N, Ryan KM. Autophagy and autophagy-related pathways in cancer. Nat Rev Mol Cell Biol. 2023;24:560-75
44. Cui Q, Wang JQ, Assaraf YG, Ren L, Gupta P, Wei L. et al. Modulating ROS to overcome multidrug resistance in cancer. Drug Resist Updat. 2018;41:1-25
45. Qiu C, Tang C, Tang Y, Su K, Chai X, Zhan Z. et al. RGS5(+) lymphatic endothelial cells facilitate metastasis and acquired drug resistance of breast cancer through oxidative stress-sensing mechanism. Drug Resist Updat. 2024;77:101149
46. Valletta D, Czech B, Spruss T, Ikenberg K, Wild P, Hartmann A. et al. Regulation and function of the atypical cadherin FAT1 in hepatocellular carcinoma. Carcinogenesis. 2014;35:1407-15
47. Zhang L, Zhou Y, Cheng C, Cui H, Cheng L, Kong P. et al. Genomic Analyses Reveal Mutational Signatures and Frequently Altered Genes in Esophageal Squamous Cell Carcinoma. Am J Hum Genet. 2020;107:579
48. Li Z, Razavi P, Li Q, Toy W, Liu B, Ping C. et al. Loss of the FAT1 Tumor Suppressor Promotes Resistance to CDK4/6 Inhibitors via the Hippo Pathway. Cancer Cell. 2018;34:893-905 e8
49. Bingol B, Tea JS, Phu L, Reichelt M, Bakalarski CE, Song Q. et al. The mitochondrial deubiquitinase USP30 opposes parkin-mediated mitophagy. Nature. 2014;510:370-5
Author contact
Corresponding author: Jun Chen; junchenedu.cn, Hongyu Liu; liuhongyu123com.