Impact Factor ISSN: 1449-2288




Int J Biol Sci 2027; 23(1):207-254. doi:10.7150/ijbs.130783 This issue Cite
Review
Emerging roles of deep learning in cancer diagnosis, therapy, and risk prediction
Shuiqing Liu1,2#, Xingyu Wan1,2#, Nan Li1,2#, Wuchen Yang1,2#, Jingya Liu1,2#, Shengwang Wu1,2, Jing Zhang1,2, Dezhi Huang1,2, Yang Gou1,2, Ping Wang1,2, Tinglu Tao1,2, Hao Wang1,2, Siyin Chen1,2, Yongjie Tang1,2, Cheng Yang1,2, Cheng Zhang1,2  , Xiangui Peng1,2 , Xi Zhang1,2,3
1. Medical Center of Hematology, Xinqiao Hospital of Army Medical University, Chongqing, 400037, China.
2. Chongqing Key Laboratory of Hematology and Microenvironment, Chongqing, 400037, China.
3. Jinfeng Laboratory, Chongqing, 401329, China.
# These authors equally contributed to this work.
Received 2025-12-31; Accepted 2026-9-17; Published 2027-1-1
Abstract
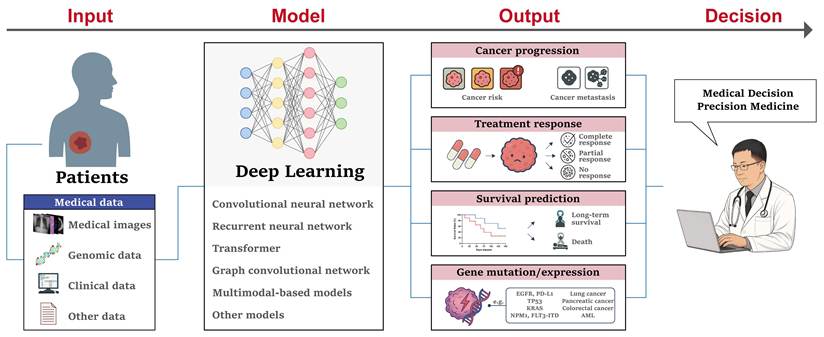
Artificial intelligence (AI) has advanced rapidly in oncology, with deep learning (DL) emerging as a powerful approach for extracting complex patterns from multimodal clinical data. In this review, we examine the clinical translation of DL across the cancer workflow, encompassing diagnosis, precision therapy, prognosis, and disease management. We summarize representative applications in pathology, medical imaging, hematologic and molecular diagnostics, multimodal tumor characterization, treatment selection, radiotherapy planning, treatment-response prediction, survival prediction, and molecular biomarker inference. Beyond predictive performance, we focus on the evidence supporting clinical translation, including internal and external validation, prospective evaluation, clinician comparison, and integration into clinical workflows. To systematically assess the maturity of DL models, we propose an evidence-based M0-M4 framework ranging from technical development (M0) and internal proof of concept (M1) to external clinical validation (M2), prospective clinical evaluation (M3), and implementation with demonstrated clinical impact (M4). Overall, although DL models increasingly demonstrate excellent predictive performance across the cancer care continuum, most remain at the retrospective validation stage, with limited evidence of prospective evaluation, workflow integration, and demonstrated clinical benefit. Key barriers to clinical translation include data heterogeneity and privacy, limited generalizability, methodological and algorithmic validity, interpretability, regulatory considerations, and the need for robust prospective evaluation. Future research should prioritize standardized multicenter validation, prospective workflow-based evaluation, human-AI interaction, and evidence of clinical impact to facilitate the transition of DL from promising algorithms to clinically deployable tools.
Keywords: artificial intelligence, deep learning, cancer, diagnosis, therapy, risk prediction, clinical translation
Introduction
Cancer remains one of the most devastating threats to global health, accounting for nearly 10 million deaths annually [1]. Despite advancements in early detection and treatment, the heterogeneity and complexity of malignancies continue to pose major challenges. Artificial intelligence (AI) excels at analyzing complex, high-dimensional medical data to uncover subtle cancer features that can assist cancer diagnosis and treatment decision-making. For example, our previous studies demonstrated that machine learning (ML) models can utilize common clinical data to accurately predict various hematologic malignancies, especially Philadelphia (Ph) chromosome positive acute lymphoblastic leukemia (ALL) [2, 3]. Recently, deep learning (DL), a subset of AI, has attracted increasing attention due to its more powerful capacity for automated image segmentation, feature extraction, object classification, multi-modal registration, and self-learning after training [4]. For example, convolutional neural network (CNN), recurrent neural network (RNN), and Transformer models can automatically analyze medical images, including computed tomography (CT), magnetic resonance imaging (MRI), ultrasonography (USG), and X-rays, for cancer detection and classification [5]. Through integrating clinical data and genomic features, DL can assist in predicting the treatment response and long-term survival, thereby improving patient prognosis [6]. Of note, DL models have demonstrated remarkable efficacy in discovering novel biomarkers of early-stage disease and tumor progression [7]. Efforts to integrate DL techniques into oncology workflows will enhance clinical diagnosis and treatment efficacy, alleviate the workloads of front-line clinicians, and improve patient outcomes and quality of life. However, there are still great challenges in the application of DL in clinical practice due to large-scale and heterogeneous datasets, data privacy and ethical considerations, algorithmic validity, model's generalization ability and explainability.
In this review, we synthesized recent advances in DL across the cancer care continuum, with particular emphasis on its clinical translation from diagnosis and precision therapy to prognosis and disease management. Rather than focusing solely on model performance, we examined the level of clinical evidence supporting the transition of DL models from technical development to clinical implementation. We also introduced an evidence-based M0-M4 framework to characterize the clinical maturity of DL models, ranging from technical development and internal proof of concept to external clinical validation, prospective clinical evaluation, and implementation with demonstrated clinical impact. A narrative review approach was adopted to identify and synthesize representative studies published in recent years. The total articles captured were derived from PubMed database, with the primary search spanning January 1, 2021 to September 25, 2025, and a secondary search extending back to Jan 1, 2016 when retrieved literature for a specific topic was insufficient to support comprehensive discussion. Search queries combined "deep learning" with domain-specific terminology across three thematic domains: diagnostic applications (encompassing pathologic diagnosis with tumor grading, subtyping, and metastasis; oncologic imaging including MRI, CT, ultrasonography, and X-ray; laboratory diagnostics comprising blood cell morphology, chromosome analysis, flow cytometry, next-generation sequencing, and fluorescence in situ hybridization; and multimodal diagnostic frameworks), therapeutic applications (spanning drug combinations, radiotherapy planning and therapeutic targets), and prognosis and disease management (covering cancer progression, treatment response, survival outcomes, gene mutations and oncogene expression), with full search strings detailed in Supplementary Figure 1. We prioritized studies demonstrating high relevance to the topic, sufficient clinical evidence, and significant influence in the field. Specifically, eligibility criteria comprised: (1) transparent dataset documentation; (2) application of clearly described DL models; and (3) excellent quantitative performance metrics beyond conceptual discussion. Excluded were commentaries, review articles, conference abstracts without complete methods or results.
The evolution of DL architectures and training paradigms
Evolution of deep learning architectures
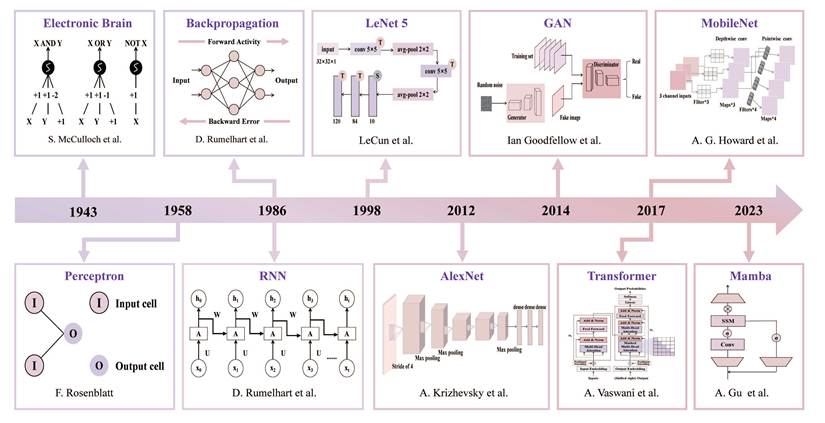
Deep learning is an algorithm that utilizes artificial neural networks to automatically analyze signals or data. As the number of layers increases, the model structure becomes more complex, and more calculations need to be conducted, which may lead to better performance. Since the pioneering work of McCulloch and Pitts, who proposed the McCulloch-Pitts model (a basic logical operation which achieved AND, OR, and NOT) in 1943, many single neural networks have made significant advancement [8]. Inspired by the above work, Rosenblatt et al. proposed the term perceptron in 1958, which was the first artificial neural network (ANN) that allowed neurons to learn [9]. However, the single layer perceptron model is only suitable for linear relationships and cannot solve simple XOR and XNOR problems. In addition, the scholars incorrectly assumed that the limitations of single-layer networks equally applied to the multi-layer architectures, leading to stagnation in the field. In 1980, Fukushima introduced the Neocognitron, a hierarchical self-organizing neural network model used for visual cognition, which contained convolutional layers and pooling layers and was regarded as a prototype of CNNs [10]. Although the Neocognitron demonstrated the great potential in dealing with complex tasks, its layer-wise training was computationally inefficient, which restricted its practical applications. Later, Rumelhart et al. proposed the Backpropagation algorithm and validated its effectiveness in solving complex nonlinear problems in multi-layer networks, which fundamentally reversed the field's dilemma [11]. After that, many neural network architectures were springing up, like RNNs, LeNet [12, 13].
In the medical field, after AlexNet (a CNN architecture combining ReLU, Dropout, and GPU technologies) won the ImageNet competition with overwhelming advantages in 2012, CNN methods were rapidly applied to radiological and pathological image segmentation and anomaly detection [14-16]. With further development, research gradually shifted towards generative tasks and comprehensive understanding of clinical data. Goodfellow et al. (2014) introduced Generative Adversarial Networks (GANs) to generate synthetic data akin to real data, which benefited solving the medical data scarcity problem [17]. However, modeling global relationships and integrating long-range contextual interactions and spatial dependencies in long sequences remain challenging for CNNs owing to their local receptive fields. For that, Vaswani et al. proposed a Transformer structure, which employed a pure self-attention mechanism for global contextual modeling, demonstrating superior performance in tasks, such as electronic health record analysis, protein structure prediction, and transcriptomic data interpretation [18-21]. Subsequently, Vision Transformer (ViT) emerged based on Transformer to feed image patches as a sequence into the Transformer encoder, thereby efficiently capturing global spatial correlations and showing exceptional performance in medical image classification and lesion segmentation compared to CNNs (such as ResNet50, VGG16, and U-Net) [22]. However, DL models usually occupy large memory and need powerful computational capabilities. To facilitate the practical application, researchers further investigated lightweight and highly efficient architectures. For example, the MobileNet network, a mobile real-time lightweight network, was proposed for image classification with lower computational complexity and faster inference speed [23]. Mamba was developed for addressing Transformer's computational inefficiency on long sequences (such as genomics, proteomics, and video data) with fast inference and linear scaling in sequence length [24]. It supported about 5 times higher throughput than Transformer [24]. For instance, the Protein-Mamba model provided the best performance in predicting protein G fitness, thermostability, fluorescence, and β-lactamase activity compared to ResNet, Transformer, and ProtBERT models [25]. Overall, research had progressed from local feature extraction to global dependency modeling, from high computational overhead to lightweight efficient inference, significantly extending application scenarios. Figure 1 presented the key studies that contributed to major breakthroughs in the field.
Timeline of deep learning development in medical research. Key studies contributing to major breakthroughs in the field are highlighted.
Evolution of deep learning training paradigms
With the continuous development of DL, its training paradigm has also evolved. Originally, training a neural network in a supervised way using labeled data was widely applied and was considered the most accurate approach. However, collecting large amounts of high-quality labeled medical data was exceptionally labor-intensive and costly. This greatly limited its further development and application. Later, the supervised transfer learning method, which first pretrained on the base dataset and then fine-tuned the pretrained network on the target dataset, was proposed to effectively speed up network convergence without compromising model performance. It is undeniable that obvious domain gap exists between natural images and medical images. Then a few interesting recent studies attempted to liberate from the traditional supervised paradigms and looked for weakly supervised learning (e.g., multiple instance learning, category activation mapping, and constraint-based regularization), semi-supervised learning (e.g., pseudo-labelling-based, consistency-based, graph-based), and self-supervised learning (e.g., contrastive learning, pretext-based learning, generative learning) [26]. The weakly supervised learning only needed class labels or sparse region annotations to achieve pixel-level lesion localization and tissue classification, but the model tended to converge to a suboptimal solution due to insufficient label granularity. The semi-supervised learning required a small fraction of fine-grained labeled data to effectively leverage a large number of unlabeled medical images for mining lesion morphological and histological features, yet model performance was prone to degradation due to noisy data and domain variation. In contrast, self-supervised learning was very suitable for learning effective feature representations from a lot of unlabeled data, and could still achieve high-performance models under conditions of scarce labeled data. Notably, contrastive learning was one of the most significant paradigms within self-supervised learning, which utilized data augmentation to generate different views of the same sample and learned transformation-invariant robust features by maximizing the consistency between these views. Building on this framework, SimCLR, MoCo, BYOL, and SwAV gradually appeared to adapt medical domain data characteristic, allowing high-quality representations to be learned from unlabeled medical data at scale [27-29]. For instance, the RapidLymphoma based on BYOL achieved an accuracy of 97.81% in lymphoma diagnosis using hematoxylin and eosin (H&E) images [30]. Similarly, the HistoMoCo based on MoCo achieved an AUROC of 99.4% in oral squamous cell carcinoma (OSCC) detection using histopathological images [31].
Collectively, the evolution of deep learning architectures and training paradigms has gradually shifted from task-specific feature engineering to large-scale representation learning and multimodal foundation models. These technological advances have enabled DL models to move beyond isolated image classification tasks toward integrated clinical decision support, laying the foundation for their applications in cancer diagnosis, precision therapy, disease monitoring, and prognosis.
Clinical translation of deep learning in cancer diagnosis
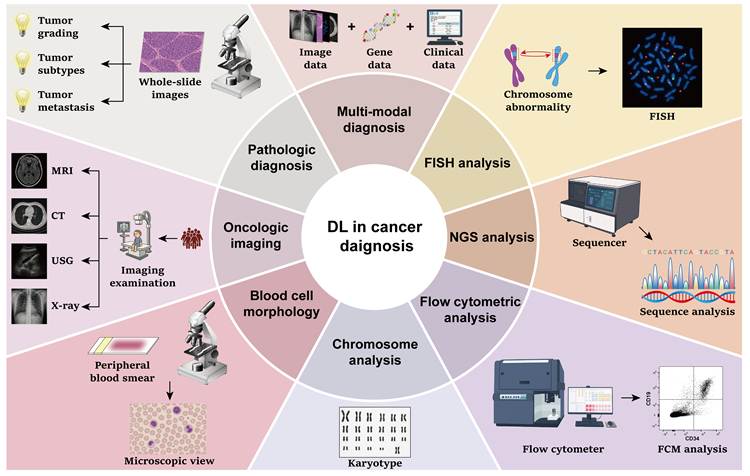
In this section, we examine the clinical translation of deep learning across major diagnostic modalities, including pathology, medical imaging, laboratory-based diagnostics (blood cell morphology, chromosome analysis, flow cytometry [FCM], next-generation sequencing [NGS], and fluorescence in situ hybridization [FISH]), and multimodal diagnosis (Figure 2).
Deep learning applications in cancer diagnosis. The applications of DL in cancer diagnosis, including pathologic diagnosis, imaging examinations, blood cell morphology analysis, chromosome examinations, FCM analysis, NGS, FISH and multi-modal tumor diagnosis.
Deep learning applications in pathologic diagnosis
To date, the pathologic diagnosis remains the gold standard for cancer diagnosis and grading. However, it is labor-intensive, time-consuming, and subject to inter- and intra-observer variability. DL enables automated and reproducible analysis of whole-slide images (WSIs), thereby reducing interobserver variability, enhancing diagnostic consistency and accuracy, and altering the medical image analysis landscape. In this section, we summarized recent advancements in DL application in pathologic diagnosis, including tumor grading, tumor subtype classification, and tumor metastasis detection. We also evaluated and compared the performance of these models (Table 1). Our review highlights the potential of DL to enhance routine pathological diagnosis and support clinical decision-making.
Deep learning applications in pathologic diagnosis.
| Year | Cancer type | Method | Cohort Size | Objective | Performance | Ref. |
|---|---|---|---|---|---|---|
| 2024 | Breast cancer | DeepGrade based on convolutional neural network | 1169 WSIs from 896 patients | To grade breast cancer | NHG1 vs. NHG3 in biopsy specimens: AUROC = 0.962; Sensitivity = 91.7%; Specificity = 89.1%.NHG1 vs. NHG3 in resected specimens: AUROC = 0.908; Sensitivity = 78.8%; Specificity = 86.8%. | [32] |
| 2022 | Breast cancer | Convolutional neural network | 2100 images from 15 patients | To grade breast cancer | Overall accuracy = 79.4%. Grade 0: Precision = 0.84; Recall = 0.92; F1-score = 0.88. Grade Ⅰ: Precision = 0.78; Recall = 0.85; F1-score = 0.81. Grade Ⅱ: Precision = 0.78; Recall = 0.77; F1-score = 0.77. Grade Ⅲ: Precision = 0.81; Recall = 0.68; F1-score = 0.74. | [33] |
| 2020 | Prostate cancer | DLS model based on convolutional neural network and support vector machine | Development set: 524 biopsies (biopsy-level) and 1681287 patches (region-level)Internal validation set: 430 biopsiesExternal validation set: 322 biopsies | To grade prostate biopsies | DLS: Agreement rate with subspecialists = 71.7% (internal set) and 71.4% (external set); General pathologists: Agreement rate with subspecialists = 58.0% (internal set) and 61.2% (external set). | [34] |
| 2020 | Prostate cancer | U-Net | Training set: 4712 biopsiesTuning set: 497 biopsiesInternal test set: 535 biopsiesObserver set: 100 biopsiesExternal test set: 245 biopsies | To grade prostate biopsies | Quadratic kappa: Internal test set = 0.918; Observer set = 0.854; External test set, pathologist 1 or 2 as reference = 0.723 or 0.707. AUROC of benign vs. malignant: Internal test set = 0.990; Observer set = 0.984; External test set, pathologist 1 or 2 as reference = 0.980 or 0.988. AUROC of benign and grade group 1 vs. grade group 2-5: Internal test set = 0.978; Observer set = 0.904; External test set, pathologist 1 or 2 as reference = 0.878 or 0.869. AUROC of benign and grade group 1-2 vs. grade group 3-5: Internal test set = 0.974; Observer set = 0.899; External test set, pathologist 1 or 2 as reference = 0.892 or 0.855. | [35] |
| 2024 | Prostate cancer | ResNet | Training set: 36000 imagesTesting set: 7200 images | To grade prostate biopsies | Accuracy of ResNet18: 40× magnification = 0.9977; 20×magnification = 0.9992; 10×magnification = 0.9964; 5×magnification = 0.9921. Accuracy of ResNet34: 40× magnification = 0.9999; 20×magnification = 0.9999; 10×magnification = 1.000; 5×magnification = 0.9993. Accuracy of ResNet50: 40× magnification = 0.9957; 20×magnification = 0.9915; 10×magnification = 0.9952; 5×magnification = 0.9981. | [36] |
| 2022 | Gastric cancer | ResNet-18 | Training set: 348 WSIsTesting set: 88 WSIs | To recognize tumor differentiation grades | Recall: PDA = 0.8275; WDA = 0.8930; Other = 0.9903. Precision: PDA = 0.8984; WDA = 0.9024; Other = 0.9584. F1-score: PDA = 0.8615; WDA = 0.8977; Other = 0.9741. | [37] |
| 2025 | Esophageal cancer | Wave-ViT (modified Transformer with wavelet module) | Training set: 602 patientsTest set: 79 patientsValidation set: 76 patients | To classify and stage esophageal cancer | Accuracy: Wave-ViT model = 88.97%; Transformer = 87.65%; ResNet = 85.44%; MLP = 81.17%. | [38] |
| 2025 | Glioma | IGGC based on ConvNeXt | Training set: 1603 WSIsInternal validation set: 120 WSIsTCGA validation set: 508 WSIsTesting set: 213 WSIs | To grade intraoperative glioma | HGG vs. LGG in internal validation set: Accuracy = 0.98; AUROC = 1.00; Sensitivity = 1.00; Specificity = 0.96. HGG vs. LGG in testing set: Accuracy = 0.98; AUROC = 0.99; Sensitivity = 0.98; Specificity = 0.99.Grade 4 vs. non-Grade 4 in internal validation set: Accuracy = 0.95; AUROC = 0.98; Sensitivity = 0.88; Specificity = 0.98. Grade 4 vs. non-Grade 4 in TCGA validation set: Accuracy = 0.88; AUROC = 0.94; Sensitivity = 0.88; Specificity = 0.88. Grade 4 vs. non-Grade 4 in testing set: Accuracy = 0.90; AUROC = 0.96; Sensitivity = 0.90; Specificity = 0.90. | [39] |
| 2022 | Uterine leiomyosarcoma | YOLOv4 | Training set: 100 imagesTesting set: 50 images | To recognize the mitotically active regions | Precision = 0.7462; Recall = 0.8981; F1-score = 0.8151; Accuracy = 0.6879. | [40] |
| 2018 | Non-small cell lung cancer | Inception v3 | Internal set: 1634 WSIsExternal test set: 340 WSIs | To identify tumor subtypes | Internal cohort (Frozen sections, average predicted probability aggregation): Micro-average AUROC = 0.970 (3 classes, 20×) or 0.980 (3 classes, 5×); Macro-average AUROC = 0.976 (3 classes, 20×) or 0.981 (3 classes, 5×). External cohort: AUROC (Frozen sections) = 0.919 (LUAD, 5×) or 0.977 (LUSC, 5×) or 0.913 (LUAD, 20×) or 0.941 (LUSC, 20×); AUROC (FFPE sections) = 0.861 (LUAD, 5×) or 0.975 (LUSC, 5×) or 0.833 (LUAD, 20×) or 0.932 (LUSC, 20×); AUROC (Biopsies) = 0.871 (LUAD, 5×) or 0.928 (LUSC, 5×) or 0.834 (LUAD, 20×) or 0.861 (LUSC, 20×). | [41] |
| 2024 | Breast cancer | ResNet50-based integration model | 277524 images (augmented to 397476 images by affine transformations) | To recognize invasive ductal carcinoma | Accuracy = 99.04%; Specificity = 97.98%; Sensitivity = 100.00%; Precision = 97.03%; MCC = 78.82%; F1-score = 98.67%; AUROC = 97.89%. | [42] |
| 2021 | Colorectal cancer | Inception V3 | FOCUS cohort: 666 slidesTCGA cohort: 468 slidesGRAMPIAN cohort: 406 slides | To predict consensus molecular subtypes | FOCUS cohort: Macro-average AUROC (3×) = 0.88; Macro-average AUROC (12×) = 0.87, Macro-average AUROC (trained by domain adversarial training) = 0.90.TCGA cohort: Macro-average AUROC (3×) = 0.81; Macro-average AUROC (12×) = 0.80; Macro-average AUROC (trained by domain adversarial training) = 0.84.GRAMPIAN cohort: Macro-average AUROC (3×) = 0.82; Macro-average AUROC (12×) = 0.83; Macro-average AUROC (trained by domain adversarial training) = 0.85. | [43] |
| 2022 | Hepatocellular nodular lesions | HnAIM based on ResNet, Inception V3, Xception | Internal set: 649 slidesExternal set 1: 30 slidesExternal set 2: 439 slides | To identify hepatocellular nodular lesions subtypes | Internal test: AUROC (ResNet50) = 0.9984; AUROC (InceptionV3) = 0.9986; AUROC (Xception) = 0.9991; AUROC (Ensemble model) = 0.9991. External test 1: patch-based agreement with subspecialists = 84.2%; WSI-based agreement with subspecialists = 100%. External test 2: AUROC (FSFPH) = 0.946; AUROC (SYSHFH) = 0.938; AUROC (GZFPH) = 0.927; AUROC (entire external dataset) = 0.935. | [44] |
| 2021 | Renal cell carcinoma | ResNet-50, VGG-16, and InceptionV3 | TCGA set: 2363 slidesCPTAC set: 782 slidesIndependent set: 131 patients | To diagnose histologic subtypes | Test set: AUROC (VGG-16) = 0.926; AUROC (Inception-v3) = 0.897; AUROC (ResNet) = 0.953.Independent set: AUROC (VGG-16) = 0.897; AUROC (Inception-v3) = 0.782; AUROC (ResNet) = 0.993. | [45] |
| 2023 | Central nervous system tumors | ResNet152 | Training set: 228 patientsInternal testing set: 76 patientsInternal validation set: 76 patientsExternal validation set: 163 patients | To recognize intracranial germinoma (IG), oligodendroglioma, and low-grade astrocytoma | Internal validation set: Accuracy (IFS model) = 93.9%; Accuracy (HE model) = 95.3%.External validation set: Accuracy (IFS model) = 82.0%; Accuracy (HE model) = 76.9%. | [46] |
| 2024 | Glioblastoma | Xception | Internal cohort: 276 patientsExternal cohort: 178 patients | To predict tumor transcriptional subtypes | Internal cohort: Overall accuracy = 66.7%; AUROC (classical) = 0.84; AUROC (mesenchymal) = 0.81; AUROC (proneural) = 0.71. External cohort: Overall accuracy = 56.2%; AUROC (classical) = 0.704; AUROC (mesenchymal) = 0.746; AUROC (proneural) = 0.697. | [47] |
| 2025 | Central nervous system diffuse large B-cell lymphoma and high-grade glioma | Convolutional neural network and support vector machine | 100 patients | To distinguish between central nervous system diffuse large B-cell lymphoma and high-grade glioma | Accuracy = 97.41%; Sensitivity = 97.87%; Specificity = 98.32%; F1-Score = 97.82%. | [48] |
| 2023 | Lung adenocarcinoma | Convolutional neural network based on EfficientNet-B3 architecture | Training set: 91 WSIsInternal validation set: 239 WSIsExternal test set: 243 WSIs | To distinguish lung adenocarcinoma subtypes | Cross-validation: AUROC (AI-1): No carcinoma = 0.996; Lepidic = 0.993; Acinar = 0.983; Papillary = 0.991; Micropapillary = 0.968; Solid = 0.997; IMA = 0.993; Other carcinoma = 0.920. AUROC (AI-2): No carcinoma = 0.995; Lepidic = 0.978; Acinar = 0.982; Papillary = 0.972; Micropapillary = 0.965; Solid = 0.998; IMA = 0.976; Other carcinoma = 0.960. | [49] |
| 2025 | Neuroendocrine tumors (NETs) and neuroendocrine carcinomas (NECs) | NEToC based on convolutional neural network with U-Net architecture | 95 patients | To distinguish between NETs and NECs | 64×64 pixels: Precision = 0.79; Accuracy = 0.74. 128 × 128 pixels: Precision = 1; Accuracy = 0.98.256 × 256 pixels: Precision = 1; Accuracy = 0.98. 512 × 512 pixels: Precision = 1; Accuracy = 1. | [50] |
| 2023 | Thyroid nodules | Convolutional neural network with VGG11 architecture | Training set: 964 biopsiesRetrospective test set: 288 biopsiesConsecutive test set: 313 biopsies | To distinguish between benign thyroid nodules, indeterminate thyroid nodules, and malignant thyroid nodules | AUROC (Single-slide retrospective test set) = 91.2%; AUROC (Multislide retrospective test set) = 90.4%;AUROC (Consecutive test set) = 90.1%. | [51] |
| 2021 | Soft tissue sarcoma | Densely connected convolutional network (DenseNet121) | Internal cohort: 240 patientsExternal cohort: 51 patients | To classify tumor subtypes | Internal cohort: AUROC (micro-averaging) = 0.95; AUROC (macro-averaging) = 0.97.External cohort: AUROC (micro-averaging) = 0.93; AUROC (macro-averaging) = 0.94. | [52] |
| 2023 | Non-melanoma skin cancer | MuSClD based on CycleGAN and ResNext50_32 × 4D | Training set: 85 patientsTesting set: 352 patients | To classify tumor subtypes | AUROC (BCC) = 0.92; AUROC (SCC-In situ) = 0.87; AUROC (SCC-Invasive) = 0.92. | [53] |
| 2023 | Skin tumor | Chain memory convolution neural network and attention graph gate network | Training set: 203 slidesValidation set: 24 slidesTesting set: 277 slides | To distinguish between Bowen disease (BD), neurofibroma (NF), seborrheic keratosis (SK), and healthy tissues | Accuracy (BD) = 92.64%; Accuracy (NF) = 96.88%; Accuracy (SK) = 99.21%; Accuracy (Healthy tissues) = 86.00%. | [54] |
| 2023 | Gastric cancer | U-Net | 186 images from 70 patients | To distinguish between differentiation components and undifferentiated components | Precision = 0.9266; Recall = 0.9847; F1-score = 0.9548; AUROC = 0.91. | [55] |
| 2025 | Endometrial cancer (EC) and colorectal cancer (CRC) | ETMIL-SSLViT, based on vision transformer and Transformer-based multiple instance learning | TCGA-EC cohort: 918 WSIs from 529 patientsTCGA-CRC cohort: 1495 WSIs from 594 patients | To predict pathological subtypes and tumor mutational burden | EC subtype classification (aggressive vs. non-aggressive): Accuracy = 0.91.CRC subtype classification (mucinous vs. non-mucinous): Accuracy = 0.87.TMB status prediction in the aggressive subtype in EC: Accuracy = 0.77.TMB status prediction in the non-aggressive subtype in EC: Accuracy = 0.66.TMB status prediction in the non-mucinous subtype in CRC: Accuracy = 0.85.TMB status prediction in the mucinous subtype in CRC: Accuracy = 0.76.Validation on independent datasets (EC subtype classification): Accuracy = 0.87. | [56] |
| 2024 | Brain tumor | ResNet50-v2 (model 1), Google Inception-ResNet-v2 (model 2), ResNet50 (model 3) | 121 images from 84 patients | To diagnose brain tumor subclassification | Patient level: Accuracy = 73.9%; Precision = 0.89; Recall = 0.74; F1-score = 0.79; Specificity = 0.96.Image level: Accuracy = 70.7%; Precision = 0.87; Recall = 0.71; F1-score = 0.76; Specificity = 0.94. | [57] |
| 2017 | Breast cancer | ———— | Training set: 249 WSIsTest set: 150 WSIs | To predict breast cancer lymph node metastases | The model performance in top 3 teams:1st: GoogLeNet (from HMS and MIT II team), Task1: FROC score = 0.807; Task2: AUROC = 0.994.2nd: ResNet (from HMS and MGH III team), Task1: FROC score = 0.760; Task2: AUROC = 0.976.3rd: GoogLeNet (from HMS and MGH I team), Task1: FROC score = 0.596; Task2: AUROC = 0.964. | [58] |
| 2021 | Gastric cancer | Faster RCNN, DeepLab, Xception, DenseNet-121 | Training set: 594 WSIs from 128 patientsTest set: 327 WSIs from 94 patients | To quantify lymph node and identify gastric metastatic cancer | Quantify lymph node: Accuracy = 97.13%.Identify metastatic cancer: PPV = 93.53%; NPV = 97.99%. | [59] |
| 2023 | Liver adenocarcinoma | HEPNET based on EfficientNet B3 | Training set: 456 patientsInternal test set: 115 patientsExternal test set: 159 patients | To distinguish between intrahepatic cholangiocarcinoma and colorectal liver metastasis | Internal test set (Patient level): AUROC = 0.994; Accuracy = 96.52%; Sensitivity = 96.43%; Specificity = 96.61%; F1-score = 0.965.External validation set (Patient level): AUROC = 0.997; Accuracy = 98.11%; Sensitivity = 98.57%; Specificity = 97.75%; F1-score = 0.981. | [62] |
| 2023 | Liver metastatic malignancies | EfficientNetV2 and ResNetRS | Training set: 116728 patchesValidation set: 44372 patchesTest set: 43059 patches | To recognize colorectal adenocarcinoma liver metastasis, pancreatic adenocarcinoma liver metastasis, and benign lesions | Tile-level accuracy = 89%; Case-level accuracy = 94%. | [63] |
| 2023 | Melanoma | U-Net | Training set: 542 WSIsTest set 1: 60 WSIsTest set 2: 91 WSIs | To detect melanoma metastases in lymph nodes | Section level: AUROC = 0.9630 (Center 0) or 0.9856 (Center 2); Sensitivity = 91.67% (Center 0) or 95.62% (Center 2); Specificity = 90.82% (Center 0) or 93.81% (Center 2);Block level: Sensitivity (> 1mm) = 100.00% (Center 0) or 97.37% (Center 2); Sensitivity (0.1mm-1mm) = 87.50% (Center 0) or 95.24% (Center 2); Sensitivity (< 0.1mm) = 0.00% (Center 0) or 0.00% (Center 2); Specificity (> 1mm) = 99.15% (Center 0) or 100.00% (Center 2); Specificity (0.1mm-1mm) = 89.66% (Center 0) or 86.64% (Center 2); Specificity (< 0.1mm) = 100.00% (Center 0) or 100.00% (Center 2). | [60] |
| 2025 | Primary central nervous system lymphoma and common central nervous system tumors | RapidLymphoma based on BYOL self-supervised learning and ResNet-50 | Training set: 54000 patch images. Prospective test set: 213 slides from 160 patients. External test set 1: 1772 slides from 420 patients. External test set 2: 152 slides from 59 patients | To distinguish between primary central nervous system lymphoma and other central nervous system entities | Prospective test set (PCNSL vs non-PCNSL): Accuracy = 97.81%.External test set 1 (PCNSL vs. IDH-wildtype gliomas): Accuracy = 95.44%.External test set 2 (PCNSL vs. brain metastasis): Accuracy = 95.57%. | [30] |
| 2023 | Pan-cancer | PC-LNM based on Swin Transformer | TCGA set: 3848 WSIsCPTAC set: 552 WSIs | To predict lymph node metastasis | Internal validation: AUROC = 0.732; Sensitivity = 0.734; Specificity = 0.612.External validation: AUROC=0.699; Sensitivity = 0.912; Specificity=0.388. | [61] |
| 2023 | Gastric cancer | attention-based multiple instance learning based on RetCCL network | KIEL cohort: 366 patientsAUGSBURG cohort: 474 patientsTCGA cohort: 306 patients | To predict lymph node metastasis | AUROC (KIEL cohort) = 0.7145; AUROC (AUGSBURG cohort) = 0.6924; AUROC (TCGA cohort) = 0.657. | [64] |
| 2024 | Laryngeal squamous cell carcinoma | ResNet50 and 3D ResNet50 | Training set: 300 patientsInternal test set: 89 patientsExternal test set 1: 120 patientsExternal test set 2: 44 patients | To predict occult lymph node metastasis | Internal test set: AUROC (DLRad_DB) = 0.89; AUROC (DLRad_FB) = 0.84; AUROC (3D DL) = 0.89; AUROC (2D DL) = 0.83. External test set 1: AUROC (DLRad_DB) = 0.89; AUROC (DLRad_FB) = 0.82; AUROC (3D DL) = 0.89; AUROC (2D DL) = 0.85. External test set 2: AUROC (DLRad_DB) = 0.89; AUROC (DLRad_FB) = 0.83; AUROC (3D DL) = 0.86; AUROC (2D DL) = 0.86. | [65] |
| 2023 | Papillary thyroid carcinoma | Ensemble deep learning model based on ResNet-50 | Training set: 754 patientsInternal validation set: 94 patientsInternal test set: 94 patientsExternal test set: 89 patients | To predict cervical lymph node metastasis | Internal test set: AUROC = 0.86; Accuracy = 0.79; Sensitivity = 0.83; Specificity = 0.74; PPV = 0.78; NPV = 0.82; Kappa = 0.57; F1-score = 0.79.External test set: AUROC = 0.77; Accuracy = 0.72; Sensitivity = 0.75; Specificity = 0.69; PPV = 0.70; NPV = 0.74; Kappa = 0.44; F1-score = 0.72. | [66] |
| 2023 | Gastric adenocarcinoma | ResNet152 | Internal set: 38 patientsExternal set: 12 patients | To detect lymph node metastasis | AUROC (Internal set) = 0.9994; AUROC (External set) = 0.9914. | [67] |
| 2025 | Lung squamous cell carcinoma | LN_ISLUSCH based on ResNet-18 | Outdo-LUSC set: 499 patientsTCGA-LUSC set: 512 patients | To predict lymph node metastasis | Training set: AUROC = 0.941; Test set: AUROC = 0.788. | [68] |
Tumor grading
Tumor grading is an important component of pathological evaluation and plays a critical role in treatment selection and prognostic assessment. Conventional tumor grading relies on manual interpretation by pathologists and is therefore susceptible to inter- and intra-observer variability, particularly in complex or borderline cases. Recent advances in DL have enabled automated analysis of whole-slide images (WSIs), providing a promising approach to improve the consistency and efficiency of pathological grading.
DL-based tumor grading has been investigated across multiple cancer types, including breast, prostate, gastric, esophageal, glioma, and uterine tumors (Table 1). In breast cancer, convolutional neural network (CNN)-based models have demonstrated reliable discrimination of Nottingham histological grades using biopsy and surgical specimens, whereas CNN models based on third harmonic generation images have also shown the feasibility of automated grade classification [32, 33]. In prostate cancer, which is one of the most extensively studied applications, several DL systems have achieved high agreement with expert pathologists in Gleason grading while reducing interobserver variability [34-36]. Notably, Nagpal et al. developed a DL system trained using region-level annotations that demonstrated higher agreement with subspecialty pathologists than general pathologists in both internal and external validation cohorts [34]. Subsequent studies further confirmed that semi-automatic annotation strategies and multi-scale CNN architectures could achieve comparable grading performance while reducing annotation burden [35, 36]. Similar applications have also been reported in gastric cancer, esophageal cancer, glioma, and uterine leiomyosarcoma, supporting the feasibility of DL-assisted grading across different pathological settings [37-40]. Detailed characteristics and performance of representative studies are summarized in Table 1.
Collectively, current studies demonstrate several common trends. First, DL models can improve the reproducibility of pathological grading by reducing observer-dependent variability, particularly for tumors with established grading systems such as breast and prostate cancer. Second, recent architectures, including Vision Transformer-based models, have shown improved performance in some grading tasks by capturing broader tissue context compared with conventional CNN-based approaches [38]. In addition, weakly supervised and semi-automatic annotation strategies have reduced the dependence on labor-intensive pixel-level annotations, facilitating the development of large-scale pathological grading models [35].
Tumor subtype classification
Distinguishing tumor subtypes is essential for accurate diagnosis, molecular stratification, and treatment selection in precision oncology. However, conventional subtype classification often relies on morphological assessment combined with immunohistochemical or molecular testing, which can be time-consuming, expensive, and affected by interobserver variability. By automatically extracting complex morphological features from histopathological images, DL approaches have provided new opportunities for scalable and reproducible tumor subtype classification.
DL-based subtype classification has been investigated across multiple cancer types, including lung, breast, colorectal, liver, kidney, and brain tumors (Table 1). In lung cancer, Coudray et al. developed an Inception v3-based CNN model that accurately distinguished lung adenocarcinoma, squamous cell carcinoma, and normal lung tissues using H&E-stained whole-slide images (WSIs) [41]. In breast cancer, Haq et al. integrated transfer learning and data augmentation strategies into CNN-based models for invasive ductal carcinoma classification, with the ResNet50-based model achieving the highest classification accuracy among evaluated architectures [42].
Beyond morphological classification, recent studies have explored whether DL models can infer molecularly defined tumor subtypes directly from routine pathological images. For example, Sirinukunwattana et al. developed a DL system capable of predicting colorectal cancer consensus molecular subtypes (CMS) from H&E slides, demonstrating the potential of DL-based image analysis for molecular stratification and reducing the proportion of unclassified cases [43]. Similarly, Cheng et al. developed a DL model (HnAIM) for classifying hepatocellular nodular lesions, including hepatocellular carcinoma (HCC) and benign lesions, achieving high diagnostic performance across surgical and biopsy specimens [44].
DL approaches have also been applied to complex tumor subtype classification in renal and neurological cancers. Marostica et al. evaluated multiple CNN architectures, including VGG16, Inception v3, and ResNet50, for renal cell carcinoma detection and histological subtype classification [45]. In neuropathology, Shi et al. developed a DL model for differentiating low-grade astrocytoma, oligodendroglioma, and intracranial germinoma using frozen-section and H&E-stained images, with consistent performance in external validation cohorts [46]. Furthermore, DL models have been explored for molecular subtype prediction in glioblastoma and differential diagnosis of central nervous system tumors. Roetzer-Pejrimovsky et al. demonstrated that an Xception-based model could predict glioblastoma molecular subtypes, whereas Tian et al. developed a ResNet50-based model to distinguish central nervous system lymphoma from high-grade glioma [47, 48]. Additional studies are summarized in Table 1 [49-57].
Collectively, current studies indicate that DL can facilitate tumor subtype classification by integrating subtle morphological patterns that may not be readily recognized through conventional assessment. Importantly, DL-based approaches are increasingly moving beyond morphological classification toward prediction of molecular characteristics from routine pathological images, providing a potential strategy for reducing reliance on additional molecular testing in selected clinical scenarios.
Tumor metastasis detection
Early detection of tumor metastasis is essential for accurate cancer staging, treatment selection, and prognostic assessment. However, metastatic lesions are often difficult to identify because of their subtle histopathological features and heterogeneous morphological characteristics. DL has emerged as an effective approach for automated pathological image analysis, facilitating the detection, characterization, and differential diagnosis of metastatic lesions.
To date, lymph node metastasis detection has been one of the most extensively investigated applications of DL in pathology (Table 1). Bejnordi et al. systematically evaluated multiple DL algorithms for detecting breast cancer lymph node metastases and demonstrated that the best-performing model achieved diagnostic performance comparable to experienced pathologists while improving detection efficiency in whole-slide image analysis [58]. Hu et al. further integrated Faster RCNN, DeepLab, Xception, and DenseNet-121 to automate the detection and quantification of lymph node metastases using H&E whole-slide images [59]. Similarly, Jansen et al. developed a DL algorithm capable of detecting melanoma sentinel lymph node metastases and accurately classifying metastatic deposits without requiring additional immunohistochemical staining [60]. More recently, Chen et al. proposed an attention-based weakly supervised neural network that predicted lymph node metastatic status directly from primary tumor histology across multiple cancer types, suggesting that primary tumor morphology may provide valuable information for metastatic risk assessment [61].
Beyond lymph node metastasis detection, DL has also been applied to differentiating metastatic tumors from primary malignancies. Albrecht et al. developed the HEPNET model to distinguish intrahepatic cholangiocarcinoma from colorectal liver metastases using H&E whole-slide images, with consistent performance in both internal and external validation cohorts [62]. Likewise, Kriegsmann et al. employed EfficientNetV2- and ResNetRS-based architectures to identify the primary origin of liver metastases from colorectal and pancreatic adenocarcinomas, supporting the feasibility of DL-assisted pathological diagnosis of metastatic disease [63]. In addition, Reinecke et al. proposed the self-supervised DL pipeline RapidLymphoma, which utilized virtual H&E-like images generated from label-free Raman microscopy to rapidly identify primary central nervous system lymphoma (PCNSL) and distinguish it from other central nervous system tumors, including diffuse gliomas and brain metastases, demonstrating the potential of DL for differential diagnosis in clinically challenging cases [30]. Additional representative studies are summarized in Table 1 [64-68].
Collectively, current evidence indicates that DL has expanded the scope of metastasis-related pathology from detecting metastatic lesions to differentiating metastatic tumors from primary malignancies and predicting metastatic status directly from primary tumor histology. These advances may improve diagnostic efficiency and support clinical decision-making in metastatic disease.
Deep learning applications in oncologic imaging
Medical imaging plays a crucial role in clinical diagnosis, which is the most widely used non-invasive method for tumor detection and localization tasks, and can provide critical information about tumor size, morphology, metabolic activity, and malignancy degree. Medical imaging techniques mainly include MRI, CT, USG, and X-ray. In recent years, there has been a lot of research using DL to assist cancer diagnosis relying on these medical images. Herein, we summarized the recent research progress of DL-aided medical imaging analysis, aiming to promote and facilitate further research (Table 2).
Deep learning application in oncologic imaging.
| Year | Cancer type | Method | Cohort Size | Objective | Performance | Ref. |
|---|---|---|---|---|---|---|
| 2022 | Brain tumors | AlexNet and VGGNet | FIGSHARE set: 3064 images from 233 patientsTCIA set: 8798 images from 20 patients | To differentiate between glioma, meningioma and pituitary tumor | Binary classification: (1) FIGSHARE set: Accuracy = 99.14%; Precision = 99.20%; AUROC = 0.9996 (2) TCIA set: Accuracy = 99.00%, Precision = 99.08%; AUROC = 0.9996. Multi-class classification: (1) FIGSHARE set: Accuracy = 98.78%; Precision = 98.56%; AUROC = 0.9944 (2) TCIA set: Accuracy = 99.05%; Precision = 98.97%; AUROC = 0.9931. | [69] |
| 2024 | Brain tumors | L-Net based on U-net and CNN | 3064 images from 233 patients | To differentiate between glioma, meningioma and pituitary tumor | Image size of 16×16: Precision = 0.9867; Recall = 0.9866; F1-score = 0.9866; Accuracy = 0.9866; AUROC (Meningioma) = 0.9966; AUROC (Glioma) = 0.9975; AUROC (Pituitary) = 1.0000. | [70] |
| 2025 | Brain tumors | CNN-TumorNet based on deep convolutional neural network | 7023 images | To diagnose brain tumors | Accuracy = 99%. | [71] |
| 2020 | Glioma | U-Net, VGG16 | 3121 images from 110 patients | To segment and grade glioma | Segmentation: Mean DSC = 0.84. Grading at MRI images' level: Accuracy = 0.89; Sensitivity = 0.87; Specificity = 0.92. Grading at patients' level: Accuracy = 0.95; Sensitivity = 0.93; Specificity = 0.98. | [72] |
| 2024 | Brain tumors | DISCERN based on 1D convolutional neural network | Training set: 40 patientsInternal test set: 400 patientsExternal test set: 128 patients | To differentiate between glioblastoma multiforme, metastasis tumor, and primary CNS lymphoma | Accuracy (Internal test set) = 0.78; Accuracy (External validation set) = 0.71; Accuracy (3T scanner validation subset) = 0.72; Accuracy (IvyGAP dataset) = 0.78. | [73] |
| 2023 | Brain metastases | 3D U-Net, and a multi-level CNN | Training set: 295 patientsValidation set: 99 patientsTesting set: 255 patients | To detect and segment brain metastases | Total: Sensitivity = 90%; Precision = 56%; F1-score = 69%; Dice = 81%; RVD = 20%. Metastases size < 5mm: Sensitivity = 66%; Precision = 22%. 5mm ≤ Metastases size < 10mm: Sensitivity = 88%; Precision = 55%. 10mm ≤ Metastases size < 20mm: Sensitivity = 97%; Precision = 71%. Metastases size ≥ 20mm: Sensitivity = 99%; Precision = 91%. | [74] |
| 2021 | Pituitary adenoma | Deep learning-based reconstruction based on deep convolutional network | 65 patients | To reconstruct MRI images for residual tumor identification and cavernous sinus invasion identification | Identify residual tumor: AUROC (1-mm MRI, Reader 1) = 0.82; AUROC (1-mm MRI+DLR, Reader 1) = 0.92; AUROC (1-mm MRI, Reader 2) = 0.77; AUROC (1-mm MRI+DLR, Reader2) = 0.89. Identify CS invasion: AUROC (1-mm MRI, Reader 1) = 0.83; AUROC (1-mm MRI+DLR, Reader 1) = 0.95; AUROC (1-mm MRI, Reader 2) = 0.82; AUROC (1-mm MRI+DLR, Reader2) = 0.98. | [75] |
| 2024 | Primary intracranial germ cell tumors | iGNet based on nnUNet | Training set: 200 patients. Retrospective internal test set: 80 patients. Prospective internal test set: 22 patients. External test set 1: 22 patients. External test set 2: 20 patients | To classify germinomas and non-germinomatous germ cell tumors | Retrospective internal test set: AUROC = 0.950; Accuracy = 90.91%; Specificity = 78.40%; Sensitivity = 98.39%. Prospective internal test set: AUROC = 0.921; Accuracy = 87.10%; Specificity = 84.64%; Sensitivity = 76.47%. External test set 1: AUROC = 0.869; Accuracy = 80.00%; Specificity = 88.24%; Sensitivity = 78.33%. External test set 2: AUROC = 0.905; Accuracy = 89.56%; Specificity = 76.47%; Sensitivity = 89.79%. | [76] |
| 2023 | Intra-axial mass-like lesions | U-Net and CNN | Training set: 747 patientsTest set: 130 patients | To give referral suggestions and diagnose tumors | Referral accuracy = 72.3%. Tumor distinguish results: AUROC = 0.90; Accuracy = 87.7%; Sensitivity = 90.2%; Specificity = 81.6%. | [77] |
| 2022 | Breast cancer | 3D-ResNet18 | Training set: 14198 MRI examinations. Internal validation set: 3403 MRI examinations. Internal test set: 3936 MRI examinations. External test set 1: 397 MRI examinations. External test set 2: 922 MRI examinations.External test set 3: 131 MRI examinations | To diagnose breast cancer | Internal set: AUROC = 0.924; AUPRC = 0.720.External set 1: AUROC = 0.788; AUPRC = 0.591.External set 2: AUROC = 0.969; AUPRC = 0.977.External set 3: AUROC = 0.966; AUPRC = 0.973. | [78] |
| 2021 | Prostate cancer | Inception-V1 | Internal set: 228 patientsTCIA set: 172 patients | To diagnose prostate cancer | AUROC = 0.89; NPV = 81.6%; PPV = 81.9%; Specificity = 82%; Sensitivity = 81.5%; Accuracy = 81.8%. | [79] |
| 2022 | Prostate cancer | CorrSigNIA based on correlational neural network and modified holistically nested edge detection (HED) | C1 cohort: 129 patientsC2 cohort: 275 patientsC3 cohort: 39 patients | To differentiate between normal tissues, indolent cancer, and aggressive cancer | Detect cancer (lesion level): AUROC (C1-test cohort) = 0.81; AUROC (C2 cohort) = 0.81. Detect clinically significant cancer (lesion level): AUROC (C1-test cohort) = 0.82; AUROC (C2 cohort) = 0.86. Patient level evaluation in C1-test and C3 cohort: Sensitivity = 0.78; Specificity = 0.87; Precision = 0.96; NPV = 0.52; F1-score = 0.86; Accuracy = 0.80. | [80] |
| 2022 | Prostate cancer | PSP-Net and VGG16 | Training set: 50 patientsTest set: 20 patients | To segment and diagnose prostate tumor | Segmentation: Dice = 91.3%. Classification: Accuracy = 87.95%; Precision = 87.33%; Recall = 89.73%; AUROC = 0.87. | [81] |
| 2024 | Oral and oropharyngeal squamous cell carcinoma | ResNet50 | Cohort A: 121 patients (70% in training set and 30% in test set)Cohort B: 198 patients (68 in external validation set 1 and 130 in external validation set 2) | To predict occult cervical lymph node metastasis | Test set: AUROC = 0.878; Accuracy = 0.868; Specificity = 1.000; Sensitivity = 0.808; PPV = 1.000; NPV = 0.706. External validation set 1: AUROC = 0.796; Accuracy = 0.761; Specificity = 0.950; Sensitivity = 0.615; PPV = 0.941; NPV = 0.655. External validation set 2: AUROC = 0.834; Accuracy = 0.784; Specificity = 0.600; Sensitivity = 0.962; PPV = 0.714; NPV = 0.938. | [82] |
| 2021 | Bone lesions | EfficientNet-B0 | Training set: 678 lesionsInternal validation set: 192 lesionsInternal testing set: 93 lesionsExternal testing set: 97 lesions | To differentiate benign and malignant bone lesions | Internal test set: Accuracy (Ensemble model) = 0.76; Accuracy (Expert committee) = 0.73; F1-score (Ensemble model) = 0.75; F1-score (Expert committee) = 0.73.External test set: F1-score (Ensemble model) = 0.70; Accuracy (Ensemble model) = 0.73. | [83] |
| 2024 | Musculoskeletal tumors | MSAPN based on cascade encoder-decoder | Training set: 124 patientsInternal testing set: 26 patientsExternal validation set: 20 patients | To segment and classify tumors | Segmentation results: DSC (test set) = 0.871; DSC (validation set) = 0.815.Classification results: Accuracy = 0.890, Sensitivity = 0.825; Specificity = 0.936; AUROC = 0.963. | [84] |
| 2024 | Soft-tissue tumors | nnU-net and InteractiveNet | Training set: 116 patients. External validation set (USA): 150 patients.External validation set (UK): 208 patients. Prospective validation set: 86 patients | To differentiate between lipoma and atypical lipomatous tumor | AUROC (training and internal validation) = 0.84; AUROC (USA cohort) = 0.77; AUROC (UK cohort) = 0.87; AUROC (Prospective cohort) = 0.92. | [85] |
| 2021 | Lung cancer | ResNet-18 | 359 patients | To diagnose lung cancer | AUROC (conventional CT model) = 0.817; AUROC (conventional CT with SUVmax) = 0.823; AUROC (conventional CT with lesion size) = 0.861; AUROC (conventional CT with SUVmax and lesion size) = 0.877. AUROC (PET/CT model) = 0.762; AUROC (PET/CT with SUVmax) = 0.784; AUROC (PET/CT with lesion size) = 0.821; AUROC (PET/CT with SUVmax and lesion size) = 0.837. | [86] |
| 2022 | Colorectal cancer | 3D CNN | Training set: 107 colorectal polyps from 63 patientsExternal test set: 77 colorectal polyps from 59 patients | To differentiate between premalignant polyps and benign polyps | SEG model: AUROC = 0.83; Sensitivity = 80%; Specificity = 69%; AUROC (6~9 mm) = 0.74; AUROC (≥10 mm) = 0.72.noSEG model: AUROC = 0.75; Sensitivity = 80%; Specificity = 44%; AUROC (6~9 mm) = 0.72; AUROC (≥10 mm) = 0.74. | [87] |
| 2024 | Focal liver lesions | LiLNet based on YOLOv8 and ResNet50 | Training set: 1580 patientsInternal test set: 1308 patientsHN validation set: 636 patientsCD validation set: 94 patientsGZ validation set: 205 patientsLS validation set: 216 patients | To diagnose and classify liver lesions | Test set: AUROC (LiLNet_BM) = 97.2%; Accuracy (LiLNet_BM) = 94.7%; AUROC (LiLNet_M) = 95.6%; Accuracy (LiLNet_M) = 88.7%; AUROC (LiLNet_B) = 95.9%; Accuracy (LiLNet_B) = 88.6%. HN set: AUROC (benign vs. malignant) = 94.9%; AUROC (malignant diagnosis) = 87.9%; AUROC (benign diagnosis) = 89.9%. CD set: AUROC (HCC diagnosis) = 94.2%. LS set: AUROC (HCC diagnosis) = 87.6%; AUROC (ICC) = 79.2%. GZ cohort: AUROC (HCC diagnosis) = 88.7%; AUROC (ICC) = 77.6%. | [88] |
| 2021 | Liver tumors | STIC based on CNN and RNN | Training set: 499 patientsInternal test set: 113 patientsExternal test set: 111 patients | To diagnose and classify liver tumors | Internal test set: Accuracy (HCC vs. ICC) = 86.2%; Accuracy (HCC vs. ICC vs. metastasis) = 72.6%.External test set: Accuracy = 82.9%. | [89] |
| 2025 | Liver tumors | SALSA based on 3D U-Net | Development set: 726 CT scansInternal test set: 159 CT scansExternal validation set: 713 CT scans | To detect and segment liver tumors | Tumor detection results in internal test set: Recall (patient-wise) = 99.08%; F1-score (patient-wise) = 88.88%; Recall (tumor-wise) = 70.39%; F1-score (tumor-wise) = 63.64%. Tumor detection results in external validation set: Recall (patient-wise) = 94.17%; F1-score (patient-wise) = 96.83%; Recall (tumor-wise) = 57.92%; F1-score (tumor-wise) = 67.79%. Tumor delineation results in internal test set: DSC (patient-wise) = 0.738; DSC (tumor-wise) = 0.761. Tumor delineation results in external validation set: DSC (patient-wise) = 0.737; DSC (tumor-wise) = 0.760. | [90] |
| 2023 | Pancreatic cancer | Convolutional neural network | Development set: 1023 patientsInternal test set: 256 patientsExternal test set: 1473 patients | To diagnose pancreatic cancer | Internal test set: Sensitivity = 89.9%; Specificity = 95.9%; Accuracy = 93.4%; AUROC = 0.96.External test set: Sensitivity = 89.7%; Specificity = 92.8%; Accuracy = 91.4%; AUROC = 0.95. | [91] |
| 2023 | Papillary thyroid cancer | 3D ResNet | Training set: 874 lymph nodes. Internal validation dataset: 376 lymph nodes. External dataset A: 85 lymph nodes. External dataset B: 101 lymph nodes. Real-world dataset: 113 lymph nodes | To diagnose suspicious lateral lymph nodes | Internal validation set: AUROC = 0.862; Sensitivity = 0.762; Specificity = 0.823; Accuracy = 0.785. External dataset A: AUROC = 0.889; Sensitivity = 0.855; Specificity = 0.625; Accuracy = 0.812. External dataset B: AUROC = 0.955; Sensitivity = 0.943; Specificity = 0.710; Accuracy = 0.857. Real-world dataset: AUROC = 0.829; Sensitivity = 0.839; Specificity = 0.769; Accuracy = 0.823. | [92] |
| 2023 | Oral cancer | Mask R-CNN based on ResNet101 and pyramid network | Stage Ⅰ: 5412 imagesStage Ⅱ: 5601 images | To identify, locate and distinguish metastasized lymph node | Stage I: average precision (IoU threshold = 0.50) = 72.49%.Stages II: Clinical accuracy = 85.09%. | [93] |
| 2023 | Parotid tumor | MobileNet V3 | Training set: 269 patientsInternal test set: 116 patientsExternal test set: 188 patients | To diagnose malignant parotid tumors | Internal test set: AUROC = 0.883; Accuracy = 0.828; Sensitivity = 0.861; Specificity = 0.813; PPV = 0.674; NPV = 0.929. External test set: AUROC = 0.890; Accuracy = 0.846; Sensitivity = 0.828; Specificity = 0.860; PPV = 0.716; NPV = 0.917. | [94] |
| 2021 | Breast cancer | 3D CNN | 221 CEU videos (augmentation to 270 CEU videos) | To diagnose breast cancer | Sensitivity = 97.2%; Specificity = 72.5%; Accuracy = 86.3% | [95] |
| 2022 | Breast tumors | DeepLab3+ based on Xception for semantic segmentation, and CAM-DLS for tumor recognition | Training set: 2142 imagesValidation set: 300 imagesTest set: 620 images | To segment images and diagnose breast tumors | Sensitivity = 95.8%; Precision = 92.4%; Specificity = 93.9%; Accuracy = 94.8%; F1-score = 0.941; DSC = 77.3%; IoU = 66.0% | [96] |
| 2020 | Breast cancer | ResNet50 | Training cohort: 350 patientsValidation cohort: 116 patientsIndependent cohort: 118 patients | To predict axillary lymph node status | Predict ALN status between N0 and N+ (≥1): AUROC (validation cohort) = 0.904; Accuracy (validation cohort) = 81.4%; AUROC (independent test cohort) = 0.902; Accuracy (independent test cohort) = 81.0%. Predict ALN status between N+ (1-2) and N+ (≥3): AUROC (validation cohort) = 0.925; Accuracy (validation cohort) = 88.0%; AUROC (independent test cohort) = 0.905; Accuracy (independent test cohort) = 80.0%. Predict ALN status among N0, N+ (1-2) and N+ (≥3): AUROC = 0.905. | [97] |
| 2024 | Breast cancer | DeepLabV3+ for segmentation and CNN for classification | Training set: 212 patientsValidation set: 27 patientsTest set: 27 patients | To predict lymph node metastasis | AUROC = 0.799; Accuracy = 88.89%; Sensitivity = 57.14%; Specificity = 100%; PPV = 100%; NPV = 86.96% | [98] |
| 2022 | Pancreatic cancer | YOLOv5m | 1213 images from 157 patients | To diagnose pancreatic cancer | AUROC = 0.85; Sensitivity = 95%; Specificity = 75% | [99] |
| 2022 | Ovarian cancer | DenseNet-121 | Training set: 575930 imagesInternal validation set: 8416 imagesExternal validation set 1: 1419 imagesExternal validation set 2: 6510 images | To diagnose ovarian cancer | Internal validation set: AUROC = 0.911; Accuracy = 88.8%; Sensitivity = 78.9%; Specificity = 93.2%; PPV = 83.7%; NPV = 90.9%; Kappa = 0.733; F1-score = 0.812.External validation set 1: AUROC = 0.870; Accuracy = 86.9%; Sensitivity = 40.3%; Specificity = 98.5%; PPV = 87.1%; NPV = 86.8%; Kappa = 0.486; F1-score = 0.551.External validation set 2: AUROC = 0.831, Accuracy = 85.3%; Sensitivity = 57.8%; Specificity = 91.6%; PPV = 61.1%; NPV = 90.4%; Kappa = 0.504; F1-score = 0.594. | [100] |
| 2023 | Superficial soft-tissue masses | ConvNeXt | Training set: 618 patientsInternal validation cohort: 154 patientsExternal test cohort A: 156 patientsExternal test cohort B: 123 patients | To diagnose malignant masses | Internal validation cohort: AUROC = 0.992; Accuracy = 98.7%; Sensitivity = 100.0%; Specificity = 98.6%; F1-score = 0.889. External test cohort A: AUROC = 0.979; Accuracy = 97.4%; Sensitivity = 40.0%; Specificity = 99.3%; F1-score = 0.500. External test cohort B: AUROC = 0.898; Accuracy = 91.0%; Sensitivity = 20.0%; Specificity = 97.3%; F1-score = 0.267. | [101] |
| 2022 | Lung cancer | Convolutional neural network | 19488 patients | To predict incident lung cancer | Predict within the entire follow-up period: AUROC (study sample) = 0.68; AUROC (USPSTF-eligible sample) = 0.75.Predict within 3 years: AUROC (study sample) = 0.76; AUROC (USPSTF-eligible sample) = 0.78.Predict within 5 years: AUROC (study sample) = 0.74; AUROC (USPSTF-eligible sample) = 0.78. | [102] |
| 2021 | Lung cancer | DenseNet121, ResNet50 | ChestX-ray14 cohort: 8302 imagesLIDC-IDRI cohort: 96 imagesJSRT cohort: 154 images | To diagnose lung cancer | LIDC-IDRI images: Accuracy (Test A) = 0.850; Accuracy (Test B) = 0.850; Accuracy (Test C) = 0.750; F1-score (Test A) = 0.897; F1-score (Test B) = 0.903; F1-score (Test C) = 0.815. JSRT images: Accuracy (Test A) = 0.677; Accuracy (Test B) = 0.677; Accuracy (Test C) = 0.710; F1-score (Test A) = 0.750; F1-score (Test B) = 0.737; F1-score (Test C) = 0.781. LIDC-IDRI and JSRT images: Accuracy (Test A) = 0.820; Accuracy (Test B) = 0.760; Accuracy (Test C) = 0.820; F1-score (Test A) = 0.886; F1-score (Test B) = 0.824; F1-score (Test C) = 0.870. | [103] |
| 2020 | Breast cancer | YOLO and 3 classification models (feedforward CNN, ResNet50, InceptionResNet-V2) | DDSM set: 600 imagesInbreast set: 107 images | To localize and diagnose breast cancer | DDSM set: (1) Diagnosis of breast lesions: Accuracy = 99.17%; MCC = 98.36%; Dice = 99.28%. (2) Classification of breast lesions: Specificity (CNN) = 93.66%; Specificity (ResNet-50) = 95.33%; Specificity (InceptionResNet-V2) = 98.33%; Sensitivity (CNN) = 95.33%; Sensitivity (ResNet-50) = 96.33%; Sensitivity (InceptionResNet-V2) = 97.67%.INbreast set: (1) Diagnosis of breast lesions: Accuracy = 97.27%; MCC = 93.93%; Dice = 98.02%. (2) Classification of breast lesions: Specificity (CNN) = 84.76%; Specificity (ResNet-50) = 91.43%; Specificity (InceptionResNet-V2) = 89.99%; Sensitivity (CNN) = 90.57%; Sensitivity (ResNet-50) = 93.24%; Sensitivity (InceptionResNet-V2) = 95.99%. | [104] |
| 2022 | Bone tumors | GAN and 3D CNN | 119 patients with bone tumor X-ray images and 130 bone contour images | To estimate the bone tumor necrosis rate | Threshold = 80%: Accuracy = 0.916; Recall = 0.948; Precision = 0.796; F1 score = 0.865.Threshold = 90%: Accuracy = 0.877; Recall = 0.868; Precision = 0.782; F1 score = 0.823. | [105] |
Magnetic resonance imaging
MRI is an essential imaging modality in oncology due to its superior soft tissue contrast and ability to provide detailed information regarding tumor morphology, anatomical location, and biological characteristics. However, conventional MRI interpretation often relies on expert experience and may be affected by inter-observer variability. The integration of DL into MRI analysis has provided new opportunities for automated image interpretation, improving tumor detection, segmentation, classification, and clinical decision-making.
Brain tumors represent one of the most extensively investigated applications of deep learning in MRI. Accurate tumor segmentation is essential for diagnosis, surgical planning, and treatment monitoring. To address the limitations of manual segmentation, numerous deep learning approaches have been developed. Kazemi et al. proposed a parallel AlexNet and VGGNet architecture that distinguished glioma, meningioma, and pituitary tumors on T1 weighted MRI with classification accuracies exceeding 98%, outperforming conventional machine learning methods [69]. Dénes-Fazakas et al. further introduced L-Net, which integrated U-Net with convolutional neural networks to perform tumor segmentation and classification simultaneously, reducing the misclassification rate by approximately 80% [70]. Rasool et al. developed CNN TumorNet for differentiating glioma from non tumor tissue and incorporated explainable learning strategies, achieving an accuracy of 99% while improving model interpretability [71].
In addition to tumor detection, deep learning has expanded the capability of MRI for tumor grading and non-invasive characterization. Naser et al. combined U-Net with VGG16 for lower grade glioma segmentation and grading, achieving a mean Dice score of 0.84 together with high diagnostic accuracy at both the image and patient levels [72]. Garcia Ruiz et al. developed DISCERN, which generated voxel level signatures for tumor classification and differentiated glioblastoma, brain metastasis, and primary central nervous system lymphoma without invasive biopsy. The method outperformed conventional MRI parameters, including cerebral blood volume and percentage of signal recovery, in both internal and external validation cohorts [73]. Similarly, Li et al. developed a convolutional neural network for detecting and segmenting brain metastases that achieved higher sensitivity and Dice scores than several existing approaches, particularly improving the detection of lesions smaller than 5 mm [74]. Deep learning has also improved the diagnosis of specific intracranial tumors and supported clinical decision making. Kim et al. applied deep learning reconstruction to high resolution pituitary MRI and significantly improved the detection of postoperative residual tumors and cavernous sinus invasion [75]. Li et al. developed iGNet to distinguish pediatric intracranial germ cell tumor subtypes using T2 weighted MRI, demonstrating robust performance across multiple centres [76]. Furthermore, Shin et al. established an explainable deep learning framework that accurately differentiated intra axial mass like lesions and provided effective support for patient triage [77].
The clinical utility of deep learning has also been demonstrated in several other malignancies. In breast cancer, a three-dimensional ResNet18 model showed diagnostic performance comparable with experienced breast radiologists when interpreting dynamic contrast enhanced MRI and could potentially reduce unnecessary biopsies in patients with BI-RADS category 4 lesions [78]. In prostate cancer, deep learning has improved lesion detection, localization, and segmentation. AI-biopsy achieved an area under the receiver operating characteristic curve (AUROC) of 0.89 for distinguishing malignant from benign tissue [79], CorrSigNIA improved the localization of both indolent and aggressive tumors across multiple cohorts [80], and the combination of PSP-Net with VGG16 achieved excellent performance for tumor segmentation and classification with a Dice score of 91.3% [81]. In head and neck cancer, Lan et al. developed a ResNet50 model that predicted occult cervical lymph node metastasis from MRI radiomics with consistently high performance in both internal and external validation cohorts [82]. Deep learning has also shown considerable value in musculoskeletal oncology. EfficientNet B0 demonstrated diagnostic performance comparable with experienced clinicians in differentiating benign from malignant bone lesions [83], while the MSAPN network achieved accurate tumor segmentation and malignancy classification by integrating multi scale attention with radiomics analysis [84]. In addition, an automated radiomics model validated by Spaanderman et al. accurately distinguished benign lipomas from atypical lipomatous tumors across independent cohorts, with diagnostic performance comparable to that of radiologists [85].
Overall, current evidence indicates that deep learning has substantially improved MRI interpretation across a wide range of tumor types by enhancing tumor detection, segmentation, classification, grading, and non-invasive characterization. Although most available studies remain retrospective and require prospective multi-center validation, these advances highlight the potential of deep learning to support precision oncology and facilitate clinical decision making.
Computed tomography
Computed tomography (CT) is routinely used throughout the cancer care pathway for screening, diagnosis, staging, treatment planning, and response evaluation because of its high spatial resolution and rapid image acquisition. In recent years, deep learning has markedly improved automated CT interpretation by enhancing lesion detection, tumor characterization, and metastatic risk assessment, thereby supporting more accurate and efficient clinical decision making.
Park et al. demonstrated that a deep learning model developed from CT images achieved better diagnostic performance than a PET/CT model, and that incorporating SUVmax together with lesion size further improved diagnostic accuracy [86]. Deep learning has also shown considerable promise in abdominal malignancies. For colorectal cancer, Wesp et al. developed three dimensional CNN models that successfully distinguished premalignant from benign colorectal polyps, supporting CT as a potential tool for risk stratification before intervention [87]. In liver cancer, LiLNet accurately classified six types of focal liver lesions using multiphase CT images [88], while STIC improved the differential diagnosis of HCC, intrahepatic cholangiocarcinoma, and liver metastases, achieving performance comparable with or exceeding expert interpretation [89]. In addition, the SALSA framework enabled highly accurate automated liver tumor detection and demonstrated excellent generalizability in external validation cohorts [90]. Similar advances have been reported for pancreatic cancer, where a convolutional neural network integrating automated segmentation and classification achieved high sensitivity and specificity for lesion detection in a large real world external cohort [91].
In head and neck malignancies, deep learning has further improved the diagnostic value of CT by facilitating tumor characterization and metastatic assessment. Zheng et al. integrated CT images with clinical risk factors to predict lateral lymph node metastasis in papillary thyroid cancer, achieving robust performance across multiple independent cohorts that was comparable with fine needle aspiration and expert radiologists [92].
Xu et al. developed a Mask R CNN framework for identifying cervical lymph node metastases in oral cancer, achieving diagnostic accuracy comparable with radiologists while outperforming surgeons and medical students [93]. Similarly, MobileNet V3 accurately differentiated benign from malignant salivary gland tumors and substantially improved the diagnostic performance of junior radiologists during external validation [94]. Overall, deep learning has substantially enhanced the clinical utility of CT by improving tumor detection, classification, and metastatic risk prediction across multiple cancer types.
Ultrasonography
USG is one of the most sensitive tools for cancer screening in physical examination, especially for breast cancer, prostate cancer, and cervical cancer. Currently, DL has significantly changed the traditional diagnostic ways which are dependent on the skills of USG experts, with advantages of fast operation, high accuracy, and strong objectivity. In breast cancer, Chen et al. developed a novel diagnosis model based on contrast-enhanced ultrasound (CEUS), which incorporated a 3D CNN as backbone with a channel attention module and a domain-knowledge-guided temporal attention module, achieving a sensitivity of 97.2% and an accuracy of 86.3% [95]. Li et al. proposed a 2-step DL framework for ultrasound image segmentation to further identify breast cancer, and this model achieved excellent performance (Sensitivity: 95.8%, Precision: 92.4%, Specificity: 93.9%, Accuracy: 94.8%, F1-score: 0.941) [96]. Zheng et al. applied the deep learning radiomics for predicting axillary lymph node (ALN) status in breast cancer using conventional ultrasound and shear wave elastography. ResNet50 model exhibited the best diagnostic performance when combined with clinical parameters in validation cohort and independent test cohort [97]. Wang et al. utilized DeepLabV3+ and ResNet-101 as the backbone network to segment ultrasound images and then predict ALN metastasis, providing high accuracy for clinical diagnosis with AUROC of 0.799 and accuracy of 0.889 [98]. While in pancreatic diagnosis, Tian et al. applied the YOLOv5m model to differentiate pancreatic cancer from non-pancreatic cancer lesions based on endoscopic USG images, achieving an AUROC of 0.85, a sensitivity of 95%, and a specificity of 75% [99]. Moreover, Gao et al. applied a DenseNet-121 deep convolutional neural network (DCNN) model to discriminate ovarian cancer from benign adnexal lesions with high diagnostic accuracies in both internal dataset (AUROC = 0.911, Accuracy =88.8%) and external validation datasets (Set 1: AUROC 0.870, Accuracy 86.9%; Set 2: AUROC 0.831, Accuracy 85.3%) [100]. DCNN-assisted diagnosis was superior to radiologists alone [100]. In the diagnosis of malignant superficial soft-tissue masses, Long et al. constructed a DL model based on ConvNeXt, achieving an AUROC of 0.992, an accuracy of 98.7%, and an F1-score of 0.889 in the validation cohort [101].
Collectively, these studies demonstrate the potential of DL to support various ultrasound-based cancer diagnostic tasks, including lesion classification, image segmentation, and lymph node metastasis prediction. The application of DL across different ultrasound modalities and cancer types suggests its potential to improve the efficiency and consistency of ultrasound-based cancer assessment.
X-ray imaging
X-ray imaging is an important screening and diagnostic tool for several cancer types. However, interpretation of X-ray images can be affected by reader experience, fatigue, and interruptions, potentially leading to diagnostic errors. The integration of DL into X-ray-based cancer assessment may help improve diagnostic consistency and support clinical decision making.
Lee et al. developed a CNN-based DL model that integrated chest X-rays and clinical data to stratify lung cancer risk in a large-scale retrospective cohort [102]. When combined with USPSTF criteria, it significantly reduced the number of CT screening candidates by 20% while maintaining the same cancer detection rate and positive predictive value [102]. Moreover, Horry et al. introduced a novel hybrid DL and decision tree-based computer vision model for interpretable lung cancer malignancy stratification, achieving an accuracy of 0.820 when combining LIDC-IDRI and JSRT images [103]. Al-Antari et al. developed an integrated computer-aided diagnosis (CAD) system which contained YOLO detector and distinct classifier (feedforward CNN, ResNet-50, InceptionResNet-V2) to detect and classify breast lesions in entire digital X-ray mammograms with high accuracy and speed [104]. Xu et al. proposed a new bone tumor necrosis rate detection method based on time series X-ray images instead of biopsy, which contained 3 modules (i.e., GAN for image enhancement, Conv-LSTM-GAN for time dimension characteristics utilization, 3D-CNN for lesion features extraction and classification) [105]. This model exhibited excellent performance (accuracy was 0.877 at the threshold of 90% and accuracy was 0.916 at the threshold of 80%) and was close to the result of biopsy [105].
Collectively, these studies indicate that DL can extend the application of X-ray imaging from image-based lesion detection to risk stratification and quantitative assessment of treatment related tumor characteristics. The integration of imaging findings with clinical information may further enhance the clinical utility of X-ray-based cancer assessment.
Deep learning applications in laboratory diagnostics
Blood cell morphology analysis
Morphological assessment of blood cells (including peripheral and bone marrow cells) is widely recognized as the gold diagnostic standard for hematologic malignancies [106]. Conventional manual microscopy evaluation is time-consuming, labor-intensive, and susceptible to inter- and intra-observer variability. In contrast, DL can automatically extract features from cytological images and enhance diagnostic accuracy and operational efficiency. For example, Matek et al. applied ResNeXt-50 to analyze the largest expert-annotated bone marrow (BM) cytology image data set (including 171374 BM smear images from 945 patients who were diagnosed with a variety of hematologic diseases) and this model achieved high precision and recall in identifying diagnostically relevant leukocytes [107]. Sun et al. proposed DeepHeme, a snapshot-ensemble DL classifier, which was trained on over 30,000 BM smear images [108]. Its cell classification performance was equivalent to senior pathologists or even surpassed human performance [108]. Zhang et al. developed multiple DL models with distinct architectures and trained on over 10000 single plasma cell images from BM smears to distinguish multiple myeloma from systemic light chain amyloidosis [109]. Surprisingly, the ResNet101 achieved 100% accuracy [109]. Eckardt et al. applied a multi-step DL approach to automatically segment BM cells from smear images and distinguish acute myeloid leukemia (AML) samples from healthy controls with an AUROC of 0.9699 [110]. Rastogi et al. utilized the LeuFeatx, a VGG16-adapted feature-extractor model, to diagnose acute leukemia based on peripheral blood (PB) smear images, achieving over 90% accuracy in different datasets [111]. Sun et al. developed the MDA-LeukoLens system, which combined 2 CNN models with a diagnostic feature-based rule algorithm to identify acute promyelocytic leukemia (APL) cells in peripheral blood smear images, with 99.1% accuracy in internal cohort and 98.1% accuracy in external cohort [112]. Kimura et al. combined CNN with eXtreme gradient boosting (XGBoost) to automatically classify myelodysplastic syndromes (MDS) from aplastic anemia based on PB smear images, achieving 96.2% sensitivity, 100% specificity, and 0.990 AUROC [113]. Explainable AI can provide clear interpretable and transparent reasoning for its decisions. To further enhance the model interpretability, Hehr et al. proposed SCEMILA, an inherently explainable single-cell-based multiple instance learning algorithm, which discriminated 4 WHO-defined genetic AML subtypes and highlighted diagnostically relevant cells without requiring single-cell annotations [114]. Sidhom et al. built an explainable DL model for PB smear images analysis that rapidly and accurately distinguished t(15;17)-positive APL from non-APL AML with an AUROC of 0.861, and used integrated gradients to reveal novel APL-specific chromatin condensation morphologies [115]. Detailed information was shown in Table 3.
Deep learning application in blood cell morphology.
| Year | Cancer type | Method | Cohort Size | Objective | Performance | Ref. |
|---|---|---|---|---|---|---|
| 2021 | Multiple hematological diseases | ResNeXt-50 | 171374 images from 945 patients | To classify bone marrow cell morphologies | Tolerant evaluation: Highest precision = 0.95; Highest recall = 0.91.Strict evaluation: Highest precision = 0.92; Highest recall = 0.91. | [107] |
| 2025 | Multiple hematological diseases | DeepHeme based on CNN | Training set: 30394 images from 40 patients Internal test set: 8507 images from 10 patients External validation set (MSK-normal): 2694 images from 10 patients (morphologically normal) External validation set (MSK-mixed): 11076 images from 655 patients (with normal or diseased marrow) | To classify bone marrow cell morphologies | Internal test (UCSF set): Mean F1-score = 0.92.External validation (MSK-normal set): F1-score = 0.89.External validation (MSK-mixed set): F1-score = 0.84. | [108] |
| 2024 | Multiple myeloma and systemic light chain amyloidosis | ShuffleNet, ResNet50, ResNet101, SqueezeNet, Inceptionv3, MobileNetv2 | —— | To differentiate between multiple myeloma and systemic light chain amyloidosis | ShuffleNet: Accuracy = 0.99; AUROC = 0.9949. ResNet50: Accuracy = 0.99; AUROC = 0.9936. ResNet101: Accuracy = 1.00; AUROC = 0.9962. SqueezeNet: Accuracy = 0.99; AUROC = 0.9949. Inceptionv3: Accuracy = 0.97; AUROC = 0.9720. MobileNetv2: Accuracy = 0.99; AUROC = 0.99. | [109] |
| 2022 | Acute myeloid leukemia | Xception and ResNet50 | Training set: 8505 imagesTest set: 2127 images | To distinguish between AML and healthy controls | AUROC = 0.9699; AUPRC = 0.9691; Micro-average accuracy = 0.91. | [110] |
| 2022 | Acute myeloid leukemia | LeuFeatx based on VGG16 | AML Morphological dataset: 18365 imagesPBS-HCB dataset: 17092 imagesALL_IDB2: 260 images | To classify leukocyte subtypes | AML Morphological dataset: (1) LeuFeatx+XGB: Precision = 0.577; Recall = 0.643; F1-score = 0.605; (2) LeuFeatx+RF: Precision = 0.572; Recall = 0.604; F1-score = 0.585; (3) LeuFeatx+ETC: Precision = 0.580; Recall = 0.582; F1-score = 0.575; (4) LeuFeatx+SVM: Precision = 0.601; Recall = 0.591; F1-score = 0.592.PBS-HCB dataset: Accuracy (LeuFeatx+ETC) = 90.5%; Accuracy (LeuFeatx+RF) = 90.1%; Accuracy (LeuFeatx+XGB) = 92%; Accuracy (LeuFeatx+SVM) = 91.62%.ALL_IDB2 dataset: Accuracy (LeuFeatx+ETC) = 96.15%; Accuracy (LeuFeatx+RF) = 95.76%; Accuracy (LeuFeatx+XGB) = 92.67%; Accuracy (LeuFeatx+SVM) = 92.3%. | [111] |
| 2025 | Acute promyelocytic leukemia | MDA-LeukoLens based on convolutional neural network | Internal cohort: 22359 cells from 216 patientsExternal cohort: 14375 cells from 101 patients | To classify acute promyelocytic leukemia cells | Internal cohort: Accuracy = 0.991; Sensitivity = 0.965.External cohort: Accuracy = 0.981; Sensitivity = 0.965. | [112] |
| 2019 | Myelodysplastic syndrome | Convolutional neural network and XGBoost | 695030 images from 3261 peripheral blood smears | To distinguish MDS from aplastic anemia | Sensitivity = 96.2%; Specificity = 100%; AUROC = 0.990. | [113] |
| 2023 | Acute myeloid leukemia | SCEMILA based on ResNet34 | 81214 single cell images from 189 patients | To classify distinct genetic subtypes of AML | F1-score (PML::RARA) = 0.86; F1-score (NPM1) = 0.75; F1-score (CBFB::MYH11) = 0.69; F1-score (RUNX1::RUNX1T1) = 0.75; F1-score (Control) = 1.0. | [114] |
| 2021 | Acute promyelocytic leukemia | Convolutional neural network and multiple-instance learning | 106 patients | To identify t(15;17) positive APL | AUROC (Discovery cohort) = 0.890; AUROC (Validation cohort) = 0.743. | [115] |
Collectively, these studies demonstrate that DL can support hematologic diagnosis through automated cell classification, disease discrimination, and identification of diagnostically relevant morphological features. The incorporation of explainability further provides opportunities to link model predictions with recognizable cellular characteristics, which may facilitate the use of DL as a decision support tool in hematologic diagnostics.
Chromosome analysis
Chromosome analysis is an established technique in cytogenetics but traditionally relies heavily on manual examination, which is time consuming and labor intensive and may result in limited throughput and variability in analysis. DL has therefore been explored to automate chromosome segmentation, classification, and detection of cytogenetic abnormalities. Chen et al. developed KaryoXpert, a framework that integrated morphological algorithms with DL models for chromosome segmentation and classification. The system eliminated the need for manual mask annotation and achieved high accuracy and robustness in karyotyping analysis [116].
The Ph chromosome, characterized by the t(9;22)(q34;q11) translocation, is one of the most common and extensively studied cytogenetic abnormalities in hematologic malignancies. The breakpoint cluster region-Abelson (BCR-ABL) oncogene is the result of Ph chromosome, and is responsible for chronic myeloid leukemia (CML) and a part of ALL. Pravalphruekul et al. developed a CNN-based DL framework for Ph detection with a sensitivity of 0.99, a specificity of 0.59, and an accuracy of 79%, reducing the workload of medical technicians and the detection time, while decreasing the diagnostic costs [117]. Similarly, Yan et al. developed a customized ResNet50 model to detect t(9;22) chromosome translocation in CML, and achieved an average accuracy of 97.5% [118]. Moreover, Wang et al. developed an end-to-end DL system for R-banded karyotype analysis from BM, which integrated denoising, segmentation, classification, and polarity-recognition modules [119]. This system achieved 93.33% and 99.06% accuracy in an automatic and a semiautomatic workflow respectively, demonstrating strong clinical potential for hematologic malignancy diagnosis [119]. Xia et al. developed ChromTR, a Deformable DETR-based framework that unified semantic feature and class-distribution learning to detect and classify 24 classes of chromosomes in raw metaphase images [120]. This model showed 95.00% precision on chromosome detection and over 98% precision on chromosome enumeration when combining semantic feature learning network (SFLN), semantic-aware Transformer (SAT) and category distribution reasoning module (CDRM) [120].
The structural chromosome abnormalities (SCAs) contain deletions, duplications, inversions, and translocations, which are critical biomarkers used in the diagnosis, prognostic assessment, and identification of therapeutic targets for multiple cancer types. Bechar et al. developed multiple Siamese CNN-based methods to automatically detect SCAs [121]. Among them, the Xception model achieved top performance without data augmentation and InceptionResNetV2 excelled with undersampling data augmentation and oversampling data augmentation in detecting del(5q), respectively [121]. Interestingly, these methods were also especially suitable for detection of inv(3) abnormality, which was also a prevalent chromosomal variation [121]. In hematopathology, recurrent structural cytogenetic abnormalities provide important prognostic indicators for risk stratification, but they are laborious to identify for expert cytogeneticists. However, Cox et al. leveraged a ResNet50-based CNN classifier to accurately identify these recurrent abnormalities in hematologic malignancies, achieving a mean weighted F1-score of 96.86 % on the validation set and 94.03% on the test set [122]. Furthermore, another study employed conditional GAN to generate realistic single-chromosome images with user-defined banding patterns, addressing the challenge of limited training datasets in cytogenetics owing to high annotation costs and the rarity of certain genetic disorders [123]. Taken together, DL models provided new intelligent methods for chromosome analysis. More detailed information was shown in Table 4.
Deep learning application in chromosome analysis.
| Year | Cancer Type | Method | Cohort Size | Objective | Performance | Ref. |
|---|---|---|---|---|---|---|
| 2024 | —— | KaryoXpert based on ResNet50 and Yolov7 | Ikaros dataset: 1500 imagesTseng dataset: 5000 images | To segment and classify chromosome | Chromosome segmentation:(1) Ikaros dataset: BBox AP@0.5 = 0.982; BBox mAP = 0.799; BBox mAR = 0.853; Seg AP@0.5 = 0.962; Seg mAP = 0.719; Seg mAR = 0.818.(2) Tseng dataset: BBox AP@0.5 = 0.863; BBox mAP = 0.602; BBox mAR = 0.715Chromosome classification: Accuracy@1 = 0.9706; Accuracy@5 = 0.9963. | [116] |
| 2020 | Chronic myeloid leukemia | Convolutional neural network | 2600 images | To detect Ph chromosome | Sensitivity = 0.99; Specificity = 0.59; Accuracy = 0.79. | [117] |
| 2019 | Chronic myeloid leukemia | ResNet50 | 200 patients | To detect t(9;22) chromosome translocation | Average accuracy = 97.5%. | [118] |
| 2024 | Hematologic malignancies | Convolutional neural network | 4442 images from 1435 patients | To analyze R-banded karyotypes of bone marrow metaphases | Accuracy (automatic strategy) = 93.33%.Accuracy (semiautomatic strategy) = 99.06%. | [119] |
| 2024 | Hematologic malignancies | ChromTR based on Deformable DETR | R-band cohort: 1404 imagesAutoKary2022: 595 images | To detect and classify 24 types of chromosomes | Chromosome detection:Precision = 95.00%; Recall = 87.39%; F1-score = 91.04%; AP50 = 92.56%; mAP = 76.99%.Chromosome enumeration:(1) Collected R-band metaphase images: Precision = 98.53%; Recall = 90.16%; F1-score = 94.16%; AP50 = 95.63%; mAP = 79.31%.(2) AutoKary2022 dataset: Precision = 98.14%; Recall = 81.43%; F1-score = 89.01%; AP50 = 91.46%; mAP = 69.31%. | [120] |
| 2023 | Hematologic malignancies | Convolutional neural network with Siamese architecture | 930 pairs of chromosomes | To detect structural chromosomal abnormalities | Xception (m=5) was the best model without data augmentation: Accuracy = 98.88%; Sensitivity = 98.56%; Specificity = 99.00%; F1-score = 97.50%.InceptionResNetV2 (m=1) was the best model with undersampling data augmentation: Accuracy = 97.88%; Sensitivity = 96.78%; Specificity = 98.16%; F1-score = 95.06%.InceptionResNetV2 (m=10) was the best model with oversampling data augmentation: Accuracy = 98.66%; Sensitivity = 97.58%; Specificity = 99.00%; F1-score = 97.01%. | [121] |
| 2022 | Hematologic malignancies | ResNet50 | 276 patients | To classify cytogenetic abnormalities | Validation set: Mean weighted F1-score = 96.86%.Test set: Mean weighted F1-score = 94.03%. | [122] |
| 2022 | Leukemia | Conditional GAN | PKi-3 dataset: 612 karyotypesSelf-collected dataset: 445 karyotypes | To synthesize chromosome images | Test (real): DICE = 0.815; MAENB = 0.109.Test (perlin): DICE = 0.710; MAENB = 0.162. | [123] |
Collectively, these studies demonstrate that DL can automate multiple steps of chromosome analysis, ranging from chromosome segmentation and karyotyping to the detection of specific translocations and structural abnormalities. The ability to integrate image processing, chromosome classification, and abnormality detection may help improve the efficiency and standardization of cytogenetic analysis.
Flow cytometric analysis
FCM analysis can rapidly identify and characterize cancer cells based on their phenotypic markers, supporting cancer diagnosis, prognostic assessment, and monitoring of treatment response. The integration of DL with FCM has enabled automated cell classification and analysis of high dimensional cytometric data. Blampey et al. developed Scyan, a biology driven tool based on a deep generative model that uses expert prior knowledge of the antibody panel to automatically annotate cell types in cytometry data. Scyan achieved higher balanced accuracy and F1 scores than other evaluated models, with improvements of approximately 20 percentage points [124]. Researchers also developed a Transformer based neural network that directly identified blast cells and estimated minimal residual disease (MRD) from multiparameter FCM data, achieving a median F1 score of approximately 0.94 [125]. In addition, a DL model integrating ResNet 50 and EverFlow was trained on EuroFlow ALOT FCM data from 241 patients with leukemia and achieved accuracies of 94.6% for acute myeloid leukemia (AML) and 98.2% for B cell acute lymphoblastic leukemia (B-ALL) [126]. Zhao et al. converted multiparameter FCM data into multicolor two-dimensional images using self-organizing maps and subsequently classified healthy samples and seven mature B cell neoplasm subtypes using a CNN model. The model achieved a weighted F1 score of 0.94 on 2,348 test samples, demonstrating the feasibility of image-based DL for the classification of B cell malignancies [127]. Vora et al. developed a DL based confocal backscatter and fluorescence flow cytometry (BSFC) model for detecting rare circulating tumor cell clusters (CTCCs). Using rat whole blood spiked with human breast cancer cells, the model achieved a purity of 72% for CTCC detection with a low false alarm rate [128]. Wei et al. developed BloodPatrol, a cloud computing and Internet of Things enabled dynamic monitoring system for blood cancer diagnosis. The model incorporated an intelligent feature weight fusion mechanism to integrate information from cell samples and features and achieved AUROCs of 0.980 for B-ALL and 0.957 for chronic lymphocytic leukemia (CLL) [129].
With the increasing dimensionality and throughput of cytometric data, imaging flow cytometry (IFC) and digital holographic FCM have provided additional opportunities to capture cellular morphology and quantitative information. These imaging-based approaches also require computational methods, including ML and DL, to process large scale cell images and extract clinically relevant features. For example, Otesteanu et al. developed iCellCnn, a weakly supervised CNN for label free IFC based blood analysis, which diagnosed Sézary syndrome using bright field IFC images of T cells from human peripheral blood mononuclear cell samples, achieving 100% accuracy across nine samples [130]. Hybel et al. developed a VGG16 based DL model to distinguish leukemic stem cells (LSCs) from healthy hematopoietic stem cells (HSCs) using bright field, side scatter, and DNA images, establishing an IFC based AI platform for label free LSC monitoring in AML. Combining bright field and DNA images achieved higher accuracy than bright field images alone (93.42% vs. 86.96%), whereas side scatter images provided limited additional discriminatory information [131]. In addition, digital holographic FCM combined with ML and DL classifiers has been used to distinguish cancerous from normal urine cells using high throughput, label free quantitative phase images. Among the evaluated models, MobileNetV2 achieved a sensitivity of 94.1% and a specificity of 92.3% [132]. In summary, DL models revolutionized traditional FCM analysis. More detailed information was shown in Table 5.
Deep learning application in flow cytometric analysis.
| Year | Cancer type | Method | Cohort Size | Objective | Performance | Ref. |
|---|---|---|---|---|---|---|
| 2023 | —— | Scyan based on normalizing flow with invertible transformation network | AML cohort: 104184 cellsBMMC cohort: 61725 cellsPOISED cohort: 4178320 cells | To annotate cell types | The balanced accuracy and F1-score of Scyan were 20 percentage points higher compared to other models. | [124] |
| 2022 | Acute lymphoblastic leukemia | Transformer | Vienna cohort: 519 samplesBerlin cohort: 72 samplesBuenos Aires cohort: 65 samples | To identify leukemia blast cells and calculate MRD value | Median F1-score of about 0.94. | [125] |
| 2024 | Acute leukemia | ResNet-50 and EverFlow | 241 patients | To screen acute leukemia and classify between physiological and pathological cells | Normal: F1-score = 60.0%; Accuracy = 78.6%; Sensitivity = 69.2%; Specificity = 81.4%. AML: F1-score = 85.7%; Accuracy = 94.6%; Sensitivity = 90.0%; Specificity = 95.7%. B-ALL: F1-score = 95.2%; Accuracy = 98.2%; Sensitivity = 90.9%; Specificity = 100.0%. Complex: F1-score = 41.7%; Accuracy = 75.0%; Sensitivity = 35.7%; Specificity = 88.1%. Other disease: F1-score = 75.0%; Accuracy = 92.9%; Sensitivity = 75.0%; Specificity = 95.8%. | [126] |
| 2020 | Mature B-cell neoplasm | Self-organizing map and convolutional neural network | Training set: 18274 samplesTest set: 2348 samples | To classify B-cell neoplasm subtypes | Weighted F1-score = 0.94; Average F1-score = 0.78. | [127] |
| 2023 | Metastatic cancer | DeepPeak based on convolutional neural network | —— | To detect rare circulating tumor cell clusters | Purity = 72%; Sensitivity = 35.3%; Specificity = 99.97%; F1-score = 0.474. | [128] |
| 2024 | Chronic lymphocytic leukemia and B-cell acute lymphoblastic leukemia | BloodPatrol based on Transformer | B-ALL cohort: 178 patientsCLL cohort: 288 patients | To diagnose CLL and B-ALL | B-ALL: AUROC = 0.980; AUPRC = 0.963; Accuracy = 0.942; Precision = 0.932; Recall = 0.866; F1-score = 0.891.CLL: AUROC = 0.957; AUPRC = 0.984; Accuracy = 0.885; Precision = 1.000; Recall = 0.837; F1-score = 0.911. | [129] |
| 2021 | Sézary syndrome | iCellCnn based on convolutional autoencoder and random forest | Over 100000 images from 9 individuals (5 SS patients and 4 healthy donors) | To diagnose sézary syndrome | Accuracy = 100%. | [130] |
| 2024 | Acute myeloid leukemia | VGG-16 | 5 AML patients and 10 healthy donors | To differentiate between hematopoietic and leukemic stem cells | BF: Accuracy = 86.96%; Precision = 88.39%; Recall = 86.96%; F1-score = 86.54%. SSC: Accuracy = 61.96%; Precision = 62.00%; Recall = 61.96%; F1-score = 61.93%. DNA: Accuracy = 74.66%; Precision = 74.74%; Recall = 74.66%; F1-score = 74.64%. SSC+DNA: Accuracy = 79.37%; Precision = 79.37%; Recall = 79.37%; F1-score = 79.36%. BF+SSC: Accuracy = 86.56%; Precision = 87.50%; Recall = 86.56%; F1-score = 86.48%. BF+DNA: Accuracy = 93.42%; Precision = 93.50%; Recall = 93.42%; F1-score = 93.42%. BF+SSC+DNA: Accuracy = 93.25%; Precision = 93.26%; Recall = 93.25%; F1-score = 93.25%. | [131] |
| 2024 | Urothelial carcinoma | Transfer learning with multiple architectures | 4823 cells in simulative dataset and 5349 cells in real dataset | To identify cancer cells in urine samples | The best model MobileNetv2 achieved sensitivity of 94.1% and specificity of 92.3%. | [132] |
Collectively, these studies demonstrate that DL can extend FCM analysis from automated cell annotation and classification to MRD assessment, disease subtype identification, and high dimensional cellular imaging analysis. The combination of conventional FCM with imaging-based technologies may further expand the range of cellular features available for computational diagnosis.
Next-generation sequencing
NGS technology, characterized by high throughput and precision, is widely used in genomics, epigenomics, as well as transcriptomics, providing new understandings into the molecular pathogenesis of cancer initiation and development [133]. DL models can rapidly extract key points from complex and redundant NGS data, thereby expediting decision making.
Kaczmarek et al. developed a deep learning-based cancer classifier to distinguish neoplastic from non-neoplastic tissues using miRNA expression profiles, achieving accuracies of 98.8% in breast cancer and 84.8% in skin cancer [134]. Borah et al. proposed a comprehensive approach that combined a hybrid feature selection (HFS) technique with a hybrid deep recurrent neural network model (DOMSCNet) to detect optimal features from multi-layer omics datasets and classify stomach cancer effectively [135]. In addition, this model was generalizable and could be applied to deal with multiple types of data without any major structural changes, demonstrating high performance across all 4 multi-layer omics datasets (exon, mRNA, miRNA, and DNA methylation) [135]. Li et al. constructed the DISMIR model based on modified DanQ architectures to achieve non-invasive classification of HCC with high AUROC value using plasma cell-free DNA sequence and methylation signatures [136].
Beyond cancer classification, DL has also been applied to improve the detection of low frequency variants in sequencing data. Conventional NGS analysis may fail to distinguish low frequency variants from background sequencing errors, particularly when the variant allele frequency is low. To address this limitation, Christensen et al. developed DREAMS (deep read level modeling of sequencing errors), a DL framework designed to estimate position specific sequencing error rates at the individual read level [137]. Based on this framework, DREAMS vc and DREAMS cc were further developed for sensitive circulating tumor DNA (ctDNA) variant calling and cancer status detection, respectively [137]. The framework improved liquid biopsy sensitivity by modeling position specific sequencing errors and enabled the detection of ctDNA signals in preoperative plasma samples from 73% of stage II and 34% of stage I colorectal cancer (CRC) patients [137]. These findings highlight the potential of DL enhanced NGS analysis for detecting molecular signals at low abundance and supporting earlier non-invasive cancer detection. More representative studies and detailed performance data are summarized in Table 6 [138-148].
Deep learning application in next-generation sequencing.
| Year | Cancer type | Method | Cohort Size | Objective | Performance | Ref. |
|---|---|---|---|---|---|---|
| 2022 | Breast cancer and skin cancer | Deep cancer classifier (DCC) based on ensemble deep neural network | Neoplastic tissue: 750 samplesNon-neoplastic tissue: 281 samples | To recognize neoplastic tissues | Breast cancer: Accuracy = 98.8%; Sensitivity = 100%; Specificity = 94.8%; AUROC = 99.9%; PPV = 98.5%.Skin cancer: Accuracy = 84.8%; Sensitivity = 86.8%; Specificity = 83.4%; AUROC = 93.4%; PPV = 79.2%. | [134] |
| 2025 | Stomach cancer | DOMSCNet based on hybrid deep recurrent neural network | TCGA-STAD dataset: 450 exon expression samples, 388 mRNA expression samples, 477 miRNA expression samples, 138 DNA methylation samplesExternal cohorts: 8 external datasets from NCBI GEO and TCGA-LIHC | To classify stomach cancer | TCGA-STAD dataset: AUROC (exon) = 0.988; AUROC (mRNA) = 0.986; AUROC (miRNA) = 0.990; AUROC (DNA methylation) = 0.971.TCGA-LIHC: AUROC (exon) = 0.994; AUROC (mRNA) = 0.987; AUROC (miRNA) = 0.988; AUROC (DNA methylation) = 0.993.NCBI-GEO: AUROC (gene) = 0.929; AUROC (miRNA) = 0.871; AUROC (CpG) = 0.914; AUROC (CpG-cervix) = 0.978. | [135] |
| 2021 | Hepatocellular carcinoma | DISMIR based on modified DanQ architecture | Cancer tissue data from 13 individuals, and cfDNA data from 64 individuals | To predict the source of cfDNA and diagnose cancer | AUROC (standard sequencing depth) = 0.9969; AUROC (low sequencing depth) = 0.9112. | [136] |
| 2023 | Colorectal cancer | DREAMS based on multilayer perceptron | 85 patients | To detect cancer mutations and determine cancer status | This model can detect ctDNA signals in pre-operative plasma samples from stage II (73%) and stage I (34%) CRC patients. | [137] |
| 2025 | Pan-cancer | MiMSI based on ResNet | Training set: 741 samplesInternal test set: 317 samplesProspective cohort: 5037 samplesMSK-IMPACT cohort: 45112 samples | To detect microsatellite instability | Internal test: Accuracy = 0.942; Sensitivity = 0.895; Specificity = 0.988; AUROC = 0.971.Prospective cohort: Overall sensitivity = 91.6%.Global MSK-IMPACT cohort: Overall concordance = 96%. | [138] |
| 2024 | Breast cancer | Deep neural network | 66 paired samples | To detect breast cancer | This model achieved a mean classification accuracy of 99.0%. | [139] |
| 2024 | Pan-cancer | GENESO based on long short-term memory and symmetrical occlusion algorithm | 3524 samples | To classify pan-cancer | Baseline model: Accuracy = 96.59%.SO-optimized model: Accuracy = 98.30%.Metastasized cancer classification: Accuracy = 88.89%. | [140] |
| 2024 | Colorectal cancer | scPanel based on graph attention network, LR, SVM, RF and kNN | 63 patients (38 with iCMS2 subtype and 25 with iCMS3 subtype) | To classify colorectal cancer subtypes with different prognosis | Accuracy = 0.92; F1-score = 0.92; Sensitivity = 0.92; Specificity = 1.00; Precision = 0.93. | [141] |
| 2024 | Pan-cancer | Graph convolutional network and graph attention network | Pan-cancer dataset: 9027 samplesBRCA dataset: 981 samples | To classify cancer molecular subtypes | GAT in pan-cancer dataset: Accuracy = 83.9%; F1-score = 0.84.GCN in pan-cancer dataset: Accuracy = 81.2%; F1-score = 0.81.GAT in BRCA dataset: Accuracy = 86.4%; F1-score = 0.87.GCN in BRCA dataset: Accuracy = 83.8%; F1-score = 0.84. | [142] |
| 2024 | Pan-cancer | TabDEG based on TabNet architecture | 11000 samples of 10 tumor types | To identify DEGs and predict upregulation or downregulation | Average performance in 10 types of cancer: Accuracy = 93.60%; Precision = 93.60%; Recall = 93.60%; F1-score = 93.60%. | [143] |
| 2023 | Pan-cancer | GENIUS based on convolutional neural network | TCGA cohort: 2307 samplesIndependent cohort 1: 535 samplesIndependent cohort 2: 348 samples | To predict metastatic cancer | AUROC (square image data transformation) = 0.87. | [144] |
| 2022 | Pan-cancer | scDEAL based on domain-adaptive neural network | Data of 1280 cell lines, 1557 drugs and 15962 gene expression profiles | To predict cancer drug responses | F1-score = 0.892; AUROC = 0.898; AP = 0.944; Precision = 0.926; Recall = 0.899; AMI = 0.528; ARI = 0.608. | [145] |
| 2022 | Pan-cancer | Bulk2Space based on β-VAE | Large scale of public data from literature, GEO and TCGA | To deconvolve bulk RNA-seq into spatially resolved single-cell transcriptomes | Bulk2Space outperformed previous methods (RCTD, SpatialDWLS) in spatial deconvolution benchmarks. Its Pearson correlation coefficients were greater than 0.9 in spatial gene prediction, which was superior to generative models (GAN, cGAN). | [146] |
| 2022 | Gastric cancer | DeepDTI based on deep neural network | 301 gastric cancer samples and 142 healthy donor samples | To predict the interaction between drugs and target proteins | Validation set: Accuracy = 93.061%; AUROC = 0.983.Test set: Accuracy = 93.351%; AUROC = 0.982. | [147] |
| 2021 | Pan-cancer | PathDeep based on deep neural network | 19131 samples (10964 cancer samples and 8167 normal samples) | To distinguish between cancer tissues and normal tissues | Accuracy = 0.994. | [148] |
Collectively, DL has expanded the application of NGS from conventional molecular profiling to cancer classification, multi omics integration, and low frequency variant detection. These approaches may enhance the ability of NGS to identify clinically relevant molecular signals that are difficult to detect using conventional analytical methods.
Fluorescence in situ hybridization
FISH technology is widely used in cancer diagnosis and molecular characterization, particularly for detecting gene amplification and chromosomal abnormalities [149]. However, FISH images can present challenges for automated analysis, including low contrast, indistinct cell boundaries, overlapping or clustered cells, and substantial variation in cell morphology and signal intensity. These factors can complicate cell identification, image segmentation, and signal detection.
To address these challenges, Wang et al. developed a soft sampling cascade DL model based on ResNeXt50 together with a signal detection model to assist the assessment of human epidermal growth factor receptor 2 (HER2) amplification status using FISH and dual in situ hybridization (DISH) images. The model achieved high accuracy, recall, and F1 score and also showed good performance in gastric cancer samples [150]. Zakrzewski et al. developed a DL pipeline based on RetinaNet, ResNet50, and a feature pyramid network to detect HER2 gene amplification in FISH images from breast and gastric cancer tissues [151]. The two-stage approach localized and classified interphase nuclei and subsequently detected and quantified HER2 and CEN17 FISH signals, achieving an image-wide classification accuracy of 96.5% [151]. Höfener et al. developed a density-based DL method for automated FISH signal counting in HER2 assessment, achieving a Pearson correlation coefficient of 0.907 and a balanced concordance of 0.971 [152]. Piscis is a fully automated DL algorithm for spot detection in single molecule RNA FISH images. The model incorporated a SmoothF1 loss function and achieved a mean F1 score of 0.895 without requiring manual parameter tuning [153]. Frankenstein et al. developed SHIMARIS PAFQ, an automated three-dimensional FISH scoring algorithm for analyzing z stack images obtained using a confocal whole slide imaging scanner. The algorithm enabled automated detection, counting, and scoring of gene signals within cell nuclei and showed higher precision than manual analysis [154]. Detailed information could be found in Table 7.
Deep learning application in fluorescence in situ hybridization.
| Year | Cancer type | Method | Cohort Size | Objective | Performance | Ref. |
|---|---|---|---|---|---|---|
| 2025 | Breast cancer and stomach cancer | Soft-sampling cascade deep learning based on ResNeXt50 | FISH breast cancer cohort: 200 imagesDISH breast cancer cohort: 210 imagesDISH stomach cancer cohort: 45 images | To assess HER2 amplification | FISH breast cancer dataset: Accuracy = 98.74%; Precision = 99.50%; Recall = 95.32%; F1-score = 97.31%.DISH breast cancer dataset: Accuracy = 95.03%; Precision = 97.42%; Recall = 82.62%; F1-score = 88.98%.DISH stomach cancer dataset: Accuracy = 97.67%; Precision = 96.15%; Recall = 77.83%; F1-score = 85.82%. | [150] |
| 2019 | Breast cancer and gastric cancer | RetinaNet based on ResNet50 and feature pyramid network | Training set: 299 FISH images and 301 nuclei imagesValidation set: 57 FISH images | To assess HER2 amplification | Agreement with pathologists: κ (nucleus detector) = 0.648; κ = 0.675 (signal detector).Accuracy (image-wide classification) = 96.5%. | [151] |
| 2019 | Breast cancer | Density-based fully convolutional network | 36 samples | To assess HER2 amplification | MNAE (CEN17) = 0.247; MNAE (ERBB2) = 0.184; MNAE (total) = 0.215; Cut-off concordance = 0.965; Pearson's r = 0.907; Balanced concordance = 0.971. | [152] |
| 2025 | Melanoma and lung adenocarcinoma | Piscis based on feature pyramid network with an EfficientNetV2 backbone | Training set: 418 imagesValidation set: 89 imagesTesting set: 91 images | To detect spots | Mean F1 score = 0.895. | [153] |
| 2021 | Lymphoma and solid tumors | SHIMARIS PAFQ based on template matching and 3D spatial analysis | 10 patients | To automatically segment nuclei, detect and quantify gene signals, and score FISH signal patterns in 3D | Positive/negative diagnoses agreed with manual scoring in all 10 cases; automated analysis time = 3.4 min for the entire tumor area. | [154] |
Collectively, these studies demonstrate that DL can automate key steps in FISH analysis, including nuclear detection, signal localization, signal counting, and assessment of gene amplification status. These approaches may improve the efficiency and consistency of FISH based molecular diagnostics while reducing the burden of manual signal evaluation.
Deep learning application in multi-modal diagnosis
Multimodal DL frameworks can integrate complementary information from different data modalities and may improve diagnostic performance compared with single modality approaches. Xu et al. developed a multimodal spectral information fusion (MSIF) network for distinguishing lung adenocarcinoma cells from normal tissues. The framework combined ResNet, Transformer, 1D CNN, and a cross-modal interaction fusion (CMIF) module for feature extraction and multimodal integration [155]. The model achieved accuracies above 95% across three test sets and showed consistent performance in comparative and ablation analyses [155]. For breast cancer diagnosis, Huang et al. developed a multimodal framework, AW3M, for analyzing four types of ultrasound images. The model used a modified ResNet 18 for feature extraction, incorporated self-supervised consistency signals to improve cross modality representation, and introduced a recovery block to address incomplete modalities [156]. In the internal validation cohort, AW3M achieved an accuracy of 92.63%, sensitivity of 91.88%, specificity of 88.88%, precision of 90.11%, and F1 score of 90.97%. In the external validation cohort, the corresponding values were 79.26%, 62.59%, 87.52%, 72.28%, and 66.52%, respectively [156].
The integration of radiological, pathological, genomic, and clinical information provides opportunities to capture complementary biological and imaging features for more comprehensive cancer diagnosis. In liver cancer, Khan et al. developed a multimodal dilated CNN with residual connections to integrate CT and histopathological data, achieving an overall accuracy of 96.06% and an AUROC of 0.832 for distinguishing HCC and metastatic colorectal cancer [157]. To address incomplete modalities in liver tumor diagnosis, Guo et al. applied GAN-based approaches, including U-GAT-IT and MSA-GAN, to reconstruct missing B mode ultrasound or color Doppler flow imaging (CDFI) images [158]. After incorporating the reconstructed images into Model_D, which integrated flattened CDFI and B mode features with clinical data, the multimodal model maintained diagnostic performance despite the absence of certain imaging modalities [158]. In esophageal squamous cell carcinoma (ESCC), Wu et al. developed MMFusion, a conditional diffusion model that integrated CT, radiomics, and clinical data through graph attention networks. The model achieved an accuracy of 89.14% and a precision of 93.37% for lymph node metastasis diagnosis [159]. Wu et al. also developed a multimodal concept based interpretable model to distinguish uveal melanoma from hemangioma and metastatic carcinoma, achieving an F1 score of 91% and improving the diagnostic accuracy of less experienced clinicians by 42% [160]. Xing et al. proposed a two-stage framework that combined low-rank multimodal fusion (M3LR) with knowledge distillation (DSCD/GKM), achieving an accuracy of 78.43% and an AUROC of 93.28% for glioma grading and an accuracy of 76.56% and an AUROC of 90.31% for skin lesion classification [161]. Yang et al. developed GBCseeker, which integrated circulating cell free DNA signatures, radiomic features, and clinical information to noninvasively distinguish gallbladder cancer from benign gallbladder lesions. The model achieved accuracies of 93.33% and 87.76% in the internal and external cohorts, respectively [162]. Detailed information is provided in Table 8.
Deep learning application in multi-modal diagnosis.
| Year | Cancer type | Method | Cohort Size | Objective | Performance | Ref. |
|---|---|---|---|---|---|---|
| 2025 | Lung cancer | ResNet and Transformer network for image feature extraction, 1D CNN for text feature extraction, and another CMIF module | —— | To diagnose lung cancer | FTIR spectra: Precision = 95.83%; Recall = 95.83%; F1-score = 95.83%; Accuracy = 95.83%; AP = 98.38%; AUROC = 98.26%.UV-vis spectra: Precision = 98.00%; Recall = 97.92%; F1-score = 97.96%; Accuracy = 97.92%; AP = 97.35%; AUROC = 97.40%.Fluorescence spectra: Precision = 100%; Recall = 100%; F1-score = 100%; Accuracy = 100%; AP = 100%; AUROC = 100%. | [155] |
| 2021 | Breast cancer | AW3M based on ResNet-18 and GC blocks | Dataset A: 835 patientsDataset B: 163 patients | To diagnose breast cancer | Dataset A: Accuracy = 92.63%, Sensitivity = 91.88%, Specificity = 88.88%, Precision = 90.11%, F1-score = 90.97%.Dataset B: Accuracy = 79.26%, Sensitivity = 62.59%, Specificity = 87.52%, Precision = 72.28%, F1 score = 66.52%. | [156] |
| 2023 | Liver cancer | Multi-modal deep neural network based on modified AlexNet | RUH cohort: 68 patientsBinary cohort: 180 patients | To diagnose liver cancer | Overall performance: Accuracy = 96.06%; AUROC = 0.832.HCC Multiple: Precision = 0.9523; Sensitivity = 0.9424; Specificity = 0.9856; F1-score = 0.9473.HCC Single: Precision = 0.9647; Sensitivity = 0.9678; Specificity = 0.9783; F1 score = 0.9662.mCRC: Precision = 0.9623; Sensitivity = 0.9654; Specificity = 0.9761; F1 score = 0.9638. | [157] |
| 2025 | Liver cancer | Feature extractor based on EfficientNetV2 and DenseNet, generative adversarial network based on U-GAT-IT and MSA-GAN | 359 patients (115 benign cases and 244 malignant cases) | To diagnose liver cancer | Accuracy = 88.57%; Precision = 87.97%; Recall = 86.32%; F1 score = 0.87; AUROC = 0.95.Modality supplement: Accuracy (CDFI) = 87.10%; AUROC (CDFI) = 0.92; Accuracy (B-mode ultrasound) = 86.43%; AUROC (B-mode ultrasound) = 0.95. | [158] |
| 2024 | Esophageal squamous cell carcinoma | MMFusion based on multi-tissue masked relational, heterogeneous graph aggregation and conditional feature-guided diffusion | 1354 patients | To predict lymph node metastasis | Accuracy = 89.14%; Precision = 93.37%; Recall = 65.97%; F1-score = 71.10%. | [159] |
| 2025 | Choroid neoplasia | Multi-modal concept bottleneck model utilizing pre-trained encoders and concept activation vectors | CTI dataset: 750 patientsInternal independent set: 83 patientsExternal test set: 43 patients | To distinguish between melanoma, hemangioma, and metastatic carcinoma | F1-score (MM test set) = 91.0%; F1-score (internal independent set) = 90.3%; F1-score (external test set) = 87.9%. | [160] |
| 2023 | Glioma and skin lesions | Gradient-modulated contrastive distillation framework with low-rank multi-modal learning | GBMLGG dataset: 736 patientsSkin lesion dataset: 1011 patients | To grade glioma and classify skin lesions | Glioma: Accuracy = 78.43%; AP = 87.40%; AUROC = 93.28%; F1-GradeIV = 94.6%Skin lesions: Accuracy = 76.56%; Sensitivity = 59.54%; Specificity = 92.05%; AUROC = 90.31%. | [161] |
| 2025 | Gallbladder cancer | nnU-Net segmentation and machine learning classification | Training set: 142 patientsInternal test set: 61 patientsExternal validation set: 98 patients | To diagnose gallbladder cancer | Internal test set: Accuracy = 93.33%; AUROC = 0.97; Sensitivity = 92.68%; Specificity = 94.74%; PPV = 97.44%; NPV = 85.71%; F1-score = 0.95.External validation set: Accuracy = 87.76%; AUROC = 0.93; Sensitivity = 93.55%; Specificity = 77.78%; PPV = 87.88%; NPV = 87.50%; F1-score = 0.91. | [162] |
Collectively, multimodal DL enables the integration of complementary imaging, molecular, pathological, and clinical information and may provide a more comprehensive representation of tumor biology than single modality models. The availability of external validation in several studies also provides preliminary evidence that multimodal approaches may retain diagnostic performance beyond the development cohorts.
Clinical translation of deep learning in precision cancer therapy
DL has increasingly been applied to precision cancer therapy by integrating multimodal clinical, molecular, and imaging data to support treatment selection and therapeutic decision-making. In this context, DL approaches have been explored across several stages of cancer treatment, including the identification of potential drug combinations, optimization of radiotherapy planning, prediction of treatment response, and discovery of novel therapeutic targets (Figure 3). These applications extend the role of DL beyond cancer diagnosis to treatment selection, response assessment, and optimization of therapeutic decision-making.
Deep learning applications in precision cancer therapy. The applications of DL in selecting optimal therapeutic agents and identifying new therapeutic targets.
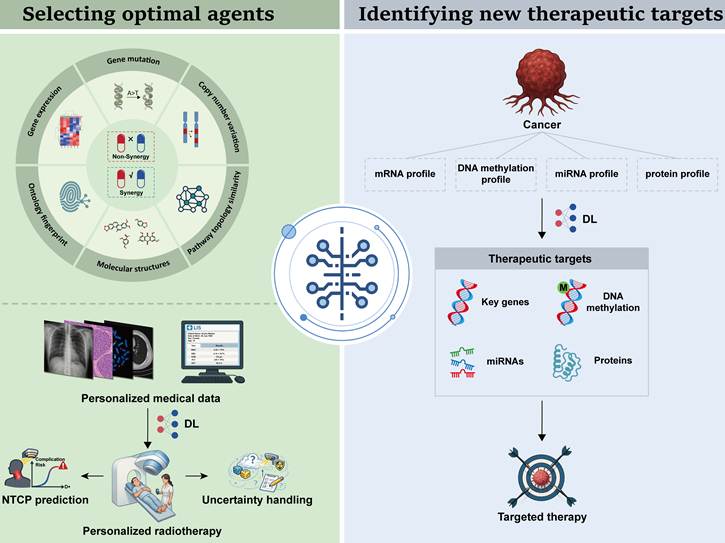
Deep learning applications in selecting optimal drug combinations
DL has been increasingly applied to predict synergistic drug combinations by integrating diverse molecular and pharmacological data (Table 9). Commonly used data modalities include genomic profiles, transcriptomic data, drug chemical structures, and pharmacological response scores. Chen et al. developed a deep belief network-based approach that integrated gene expression data, pathway information, and ontology fingerprints to predict drug synergy. The model achieved a precision of 71.5%, recall of 60.2%, and F1 score of 65.4%, showing better performance than the compared models [163]. Preuer et al. developed DeepSynergy, which integrated chemical information from drugs with genomic information from cancer cells to predict anticancer drug combination synergy. The model achieved an AUROC of 0.90, an AUPRC of 0.59, and an accuracy of 0.92, outperforming the evaluated machine learning based methods [164]. Wang et al. developed DeepDDS, which used graph convolutional networks (GCNs) and graph attention networks (GATs) to integrate drug molecular graphs with gene expression profiles across 12,415 drug cell line pairs [165]. DeepDDS showed high performance across multiple evaluation metrics in five-fold cross validation and retained predictive performance in leave one out and independent AstraZeneca tests [165].
Deep learning application in precision cancer therapy.
| Year | Cancer type | Method | Cohort Size | Objective | Performance | Ref. |
|---|---|---|---|---|---|---|
| 2018 | Pan-cancer | Stacked restricted Boltzmann machine based on deep belief network | 4999 drug pairs tested on 83 cell lines | To predict drug synergy of drug combinations | Precision = 71.5%; Recall = 60.2%; F1-score = 65.4%. | [163] |
| 2018 | Pan-cancer | DeepSynergy based on feed forward neural network | 583 drug pairs tested on 39 cell lines | To predict drug synergy of drug combinations | AUROC = 0.90; AUPRC = 0.59; Accuracy = 0.92; Balanced accuracy = 0.76; Precision = 0.56; Sensitivity = 0.57; Specificity = 0.95; Kappa = 0.51. | [164] |
| 2022 | Pan-cancer | DeepDDS based on GNN and attention mechanism | Benchmark set: 12415 drug pair-cell line combinationsIndependent test set: 668 drug pair-cell line combinations | To predict drug synergy of drug combinations | DeepDDS-GAT on 5-fold cross-validation: AUROC = 0.93; AUPRC = 0.93; Accuracy = 0.85; Balanced accuracy = 0.85; Precision = 0.85; Sensitivity = 0.85; Kappa = 0.71.DeepDDS-GCN on 5-fold cross-validation: AUROC = 0.93; AUPRC = 0.92; Accuracy = 0.85; Balanced accuracy = 0.85; Precision = 0.85; Sensitivity = 0.84; Kappa = 0.70.DeepDDS-GAT in independent test: AUROC = 0.66; AUPRC = 0.82; Accuracy = 0.64; Balanced accuracy = 0.62; Precision = 0.80; Sensitivity = 0.67; Kappa = 0.21.DeepDDS-GCN in independent test: AUROC = 0.67; AUPRC = 0.83; Accuracy = 0.60; Balanced accuracy = 0.63; Precision = 0.83; Sensitivity = 0.56; Kappa = 0.21. | [165] |
| 2021 | Pan-cancer | AuDNNsynergy based on deep neural network | 583 drug pairs tested on 39 cell lines | To predict drug synergy of drug combinations | AUROC = 0.91; AUPRC = 0.63; Accuracy = 0.93; Precision = 0.72; Kappa = 0.51. | [166] |
| 2020 | Pan-cancer | DTF based on fully connected deep neural network | 23062 drug pairs tested on 39 cell lines | To predict drug synergy of drug combinations | AUROC = 0.89; AUPRC = 0.58; Accuracy = 0.93; Balanced accuracy = 0.69; Precision = 0.69; Sensitivity = 0.40; Kappa = 0.47. | [167] |
| 2022 | Pan-cancer | HypergraphSynergy based on hypergraph neural network | NCI-ALMANAC dataset: 74139 samplesO'Neil dataset: 18950 samples | To predict drug synergy of drug combinations | AUROC (Random CV) = 0.8530; AUROC (Random CV for cell lines) = 0.7886; AUROC (Random CV for drug combinations) = 0.7798; AUROC (Independent test) = 0.8642. | [168] |
| 2019 | Lung cancer | Deep profiler based on 3D-CNN encoder | Internal study set: 849 patientsExternal validation set: 95 patients | To predict local failure risk following radiotherapy, and calculate personalized radiation dose | C-index (Deep Profiler) = 0.711; C-index (Deep Profiler + Clinical variables) = 0.72; C-index (Deep Profiler in external validation set) = 0.77.Deep Profiler personalized radiotherapy doses (21.15-277.1 Gy) to reduce local failure risk below 5%. | [169] |
| 2022 | Cervical cancer | Dueling double-deep Q network | 20 patients | To optimize dwell times in high-dose-rate cervical brachytherapy treatment planning | Maintain target coverage: D90 (Gy): from 7.96 Gy to 7.72 Gy; D100 (Gy): from 5.82 Gy to 5.62 Gy; V100% = from 93.91% to 95.28%.Improve dose distribution: V150% = from 56.46% to 54.86%; V200% = from 33.05% to 30.16%; HI: from 0.398 to 0.421; CI: from 0.665 to 0.687.Reduce OAR doses: D2cc (Bladder): from 5.16 Gy to 4.92 Gy; D2cc (Rectum): from 3.46 Gy to 3.23 Gy; D2cc (Sigmoid): from 3.93 Gy to 3.79 Gy. | [170] |
| 2022 | Cervical cancer | 2-stage CNN based on ResNet | 90 patients | To generate intensity-modulated radiation therapy plans | Average MAE (validation set) = 8.1%; Average MAE (test set) = 10.5%.Mean gamma passing rate (3%/3 mm criteria) = 99.5%; Mean gamma passing rate (2%/2 mm criteria) = 97.3%. | [171] |
| 2025 | Pelvic cancer | Multiple instance learning with feature-level fusion and attention | 313 patients (Anal cancer: 94 patients; Rectal cancer: 74 patients; Endometrial cancer: 48 patients; Cervical cancer: 97 patients) | To predict late bowel toxicity after pelvic radiotherapy | AUROC (Bowel urgency) = 0.88; AUROC (Fecal incontinence) = 0.78; AUROC (Diarrhea) = 0.68. | [172] |
| 2025 | Head and neck cancer | 3D Residual Network | Training (UMCG): 941 patientsIndependent test (UMCG): 171 patientsExternal test (MDACC): 338 patients | To predict radiation-associated dysphagia | Independent test: AUROC (ResNet3D) = 0.80; AUROC (ResNet3D+1D(LR)) = 0.83; AUROC (ResNet3D+1D) = 0.84; AUROC (Reference) = 0.76.External test: AUROC (ResNet3D) = 0.73; AUROC (ResNet3D+1D(LR)) = 0.74; AUROC (ResNet3D+1D) = 0.73; AUROC (Reference) = 0.63. | [173] |
| 2023 | Hepatocellular cancer | Conditional Wasserstein generative adversarial network | 146 patients, including 24 patients receiving dynamic gadoxetic acid-enhanced MRI (DGAE-MRI) | To predict liver functional changes and support NTCP modeling | mean SSIM = 0.53, RMSE = 13.32, gamma pass rate = 0.867. | [174] |
| 2024 | NSCLC | 3D U-Net with Monte Carlo Dropout | 422 patients | To generate uncertainty maps and propose 2 uncertainty indicators | ECE = 8.54; UCE = 8.40MU: AUROC (Intermediate as low) = 0.876, AUROC (Intermediate as high) = 0.849RUV: AUROC (Intermediate as low) = 0.804, AUROC (Intermediate as high) = 0.719 | [177] |
| 2022 | Prostate cancer | 3D U-Net | Training set: 37 patientsTest set: 10 patientsValidation set: 5 patients | To predict robust proton therapy doses | CTV, D98%: Mean (Non-robust) = 6488 cGy, Mean (Robust) = 7386 cGy.CTV, D2%: Mean (Non-robust) = 8117 cGy, Mean (Robust) = 7894 cGy.Bladder, D10%: Mean (Non-robust) = 3885 cGy, Mean (Robust) = 5481 cGy.Rectum, D10%: Mean (Non-robust) = 3338 cGy, Mean (Robust) = 5362 cGy.Ring 0-1 cm, Dmean: Mean (Non-robust) = 5742 cGy, Mean (Robust) = 6867 cGy.Ring 1-2 cm, Dmean: Mean (Non-robust) = 2297 cGy, Mean (Robust) = 3755 cGy. | [178] |
| 2024 | Head and neck cancer | 3D U-Net | 5 patients (1 planning CT and 4-7 repeated CTs for every patient) | To predict DIR uncertainty for robust ART optimization. | CTV, V95%: Δnom = -0.45, ΔNWC = -0.8.Parotids D30%: Δnom = -6.12, ΔNWC = -7.84.Thyroid D30%: Δnom = -0.62, ΔNWC = -0.91.Brainstem Dmax: Δnom = -3.58, ΔNWC = -4.7.Optic nerves Dmax: Δnom = -1.93, ΔNWC = -2.35.Integral dose: Δnom = 0.79 GyL | [179] |
| 2021 | Low-grade glioma, kidney cancer, and breast invasive carcinoma | MOGONET based on graph convolutional network and view correlation discovery network | ROSMAP dataset: 351 samplesLGG dataset: 510 samplesKIPAN dataset: 658 samplesBRCA dataset: 875 samples | To classify cancer subtypes and identify related biomarkers | Classification results on ROSMAP dataset: Accuracy = 0.815; F1-score = 0.821; AUROC = 0.874.Classification results on LGG dataset: Accuracy = 0.816; F1-score = 0.814; AUROC = 0.840.Classification results on BRCA dataset: Accuracy = 0.829; F1_weighted = 0.825; F1_macro = 0.774.Classification results on KIPAN dataset: Accuracy = 0.999; F1_weighted = 0.999; F1_macro = 0.999.MOGONET identified multiple important biomarkers related to cancers (detailed in the original article). | [184] |
| 2020 | Breast cancer | Multilayer perceptron method | 140 positive proteins and 233 negative proteins | To discover cancer-related proteins | AUROC = 0.980; Accuracy = 0.936.This model identified multiple breast cancer-related proteins, including RPS27, SUPT4H1, S100A9, DDA1, TXN, RPS27L and others. | [185] |
| 2022 | Breast cancer | A custom sequential deep neural network based on TensorFlow | 1188 samples | To diagnose breast cancer and predict cancer-related biomarkers | Prediction using 450K methylation markers: Accuracy = 98.75%.This workflow identified 7 biomarkers including RTN4IP1, MYO18B, ANP32A, BRF1, SETBP1, NTRK1 and IGF2R. | [186] |
| 2021 | Pan-cancer | DeepCues based on CNN | 4174 samples | To classify cancer types and recognize related genes | CNN trained by 985 transcripts: Accuracy (germline raw sequence) = 73.9%; Accuracy (cancer raw sequence) = 77.6%.CNN trained by 1970 transcripts: Accuracy (germline raw sequence) = 82.7%; Accuracy (cancer raw sequence) = 80.0%.DeepCues identified multiple important breast cancer-related genes, 40% of which were consistent with previous reports and the other 60% were unreported. | [187] |
Other DL approaches have also been developed for pan cancer drug synergy prediction, including AuDNNsynergy, which integrates gene expression, gene mutation, and copy number alteration data from the Cancer Cell Line Encyclopedia (CCLE), Catalogue of Somatic Mutations in Cancer (COSMIC), and The Cancer Genome Atlas (TCGA); DTF, which incorporates Loewe synergy scores from previous studies; and HypergraphSynergy, which integrates molecular structures and genomic profiles from PubChem and COSMIC [166-168]. Collectively, these studies demonstrate that DL can integrate heterogeneous drug and molecular features to improve the prediction of potential synergistic drug combinations.
Despite these advances, most current DL based drug synergy models are trained and evaluated using cell lines or previously generated drug response datasets, which may not fully reflect tumor heterogeneity or the pharmacological environment in patients. In addition, high predictive performance in computational benchmarks does not necessarily translate into clinically effective drug combinations. Prospective validation in patient derived models and clinical studies will therefore be important to determine whether DL predicted synergies can reliably inform treatment selection.
Deep learning applications in guiding radiotherapy planning
Radiotherapy is a cornerstone of modern oncology, using high energy ionizing radiation to control or eradicate malignant cells. The integration of DL into radiotherapy workflows has enabled automated and data driven approaches to target delineation, treatment planning, dose optimization, and normal tissue complication probability (NTCP) prediction. For example, Lou et al. developed Deep Profiler, a multitask deep neural network with a 3D CNN encoder, to analyze pretreatment lung CT images and identify radiation sensitive tumor subpopulations [169]. Patients with higher Deep Profiler scores had a higher rate of radiation treatment failure, and the score independently predicted local failure (HR = 1.65, 95% CI = 1.02-2.66, p = 0.04) [169]. Pu et al. developed an intelligent treatment planner network (ITPN) based on a dueling double deep Q network (DDQN) to optimize dwell times in high dose rate cervical brachytherapy [170]. Compared with inverse planning simulated annealing (IPSA), the model reduced doses to organs at risk, including bladder D2cc from 5.16 to 4.92 Gy, rectum D2cc from 3.46 to 3.23 Gy, and sigmoid D2cc from 3.93 to 3.79 Gy, while also improving V150, V200, homogeneity, and conformity indices [170]. Yuan et al. developed a two stage CNN based approach that directly generated deliverable intensity modulated radiation therapy (IMRT) plans from patient CT anatomy [171]. The model predicted beam specific fluence maps from target and organ contours, thereby bypassing the conventional inverse optimization process. Patient specific IMRT quality assurance showed gamma passing rates of 99.5% under the 3%/3 mm criterion and 97.3% under the 2%/2 mm criterion [171].
DL has also been investigated for predicting radiation induced toxicity and NTCP to support risk adapted radiotherapy. Unlike conventional models based mainly on dose volume parameters, DL can integrate dose distributions with imaging and clinical features. Elhaminia et al. developed a multiple instance learning model with feature level fusion and attention to predict bowel urgency, fecal incontinence, and diarrhea after pelvic radiotherapy using CT images, dose distributions, and clinical data. The model achieved AUROCs of 0.88, 0.78, and 0.68, respectively [172]. Vette et al. developed a DL based NTCP model integrating 3D dose distributions, CT images, and organ at risk segmentations to predict late dysphagia after head and neck radiotherapy. The model outperformed a conventional NTCP model in both the independent test set (AUROC 0.80-0.84 vs. 0.76) and the external validation cohort (0.73-0.74 vs. 0.63) [173]. Wei et al. developed a conditional Wasserstein generative adversarial network (cWGAN) to predict post stereotactic body radiation therapy (SBRT) liver function changes and toxicity in HCC using pretreatment functional MRI maps and radiation dose distributions [174]. The model generated post treatment functional maps with a mean SSIM of 0.53, RMSE of 13.32, and gamma pass rate of 0.867 [174]. These studies suggest that DL based toxicity modeling may help incorporate patient specific risk information into radiotherapy planning.
Another important challenge in radiotherapy is uncertainty. DL based treatment planning and segmentation can be affected by both aleatoric uncertainty, arising from inherent variability or noise in the data, and epistemic uncertainty, arising from limitations in the model or insufficient representation of the training data [175, 176]. Unrecognized uncertainty may affect target delineation, treatment planning, and subsequent dose delivery. Maruccio et al. developed a probabilistic 3D DL system using Monte Carlo dropout to generate uncertainty maps for lung cancer gross tumor volume (GTV) segmentation on CT images [177]. The model identified regions requiring further review and introduced mean uncertainty (MU) and relative uncertainty volume (RUV) as quantitative metrics. Both metrics showed moderate agreement with expert radiation oncologist assessments (MU: r = 0.68, AUROC = 0.849-0.876; RUV: r = 0.49, AUROC = 0.719-0.804) [177]. Such uncertainty maps may help prioritize manual review of regions with ambiguous tumor boundaries or imaging artifacts. Beyond uncertainty estimation, robust planning strategies have also been developed to reduce the influence of uncertainty. Eriksson et al. combined scenario specific dose prediction with DVH constrained robust optimization to improve resistance to aleatoric uncertainty in prostate proton therapy planning, increasing CTV D98% coverage from 6488 to 7386 cGy while maintaining normal tissue constraints [178]. Smolders et al. incorporated a DL based deformable image registration uncertainty model to generate multiple contour samples and voxel wise marginal probability maps, improving target coverage and normal tissue sparing compared with conventional margin-based approaches [179]. Collectively, DL has been applied across multiple stages of radiotherapy, from tumor characterization and treatment plan generation to toxicity prediction and uncertainty management. These approaches may improve treatment personalization and reduce the computational and manual burden associated with conventional planning workflows.
However, the clinical evidence remains less mature than the technical development. Most studies are retrospective, and improvements in dosimetric or predictive metrics do not necessarily translate into better patient outcomes. Importantly, prospective studies have begun to demonstrate the feasibility of DL assisted radiotherapy workflows. Mikalsen et al. reported that a DL based segmentation model generated clinically acceptable organ at risk contours for thoracic and breast radiotherapy, with approximately 93% of contours requiring no correction, although most clinical target volumes still required manual adjustment [180]. Similar prospective studies in prostate radiotherapy have reported reductions in contouring time and workload [181, 182]. Thus, current clinical evidence primarily supports workflow efficiency and contouring assistance, whereas effects on treatment response, recurrence, survival, and other long term clinical outcomes remain insufficiently established.
Deep learning applications in identifying new therapeutic targets
The identification of actionable therapeutic targets remains a major challenge in drug development, as only a limited proportion of molecular targets have been successfully translated into effective therapies. According to the 2024 update of the Therapeutic Target Database (TTD), 426 therapeutic targets were classified as successful targets, while 1,014 were associated with clinical trials and 212 were categorized as preclinical or patented targets [183]. As the volume and complexity of cancer genomic and molecular data continue to increase, DL provides an opportunity to systematically identify candidate therapeutic targets by integrating heterogeneous molecular features (Table 9). Most DL approaches in this field leverage multi-omics profiles, including genomics, epigenomics, transcriptomics, and proteomics, to identify cancer associated genes, proteins, and molecular signatures.
Wang et al. developed MOGONET, a multimodal framework that used graph convolutional networks (GCNs) to capture omics specific sample relationships and a view correlation discovery network (VCDN) to model cross omics correlations in the label space [184]. MOGONET enabled joint analysis of multiple omics layers and identified molecular signatures associated with breast cancer, including genes such as SOX11, FABP7, and SLC6A15, DNA methylation markers such as GPR37L1, MIR563, and OR1J4, and miRNAs including hsa-miR-205, hsa-miR-187, and hsa-miR-452 [184]. López Cortés et al. developed a multilayer perceptron model using protein sequence descriptors to predict breast cancer associated proteins. The model achieved an AUROC of 0.980 ± 0.0037 and an accuracy of 0.936 ± 0.0056 in three-fold cross validation and identified candidate proteins associated with immunotherapy, metastasis, and RNA binding [185]. Gomes et al. combined a sequential deep neural network with ANOVA and random forest-based feature selection to identify breast cancer related biomarkers from TCGA BRCA 450K DNA methylation data. The model achieved an accuracy of 98.75% and identified several methylation sites associated with poor prognosis [186]. Zeng et al. developed DeepCues, a CNN based framework that directly extracted features from raw tumor DNA sequencing data to classify cancer types and identify cancer relevant genes [187]. The model classified seven major cancer types with an overall accuracy of 77.6% and identified both known cancer driver genes and previously uncharacterized genes potentially relevant to breast cancer [187].
Collectively, these studies demonstrate that DL can integrate high dimensional multi-omics and sequencing data to prioritize cancer associated molecular features and candidate therapeutic targets. By linking different molecular layers, DL may provide a more systematic strategy for target discovery than approaches based on individual omics datasets.
However, computational identification of candidate targets represents an early stage of therapeutic development and does not establish target validity or therapeutic efficacy. Many reported candidates remain supported primarily by computational associations or retrospective molecular data, and their biological functions and druggability require experimental validation. Future studies should therefore integrate DL based target prioritization with functional experiments, patient derived models, and ultimately prospective clinical studies to determine whether computationally identified targets can be translated into effective therapeutic interventions.
Clinical translation of deep learning in cancer prognosis and disease management
DL models have been increasingly applied to cancer prognosis and disease management by integrating clinical, imaging, and molecular information. These approaches have been investigated across several clinically relevant tasks, including monitoring disease progression, predicting treatment response and survival, and identifying genetic alterations and oncogenic molecular features (Figure 4). Together, these applications aim to provide individualized risk assessment and support clinical decision making throughout the cancer care pathway.
Deep learning applications in cancer risk prediction. The applications of DL in cancer early identification, treatment response prediction, survival prediction, gene mutation or oncogene expression prediction.
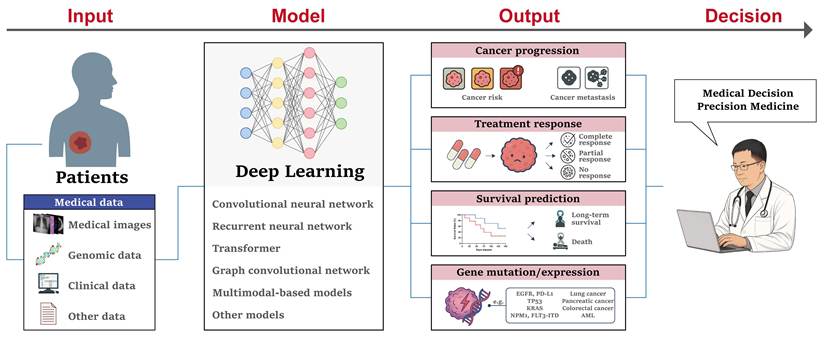
Deep learning applications in monitoring cancer progression
Monitoring cancer progression is critical for timely modifying treatment protocols. Currently, DL-assisted methods have been widely used in this field (Table 10). For example, vessels encapsulating tumor cluster (VETC) is a distinct vascular pattern, which significantly correlates with early metastasis in HCC. DL approaches leveraging ultrasound, radiological, and pathological images have been developed for VETC identification in recent studies [188, 189]. Xu et al. developed a ResNet18 model to predict VETC status in HCC using contrast enhanced ultrasound (CEUS), achieving AUROCs of 0.92 and 0.90 in the training and test cohorts, respectively [188]. The predicted VETC signature was independently associated with postoperative early recurrence (HR = 1.99, p = 0.002), and the integration of the DL signature with clinical features increased the C index from 0.70 to 0.73 [188]. Yu et al. compared four DL architectures, including ResNet50, DenseNet121, Vision Transformer, and Swin Transformer, for VETC prediction using contrast enhanced MRI and pathological images [189]. The Swin Transformer achieved AUROCs of 0.77-0.79 based on radiomics and 0.79 based on pathomics in the external test set. They further developed a radiopathomics nomogram for predicting early recurrence and progression free survival (PFS) [189]. In invasive breast cancer, Liu et al. evaluated DL and radiomics approaches for preoperative prediction of lymphovascular invasion (LVI) [190]. A DL model based on gross tumor volume plus peritumoral volume (GPTV) outperformed the corresponding gross tumor volume (GTV) based model (AUROC 0.771 vs. 0.720), while GPTV based radiomics also showed better performance than GTV based radiomics (AUROC 0.685 vs. 0.636). A hybrid model integrating the optimal GPTV based DL model, radiomics, and imaging features achieved an AUROC of 0.872 for preoperative LVI assessment [190].
Deep learning applications in monitoring cancer progression.
| Year | Cancer type | Method | Cohort Size | Objective | Performance | Ref. |
|---|---|---|---|---|---|---|
| 2025 | Hepatocellular carcinoma | ResNet-18 | 242 patients | To predict vessels encapsulating tumor clusters and postoperative early recurrence risks | Predict VETCs: (1) Training set: AUROC = 0.92; Accuracy = 0.85; Sensitivity = 0.75; Specificity = 0.92; PPV = 0.87; NPV = 0.84; (2) Test set: AUROC = 0.90; Accuracy = 0.81; Sensitivity = 0.81; Specificity = 0.81; PPV = 0.68; NPV = 0.89.Predict early recurrence: (1) DL signature: C-index = 0.70; HR (Multivariate Cox regression) = 1.99; (2) DL signature + Clinical data: C-index = 0.73. | [188] |
| 2025 | Hepatocellular carcinoma | CNN and Transformer | 578 patients | To predict vessels encapsulating tumor clusters and prognosis | Swin Transformer exhibited the best performance:Radiomics model (Swin Transformer): (1) Internal test: AUROC (AP) = 0.82; AUROC (PP) = 0.81; AUROC(HBP) = 0.77; AUROC (CP) = 0.80; (2) External test: AUROC (AP) = 0.78; AUROC (PP) = 0.77; AUROC (HBP) = 0.79; AUROC (CP) = 0.79.Pathomics model (Swin Transformer): (1) Internal test: AUROC = 0.760; Accuracy = 68.4%; Sensitivity = 64.1%; Specificity = 72.8%; (2) External test: AUROC = 0.790; Accuracy = 71.9%; Sensitivity = 70.9%; Specificity = 72.9%.Radiopathomics nomogram model for survival: (1) Early recurrence: C-index (internal) = 0.60; C-index (external) = 0.67; (2) PFS: C-index (internal) = 0.63; C-index (external) = 0.65. | [189] |
| 2024 | Breast cancer | ResMM-Net | Training set: 183 patientsValidation set: 79 patients | To predict lymphovascular invasion | AUROC (GTV_Radiomics) = 0.636; AUROC (GPTV_Radiomics) = 0.685; AUROC (GTV_DL) = 0.720; AUROC (GPTV_DL) = 0.771; AUROC (Hybrid model) = 0.872. | [190] |
| 2024 | Breast cancer and ovarian cancer | DeepHRD based on ResNet18 | Training set: 649 FFPE samples, 594 FF samplesHeld-out test set: 406 FFPE samples, 414 FF samplesCPTAC set: 116 FF samplesMETABRIC set: 156 FF samplesMetastatic breast cancer set: 77 FFPE samplesHeld-out ovarian cancer set: 117 samples | To predict homologous recombination deficiency | FFPE slides: AUROC (Held-out TCGA breast cancer) = 0.81; AUROC (MBC Platinum CR cohort) = 0.76; AUROC (MBC Taxane CR cohort) = 0.39.FF slides: AUROC (Held-out TCGA breast cancer) = 0.81; AUROC (CPTAC cohort) = 0.75; AUROC (METABRIC cohort) = 0.76; AUROC (Held-out TCGA ovarian cancer) = 0.54. | [191] |
| 2021 | Breast cancer | DLS based on Inception-V3 | Hospital cohort: 4156 slidesLaboratory cohort: 291 slidesTCGA cohort: 961 slides | To predict ER, PR and HER2 status | Patch-level evaluation: AUROC (ER) = 0.939; AUROC (PR) = 0.938, AUROC (HER2) = 0.808.Slide-level evaluation: AUROC (ER) = 0.86; AUROC (PR) = 0.75, AUROC (HER2) = 0.60.Slide-level subanalysis (Hospital cohort): AUROC (ER) = 0.87; AUROC (PR) = 0.76; AUROC (HER2) = 0.59.Slide-level subanalysis (TCGA): AUROC (ER) = 0.83; AUROC (PR) = 0.72; AUROC (HER2) = 0.58. | [192] |
| 2021 | Gastric cancer | ResNet18 | 400 slides from 375 patients | To predict EBV infection | AUROC (tEBV scores) = 0.85; AUROC (nEBV scores) = 0.81. | [193] |
Beyond anatomical imaging features, DL has also been used to infer molecular characteristics that are relevant to tumor progression, treatment response, and risk stratification from routine histopathological images. Bergstrom et al. developed DeepHRD, a ResNet18 based model for predicting homologous recombination deficiency (HRD) directly from digitized H&E slides. In breast cancer, the model achieved an AUROC of 0.81 in both flash frozen and formalin fixed paraffin embedded samples, whereas performance was lower in ovarian cancer (AUROC = 0.54) [191]. Importantly, HRD predicted status was also associated with complete response and survival outcomes following platinum-based therapy [191]. Gamble et al. developed an Inception based model to predict estrogen receptor (ER), progesterone receptor (PR), and HER2 status from H&E images of breast cancer. At the patch level, the model achieved AUROCs of 0.939, 0.938, and 0.808, respectively, whereas slide level AUROCs were 0.86, 0.75, and 0.60 [192]. In gastric cancer, Epstein Barr virus (EBV) infection is associated with distinct molecular and immune characteristics and may have prognostic implications [193]. Zhang et al. developed a ResNet18 based model to predict EBV infection from routine H&E slides by learning spatial immune architecture features. The model achieved AUROCs above 0.80 and may provide a rapid complementary approach to conventional molecular testing [193].
Collectively, these studies demonstrate that DL can extract progression related imaging and pathological features and infer clinically relevant molecular phenotypes from routinely acquired data. Such approaches may facilitate risk stratification and treatment planning without requiring additional invasive sampling.
However, most current approaches infer progression related biomarkers or recurrence risk rather than directly monitoring longitudinal changes in individual patients. In addition, performance can vary substantially across cancer types and external cohorts, as illustrated by the difference in DeepHRD performance between breast and ovarian cancer. Future studies should therefore incorporate longitudinal imaging and molecular data and evaluate whether DL based monitoring can improve treatment adaptation and patient outcomes in prospective clinical settings.
Deep learning applications in predicting treatment response
Given the substantial heterogeneity of tumors and therapeutic responses, accurate prediction of treatment response is an important component of individualized cancer care. DL has been increasingly applied to predict responses to neoadjuvant chemotherapy (NAC), platinum-based therapy, and immunotherapy by integrating imaging, pathological, molecular, and clinical data (Table 11).
Deep learning application in predicting treatment response.
| Year | Cancer type | Method | Cohort Size | Objective | Performance | Ref. |
|---|---|---|---|---|---|---|
| 2019 | Breast cancer | CNN based on VGG-16 | 141 patients | To predict responses following neoadjuvant chemotherapy (NAC) | Overall accuracy = 88%.Complete response: Specificity = 95.1%; Sensitivity = 73.9%; Accuracy = 87.7%.Partial response: Specificity = 91.6%; Sensitivity = 82.4%; Accuracy = 87.7%.No response or progression: Specificity = 93.4%; Sensitivity = 76.8%; Accuracy = 87.8%. | [194] |
| 2020 | Breast cancer | Multipath deep convolutional neural network | 302 patients | To predict pathological complete response following neoadjuvant chemotherapy | AUROC (Pre-NAC) = 0.553; AUROC (Post-NAC) = 0.968; AUROC (Combined) = 0.970. | [195] |
| 2024 | Breast cancer | FAIS-DL based on U-Net and ResNet50 | Training and validation set: 506 patientsInternal test set: 127 patientsExternal test set: 414 patientsProspective test set: 98 patients | To predict axillary pathological complete response following NAC | AUROC (Internal test set) = 0.95; AUROC (External test set) = 0.93; AUROC (Prospective test set) = 0.94. | [196] |
| 2024 | High-grade serous ovarian cancer | PathoRiCH based on UNet++ and ResNet | SEV cohort: 394 patientsTCGA cohort: 284 patientsSMC cohort: 136 patients | To predict responses to platinum-based treatment and prognosis | Treatment response prediction results: AUROC (SEV cohort) = 0.596; AUROC (TCGA cohort) = 0.602; AUROC (SMC cohort) = 0.593.Prognosis prediction results: p (PFI, SEV cohort) < 0.001; p (PFI, TCGA cohort) = 0.032; p (PFI, SMC cohort) = 0.030; p(OS, SEV cohort) < 0.001; p (OS, TCGA cohort) < 0.001; p (OS, SMC cohort) = 0.54.Cox regression results: HR (Univariate analysis in TCGA cohort) = 2.447; HR (Multivariate analysis in TCGA cohort) = 2.050; HR (Univariate analysis in SMC cohort) = 1.885; HR (Multivariate analysis in SMC cohort) = 1.823. | [197] |
| 2023 | Gastric cancer | BgDL based on ResNet18 | 2799 patients from 5 centers | To classify tumor microenvironment and predict anti-PD-1 immunotherapy responses | TME classification: Accuracy (training cohort) = 0.810; Accuracy (validation cohort 1) = 0.832; Accuracy (validation cohort 2) = 0.840.Anti-PD-1 immunotherapy response prediction: AUROC (CPS) = 0.646; AUROC (TME) = 0.753; AUROC (TME+CPS) = 0.806. | [199] |
| 2023 | Colorectal cancer | MSDLM based on ResNet18 | Prognostic cohort (Training/Cross validation): 652 patientsPrognostic cohort (External test): 339 patientsNeoadjuvant cohort (Training/Cross validation): 117 patients | To predict responses following NAC and relapse risks | MSDLM predicts RFS status in cross validation: Accuracy = 79.6%; AUPRC = 0.902; AUROC = 0.896; F1-score = 0.819.MSDLM predicts RFS status in external test: Kaplan-Meier p (AISlow vs. AISim vs. AIShigh) ≤ 0.0001; HR (AISlow vs. AIShigh) = 6.24; HR (AIS in univariate Cox regression) = 0.36; HR (AIS in multivariate Cox regression) = 0.50.MSDLM predicts treatment responses: Accuracy = 73.5%; True predictive value (Non-response) = 78.1%; True predictive value (Response) = 67.9%. | [200] |
| 2020 | Lung adenocarcinoma | 3D convolutional neural network | Training set: 93 patientsExternal validation set (SNUH): 43 patientsExternal validation set (TCGA): 16 patientsICB cohort: 29 patients | To evaluate cytolytic activity scores for predicting immunotherapy responses | The patients with higher CytAct values presented greater tumor shrinkage (Spearman rho = -0.54, p < 0.001) and lower risk of progression (PFS: Hazard ratio 0.25, p = 0.001; OS: Hazard ratio 0.18, p = 0.004). | [201] |
| 2023 | Gastric cancer | HR-Rad-Net based on HR-Net architecture incorporating squeeze-and-excitation module | Training cohort: 398 patientsInternal validation cohort 1: 196 patientsInternal validation cohort 2: 602 patientsExternal validation cohort 1: 101 patientsExternal validation cohort 2: 1068 patientsImmunotherapy cohort: 321 patients | To predict tumor microenvironment status and predict chemotherapy benefits and immunotherapy responses | Predict TME status: AUROC (training set) = 0.937; AUROC (internal validation set 1) = 0.912; AUROC (external validation set 1) = 0.909.Predict adjuvant chemotherapy benefits: Adjuvant chemotherapy was associated with improved prognosis in stage II and III patients of high-DLRS group; Adjuvant chemotherapy was not associated with improved prognosis in stage II and III patients of low-DLRS group.Predict immunotherapy responses: AUROC (DLRS) = 0.722; AUROC (DLRS+CPS) = 0.783. | [202] |
| 2024 | Pan-cancer | ENLIGHT-DeepPT based on ResNet50 | TCGA cohort: 6269 FFPE slidesTransNEO-breast cohort: 160 FF slidesNCI-brain cohort: 226 FFPE slides | To predict treatment responses | AUROC (PARPi) = 0.55; Accuracy (PARPi) = 0.69; AUROC (ALKi) = 0.67; Accuracy (ALKi) = 0.64; AUROC (Bintrafusp alfa) = 0.69; Accuracy (Bintrafusp alfa) = 0.65; AUROC (Trastuzumab 1) = 0.64; Accuracy (Trastuzumab 1) = 0.70; AUROC (Trastuzumab 2) = 0.50; Accuracy (Trastuzumab 2) = 0.59. | [203] |
| 2024 | Non-small cell lung cancer | FM-LCT model based on masked autoencoder | Training and validation set: 113 patientsMulti-centric test set: 112 patients | To predict pathological complete response following neoadjuvant immunochemotherapy | Test set: AUROC (LUNAI-uCT) = 0.762; AUROC (LUNAI-eCT) = 0.797; AUROC (LUNAI-fCT) = 0.866.Validation set: AUROC (LUNAI-uCT) = 0.825; AUROC (LUNAI-eCT) = 0.839; AUROC (LUNAI-fCT) = 0.884. | [204] |
| 2022 | Non-small cell lung cancer | 3D-ShuffleNetV2×0.5 | Training set: 142 patientsInternal validation set: 61 patientsExternal validation set: 71 patients | To predict major pathological responses following neoadjuvant chemoimmunotherapy | DL model: AUROC (Training set) = 0.77; AUROC (Internal validation set) = 0.73; AUROC (External validation set) = 0.72.Combined model: AUROC (Training set) = 0.80; AUROC (Internal validation set) = 0.77; AUROC (External validation set) = 0.75. | [205] |
Neoadjuvant chemotherapy is commonly used before surgery or radiotherapy to reduce tumor burden and improve subsequent treatment outcomes. In breast cancer, Ha et al. developed a CNN based model to predict response to NAC from pretreatment MRI, achieving an overall accuracy of 88% for three class prediction [194]. Qu et al. developed a multichannel CNN using pre-NAC MRI, post NAC MRI, or both, with AUROCs of 0.553, 0.968, and 0.970, respectively [195]. These results suggest that treatment related imaging changes may provide substantially more predictive information than pretreatment imaging alone. Li et al. developed a fully automated integrated DL system (FAIS-DL) to predict axillary pathological complete response after NAC using multiregional dynamic contrast enhanced MRI. The model achieved AUROCs of 0.95, 0.93, and 0.94 in the internal, pooled external, and prospective test sets, respectively [196]. Importantly, application of FAIS-DL reduced the estimated rate of unnecessary axillary lymph node dissection from 47.9% to 6.8% and increased the benefit rate from 52.2% to 86.5%, providing preliminary evidence that DL based response prediction may influence treatment decisions [196].
DL has also been investigated for predicting response to platinum-based therapy in high grade serous ovarian carcinoma and immunotherapy across different cancer types. Ahn et al. developed PathoRiCH, a histopathology-based classifier for predicting response to platinum-based treatment in high grade serous ovarian carcinoma. Although its predictive performance was modest across the SEV, TCGA, and SMC cohorts (AUROC 0.596, 0.602, and 0.593, respectively), combining PathoRiCH with BRCA and HRD status enabled more refined risk stratification [197]. With advances in immune recognition and immune regulation, tumor immune microenvironment and immune checkpoints become research hotspots in immunotherapy [198]. In gastric cancer, Jiang et al. developed a biology guided DL model (bgDL) to classify tumor microenvironment (TME) status from CT images. The model achieved accuracies of 0.810, 0.832, and 0.840 in the training and two validation cohorts, respectively, and predicted response to anti-PD-1 therapy with AUROCs of 0.753 based on TME class, 0.646 based on combined positive score (CPS), and 0.806 using both features [199]. Patients classified into TME classes 1 and 2 showed higher objective response rates than those in classes 3 and 4 [199]. Foersch et al. developed a multistain DL model using immune cell information from CD4+, CD8+, CD68+, and CD20+ cells to derive an AI based immune-score. The model achieved an AUROC of 0.896 for relapse related prediction and was also associated with treatment response to NAC in rectal cancer [200].
Multimodal approaches may further improve treatment response prediction by integrating complementary imaging and molecular information. Park et al. combined FDG PET imaging with RNA sequencing data to predict cytolytic activity in lung adenocarcinoma, with higher predicted cytolytic activity associated with greater tumor shrinkage and a lower risk of progression during immune checkpoint blockade therapy [201]. Jiang et al. integrated radiomics and DL to predict TME status and potential benefit from adjuvant chemotherapy and checkpoint blockade immunotherapy in gastric cancer, providing a noninvasive approach for treatment stratification [202]. Hoang et al. developed ENLIGHT DeepPT, a two-step framework that first predicted genome wide tumor mRNA expression from histopathological slides and then used the inferred expression profiles to predict response to targeted and immune therapies. The framework successfully identified responders across five independent patient cohorts, with an overall odds ratio of 2.28 [203]. In non-small cell lung cancer (NSCLC), Ye et al. developed DL models based on non-contrast enhanced and contrast enhanced CT for predicting pathological complete response to neoadjuvant immunochemotherapy. The fused model achieved an AUROC of 0.866, outperforming the individual models [204]. Similarly, She et al. developed a 3D ShuffleNetV2 based model to predict major pathological response to neoadjuvant chemoimmunotherapy, achieving AUROCs of 0.73 and 0.72 in the internal and external validation cohorts, respectively. Incorporation of clinical variables increased the AUROCs to 0.77 and 0.75 [205].
Collectively, these studies indicate that DL can integrate imaging, pathological, molecular, and clinical information to estimate treatment sensitivity and identify patients who may benefit from specific therapeutic strategies. Multimodal models and prospective validation appear particularly valuable for moving response prediction toward clinical decision support.
Deep learning applications in predicting cancer survival
Accurate survival prediction is essential for individualized treatment planning and follow-up management. Common clinical endpoints include overall survival (OS), progression-free survival (PFS), disease-free survival (DFS), and relapse-free survival (RFS) [206]. DL models have increasingly been developed to predict these outcomes by integrating radiomics, pathomics, genomics, and clinical features (Table 12).
Deep learning application in predicting cancer survival.
| Year | Cancer type | Method | Cohort Size | Objective | Performance | Ref. |
|---|---|---|---|---|---|---|
| 2021 | Pan-cancer | DeepProg, an ensemble framework integrating autoencoders and machine learning | Large scale of public data | To predict patient survival subtypes | Pan-cancer analysis: log-rank p < 0.05; C-index ranges from 0.6 to 1.0 in all 32 cancer types.External HCC and BRCA validation set: DeepProg is highly predictive, exemplified by 2 liver cancer (C-index 0.73-0.80) and 4 breast cancer datasets (C-index 0.68-0.73). | [207] |
| 2022 | Colorectal cancer lung metastasis | Weakly supervised, patch-level convolutional neural network (WSISA framework) | 103 patients | To predict OS and DFS | AUROC (OS) = 0.860; AUROC (DFS) = 0.875. | [208] |
| 2022 | Hepatocellular carcinoma | DeepAttnMISL based on VGG19 | Training set: 231 patientsTest set: 115 patients | To predict overall survival | C-index = 0.746; AUROC (1-year OS) = 0.816; AUROC (3-year OS) = 0.810; Log-rank p = 0.001. | [209] |
| 2021 | Non-small cell lung cancer | DenseNet, NFNet, EfficientNet, and ResNet | 2685 patients | To predict prognosis | DenseNet+CoxPH: C-index = 0.71; Accuracy (2-year survival) = 0.71; Accuracy (5-year survival) = 0.95. | [210] |
| 2024 | Muscle invasive bladder cancer | ResNet-50 with convolutional block attention module | Training set: 221 patientsInternal validation set: 96 patientsExternal validation set: 88 patients | To predict overall survival | DL-Score performance:Internal validation: C-index = 0.690; AUROC (1-year survival) = 0.740; AUROC (3-year survival) = 0.693; AUROC (5-year survival) = 0.778.External validation: C-index = 0.658; AUROC (1-year survival) = 0.663; AUROC (3-year survival) = 0.713; AUROC (5-year survival) = 0.812.Combined model performance:Internal validation: C-index = 0.713; AUROC (1-year survival) = 0.792; AUROC (3-year survival) = 0.716; AUROC (5-year survival) = 0.815.External validation: C-index = 0.685; AUROC (1-year survival) = 0.843; AUROC (3-year survival) = 0.756; AUROC (5-year survival) = 0.754. | [211] |
| 2024 | Prostate cancer | TriPath based on CNN or vision Transformer (ViT) | OTLS development cohort: 50 patientsOTLS held-out cohort: 24 patientsMicroCT cohort: 45 patients | To predict clinical outcomes | Development dataset of OTLS cohort: AUROC (3D whole volume) = 0.860.Held-out dataset of OTLS cohort: AUROC (3D whole volume) = 0.804.MicroCT cohort: AUROC (3D whole volume) = 0.749. | [212] |
| 2021 | Hepatocellular carcinoma | ResNet-18, ResNet-50 | Zhongshan cohort: 2451 WSIs from 1125 patientsTCGA cohort: 320 WSIs from 320 patients | To classify tissues and predict prognosis | Tumor classification: (1) Internal validation set: Accuracy = 0.982; (2) External validation set: Accuracy = 0.921.Prognosis prediction: (1) Internal validation set: TRS-high patients showed worse OS (HR = 4.47), worse CSS (HR = 4.98) and higher recurrence (HR = 2.55). Multivariable analysis revealed TRS as independent prognostic indicator for OS (HR = 3.32) and RFS (HR = 2.05); (2) External validation set: TRS-high patients showed worse survival (HR = 3.49). Multivariable analysis revealed TRS as independent prognostic indicator (HR = 2.64). | [213] |
| 2022 | Hepatocellular carcinoma | 2-layer feedforward neural network | Training set: 130 patientsValidation set: 63 patients | To predict postoperative long-term OS for patients with microvascular invasion after R0 liver resection | Training set: AUROC (1-year OS) = 0.8065; AUROC (3-year OS) = 0.7404; AUROC (5-year OS) = 0.7944.Validation set: AUROC (1-year OS) = 0.8366; AUROC (3-year OS) = 0.8604; AUROC (5-year OS) = 0.9194. | [214] |
| 2025 | Pediatric low-grade gliomas | 3D nnU-Net for feature extraction and fully connected neural network for survival prediction | DF/BCH cohort: 200 patientsCBTN cohort: 196 patients | To predict postoperative recurrence | C-index (total) = 0.85; C-index (DF/BCH set) = 0.85; C-index (CBTN set) = 0.87; AUROC (3-year EFS, total) = 0.88; AUROC (3-year EFS, DF/BCH set) = 0.85; AUROC (3-year EFS, CBTN set) = 0.89.Predicted low-risk patients showed higher EFS rates than high-risk patients (log-rank p<0.0001). | [215] |
| 2025 | Pan-cancer | PCLSurv, prototypical contrastive learning based on autoencoder and bilinear fusion | 160 AML samples, 619 breast cancer samples, 219 colon cancer samples, 273 GBM samples, 182 kidney cancer samples, 365 liver cancer samples, 329 lung cancer samples, 428 melanoma samples, 285 ovarian cancer samples, 255 sarcoma samples, and 2557 integrated samples | To predict cancer survival | C-index (AML) = 0.751; C-index (breast) = 0.777; C-index (colon) = 0.780; C-index (GBM) = 0.654; C-index (kidney) = 0.800; C-index (liver) = 0.670; C-index (lung) = 0.683; C-index (melanoma) = 0.651; C-index (ovarian) = 0.680; C-index (sarcoma) = 0.755; C-index (integrated) = 0.715; AUROC (AML) = 0.841; AUROC (breast) = 0.815; AUROC (colon) = 0.753; AUROC (GBM) = 0.707; AUROC (kidney) = 0.833; AUROC (liver) = 0.689; AUROC (lung) = 0.726; AUROC (melanoma) = 0.697; AUROC (ovarian) = 0.729; AUROC (sarcoma) = 0.813; AUROC (integrated) = 0.761. | [216] |
| 2024 | Clear cell renal cell carcinoma | MMPS model, utilizes CNN for WSI feature extraction and machine learning methods for analysis of pathomics and radiomics | General cohort: 238 patientsTCGA cohort: 137 patientsCPTAC cohort: 39 patients | To predict DFS and classify high- and low-risk patients | Predict DFS: AUROC (general cohort) = 0.742; AUROC (TCGA cohort) = 0.917; AUROC (CPTAC cohort) = 0.900; Log-rank p < 0.0001 in all 3 cohorts.In the whole patient cohort: Patients with higher MMPS risk showed worse DFS (HR = 13.380, p<0.0001). Multivariable Cox regression showed MMPS was the independent prognostic factor for DFS prediction (HR = 1.0493, p<0.0001). | [217] |
| 2024 | Localized clear cell renal cell carcinoma | 3D CNN based on ResNet-50 backbone | Training set: 364 patientsInternal testing set: 156 patientsExternal testing set: 187 patients | To predict DFS | Internal testing set: C-index = 0.781; AUROC (3-year) = 0.787; AUROC (5-year) = 0.852; AUROC (7-year) = 0.913.External testing set: C-index = 0.754; AUROC (3-year) = 0.836; AUROC (5-year) = 0.797; AUROC (7-year) = 0.806. | [218] |
| 2024 | Non-small cell lung cancer | 3D CNN | Training set: 798 patientsInternal validation set: 470 patientsExternal validation set: 279 patients | To predict bone metastasis-free survival (BMFS) | Internal validation: (1) DL signature: C-index = 0.799; AUROC (1-year) = 0.766; AUROC (2-year) = 0.768; AUROC (3-year) = 0.825; (2) DLCS: C-index = 0.806; AUROC (1-year) = 0.826; AUROC (2-year) = 0.820; AUROC (3-year) = 0.865.External validation: (1) DL signature: C-index = 0.818; AUROC (1-year) = 0.856; AUROC (2-year) = 0.819; AUROC (3-year) = 0.848; (2) DLCS: C-index = 0.834; AUROC (1-year) = 0.860; AUROC (2-year) = 0.864; AUROC (3-year) = 0.884. | [219] |
| 2019 | Non-small cell lung cancer | Convolutional neural network and recurrent network | Dataset A: 179 patientsDataset B: 89 patients | To predict prognosis (Dataset-A) and pathological response (Dataset-B) | Predict 2-year OS: AUROC (baseline model) = 0.58; AUROC (1 month scan) = 0.64; AUROC (3 months scan) = 0.69; AUROC (6 months scan) = 0.74.Predict pathologic responses: AUROC (CNN) = 0.65; AUROC (CNN+volume change) = 0.67. | [220] |
| 2022 | High-grade serous ovarian cancer | Vision transformer, RNN | Training set: 550 patientsValidation set: 184 patients | To predict overall survival | Training set: AUROC = 0.822; Sensitivity = 85.2%; Specificity = 72.4%.Validation set: AUROC = 0.823; Sensitivity = 83.7%; Specificity = 69.5%. | [221] |
| 2023 | Non-small cell lung cancer | 3D CNN | UMCG training set: 189 patientsUMCG test set: 81 patientsMaastro test set: 228 patients | To predict 2-year OS | UMCG test set: AUROC (DL model) = 0.62; Sensitivity (DL model) = 0.33; Specificity (DL model) = 0.92; AUROC (Hybrid model) = 0.76; Sensitivity (Hybrid model) = 0.62; Specificity (Hybrid model) = 0.80.Maastro test set: AUROC (DL model) = 0.58; Sensitivity (DL model) = 0.65; Specificity (DL model) = 0.55; AUROC (Hybrid model) = 0.64; Sensitivity (Hybrid model) = 0.76; Specificity (Hybrid model) = 0.52. | [222] |
For example, Poirion et al. developed the DeepProg, an ensemble framework that combined autoencoders and ML, to predict patient survival subtypes through multi-omics data, exhibiting superior accuracy across 32 cancer types [207]. Wang et al. developed a multimodal nomogram that integrated DL-derived pathomics features from a weakly supervised convolutional neural network, radiomics signatures, immunoscores, and clinical factors to predict postoperative OS and DFS in colorectal cancer patients with surgically resected lung metastases, achieving AUROCs of 0.860 and 0.875, respectively [208]. Moreover, Hou et al. developed a multi-modal prognostic model integrating histopathology, genomic data, and clinical features to predict OS in HCC and achieved high performance with a C-index of 0.746, AUROCs of 0.816 (1-year OS) and 0.810 (3-year OS) on the test set [209]. The study's innovation lay in its multimodal approach, which adopted VGG19 to extract features from WSIs and integrated the resulting image features with WGCNA-based gene co-expression analysis to improve prognostic performance [209]. Oh et al. developed an innovative DL framework that utilized PET maximum intensity projection images to predict the survival of NSCLC patients through integrating survival estimation models (CoxPH and CoxCC) with multiple CNN models (DenseNet, NFNet, EfficientNet, and ResNet) [210]. Among them, the combination of DenseNet and CoxPH model achieved superior performance with a C-index of 0.71, an accuracy of 71% in predicting 2-year survival and an accuracy of 95% in predicting 5-year survival [210]. Wei et al. developed a CBAM-enhanced DL model to predict OS in muscle-invasive bladder cancer from preoperative CT images. The DL model outperformed radiomics and clinical models in external validation, while a fusion model incorporating clinicopathological factors, radiomics, and DL features further increased the C-index to 0.685 [211]. In prostate cancer, Song et al. developed TriPath, a weakly supervised AI approach for analyzing three-dimensional pathology images, which achieved an AUROC of 0.860 for biochemical recurrence risk stratification and outperformed conventional two-dimensional pathological approaches and clinical baselines [212]. Other related reports and more detailed information were summarized in Table 12 [213-222].
Despite promising predictive performance, the generalizability of DL-based survival models remains a major barrier to clinical translation. Differences in treatment regimens, patient characteristics, pathological features, imaging protocols, and institutional practices can introduce substantial distribution shifts between cohorts. For example, Qiu et al. developed a multitask DL model using longitudinal CT images to predict OS in locally advanced gastric cancer after NAC. Its C-index decreased from 0.674 in the internal cohort to 0.661 in the external cohort, which may have been partly related to differences in NAC regimens and treatment cycles between centers [223]. Similarly, Xu et al. reported lower survival prediction performance in an external real-world cohort than in the internal SEER cohort for triple-negative breast cancer (C-index 0.758 vs. 0.816), potentially reflecting differences in population characteristics, geographic region, and sample size [224]. These findings highlight that high internal performance does not necessarily indicate robust clinical generalizability.
Multimodal integration may provide a potential strategy to improve the robustness and clinical utility of survival prediction. Wang et al. developed CerviPro, a multimodal deep survival model that incorporated pretreatment and post-treatment CT features, handcrafted radiomics, clinical characteristics, laboratory parameters, and treatment information to predict DFS in cervical cancer after definitive radiotherapy [225]. CerviPro achieved a C-index of 0.806, outperforming DeepSurv (0.717) and the conventional Cox model (0.663). Moreover, the multimodal model performed better than models based on individual feature modalities, supporting the value of integrating complementary clinical, imaging, and treatment information [225].
Collectively, DL has demonstrated the ability to extract complementary prognostic information from heterogeneous data sources and may improve individualized risk stratification.
Deep learning applications in predicting gene mutation and oncogene expression
The accurate prediction of gene mutations and key oncogene expression is crucial for understanding cancer etiology, prognosis, and targeted therapy. However, they are difficult to observe by naked eye and largely rely on NGS technologies, which have high price and long detection period. How to rapidly identify genetic alterations from pathology or radiomic images remains a challenge. DL models can help in detecting gene mutations and expression (Table 13).
Deep learning application in predicting gene mutations and oncogene expression.
| Year | Cancer type | Method | Cohort Size | Objective | Performance | Ref. |
|---|---|---|---|---|---|---|
| 2018 | Lung adenocarcinoma | Inception v3 | Internal set: 1634 WSIsExternal test set: 340 WSIs | Predict tumor-related gene mutations | Per-tile AUROC: AUROC (STK11) = 0.845; AUROC (EGFR) = 0.754; AUROC (SETBP1) = 0.785; AUROC (TP53) = 0.674; AUROC (FAT1) = 0.739; AUROC (KRAS) = 0.814.Per-slide AUROC after aggregation by average predicted probability: AUROC (STK11) = 0.856; AUROC (EGFR) = 0.826; AUROC (SETBP1) = 0.775; AUROC (TP53) = 0.760; AUROC (FAT1) = 0.750; AUROC (KRAS) = 0.733.Per-slide AUROC after aggregation by percentage of positively classified tiles: AUROC (STK11) = 0.842; AUROC (EGFR) = 0.782; AUROC (SETBP1) = 0.752; AUROC (TP53) = 0.754; AUROC (FAT1) = 0.750; AUROC (KRAS) = 0.716. | [41] |
| 2021 | Lung cancer | DeepIMLH based on CNN and ResNet | 180 images from 180 patients | To predict gene mutation status | Accuracy (AKT1) = 72%; Accuracy (FGFR1) = 83%; Accuracy (FGFR2) = 82%; Accuracy (HRAS) = 79%; Accuracy (MET) = 86%. | [226] |
| 2025 | Non-small cell lung cancer | MoCo-V3 based on vision Transformer | Cross-validation set: 28052 patientsHold-out set: 4962 patients | To predict ROS1 and ALK fusions | ROS1 fusion: (1) Test set: AUROC = 0.85; Accuracy = 0.92; PPA = 0.50; PPV = 0.06; F1-score = 0.10; NPA = 0.92; (2) Hold-out set: AUROC = 0.85; Accuracy = 0.92; PPA = 0.48; PPV = 0.06; F1-score = 0.10; NPA = 0.93.ALK fusion: (1) Test set: AUROC = 0.85; Accuracy = 0.90; PPA = 0.59; PPV = 0.12; F1-score = 0.20; NPA = 0.91; (2) Hold-out set: AUROC = 0.84; Accuracy = 0.90; PPA = 0.54; PPV = 0.11; F1-score = 0.19; NPA = 0.91. | [227] |
| 2021 | Colon cancer | TGMDN based on ShuffleNet V2 | 44534 image patches | To predict gene mutation status | AUROC (APC) = 0.76; AUROC (TP53) = 0.79; AUROC (KRAS) = 0.77. | [228] |
| 2025 | Colorectal cancer | Transformer | GECCO cohort(s): 1376 patientsTCGA/CPTAC cohorts: 536 patients | To predict gene mutation status and microsatellite instability (MSI) | Multi-target transformer in external validation: AUROC (BRAF) = 0.78; AUROC (Hypermutation) = 0.88; AUROC (MSI) = 0.93; AUROC (RNF43) = 0.86. | [229] |
| 2025 | Pancreatic cancer | Clustering-constrained attention multiple instance learning | TCGA-PAAD cohort: 162 WSIs and 162 RNA-Seq samplesCPTAC-PDA cohort: 167 WSIs and 192 RNA-Seq samples | To predict KRAS, TP53, SMAD4, and CDKN2A mutations | Voting model: (1) KRAS: AUROC = 0.90; AUPRC = 0.98; (2) SMAD4: AUROC = 0.71; AUPRC = 0.38; (3) TP53: AUROC = 0.75; AUPRC = 0.85; (4) CDKN2A: AUROC = 0.63; AUPRC = 0.30.ML model: (1) KRAS: AUROC = 0.92; AUPRC = 0.98; (2) SMAD4: AUROC = 0.70; AUPRC = 0.39; (3) TP53: AUROC = 0.71; AUPRC = 0.80; (4) CDKN2A: AUROC = 0.64; AUPRC = 0.37. | [230] |
| 2025 | Acute myeloid leukemia | DenseNet121 and YOLOv4 | Training set: 400 WSIsValidation set: 56 WSIsTest set: 116 WSIs | To predict gene mutations | AUROC (NPM1) = 0.90; AUROC (FLT3-ITD) = 0.80. | [231] |
| 2021 | Non-small cell lung cancer | 3D CNN | Training set: 882 patientsValidation set: 125 patientsTest set: 255 patients | To predict EGFR mutation and PD-L1 expression | Training set: Accuracy = 0.90; AUROC = 0.96; Sensitivity = 0.74; Specificity = 0.93.Validation set: Accuracy = 0.78; AUROC = 0.80; Sensitivity = 0.48; Specificity = 0.84.Test set: Accuracy = 0.75; AUROC = 0.73; Sensitivity = 0.43; Specificity = 0.82. | [232] |
| 2022 | Colorectal cancer | Multitask dual-stream attention network | Hospital cohort: 306 patientsMSD public cohort: 126 patients | To predict KRAS mutation | Accuracy = 89.95%; Sensitivity = 89.29%; Specificity = 90.53%; AUROC = 95.73%. | [233] |
| 2021 | Colorectal cancer | Spatial-Frequency Dual-Branch Attention Model | 306 patients | To predict KRAS mutation | Accuracy = 88.03%; AUROC = 94.27%; Specificity = 90.75%. | [234] |
| 2024 | Colorectal cancer | SG-Transunet based on CNN and Transformer | 306 patients | To predict KRAS mutation | Accuracy = 89.87%; Sensitivity = 86.56%; Specificity = 92.36%; AUROC = 96.03%; Precision = 89.52%; F1-score = 88.00%. | [235] |
| 2021 | Pancreatic Cancer | Multi-Modal Bilinear CNN based on ResNet-18 | 64 patients | To predict TP53 mutation | Accuracy = 0.736; AUROC = 0.740; Sensitivity = 0.775; Specificity = 0.680; Precision = 0.810; F1-score = 0.783. | [236] |
Pathology-based DL models have been extensively investigated for predicting genetic alterations from H&E-stained images. Coudray et al. developed an InceptionV3 based model to predict several gene mutations, including STK11, EGFR, FAT1, SETBP1, KRAS, and TP53, from lung adenocarcinoma (LUAD) images, with AUROCs ranging from 0.733 to 0.856 in a held-out cohort [41]. Huang et al. developed DeepIMLH, a DL method that utilized deep convolution Gaussian mixture model (DCGMM) for color normalization and leveraged CNN and ResNet for mutated gene identification from histopathological stained images in lung cancer, reaching high accuracy for 5 frequently mutated genes identification (i.e., AKT1, FGFR1, FGFR2, HRAS, MET) [226]. In NSCLC, Amidi et al. utilized the 2-step vision Transformer approach for predicting ROS1 and ALK fusions from H&E slides, achieving AUROC values of 0.85 for ROS1 and 0.84 for ALK on a holdout dataset [227]. In colon cancer, Bian et al. developed a DL framework called ImmunoAIzer, which could detect APC, TP53, and KRAS gene mutations from H&E images, providing an effective and lower-cost tool for the guidance of therapy [228]. Gustav et al. utilized the Transformer-based DL algorithm for biomarker detection from histopathology slides, which achieved an AUROC of 0.78 for BRAF mutation, 0.86 for RNF43 mutation, 0.88 for hypermutation, and 0.93 for microsatellite instability (MSI) [229]. Similarly, in pancreatic ductal adenocarcinoma (PDAC), Berloco et al. established 2 multimodal frameworks (a voting model and a machine learning fusion model) based on histopathological WSIs and transcriptomic profiles, to predict genetic mutations in KRAS, TP53, SMAD4, and CDKN2A, achieving high AUROC values [230]. In AML, Wei et al. proposed a DL model based on multiple instance learning and ensemble techniques without requiring patch- or cell-level annotations to predict NPM1 (AUROC: 0.90) and FLT3-ITD mutations (AUROC: 0.80) from 572 WSIs, indicating a great potential for clinical application [231].
DL has also been applied to infer genetic alterations from radiological images. Wang et al. developed a 3D CNN model to predict EGFR mutation and PD-L1 expression from CT images, achieving an accuracy of 0.75 and an AUROC of 0.73 in the test cohort [232]. Song et al. developed a multi-task dual-stream attention network for predicting KRAS mutations in CRC based on T2 MRI images, achieving an average accuracy of 89.95%, an average sensitivity of 89.29%, an average specificity of 90.53%, and an average AUROC of 95.73% [233]. This approach introduced the interlayer loss function to alleviate the overfitting problem caused by small dataset to some extent, suggesting its great potential for clinical application [233]. To address the issues of limited annotated dataset, large intra-class variances, and a high degree of inter-class similarities, Ma et al. developed a spatial-frequency dual-branch attention model to assess KRAS gene mutation in T2-weighted MRI images from CRC patients, which achieved satisfactory performance (Accuracy: 88.03%, AUROC: 94.27%) [234]. An improved model incorporating Transformer blocks, segmentation-guided multitask learning, and aggregate attention further increased the accuracy and AUROC to 89.87% and 0.960, respectively [235]. Chen et al. developed a spiral transformation and model-driven DL scheme based on multi-modal MRI 3D images to automatically predict TP53 mutation in pancreatic cancer (Accuracy: 73.6%, AUROC: 0.740), providing a novel paradigm to deal with small sample sizes [236].
Collectively, these studies demonstrate that DL can infer clinically relevant molecular alterations from routine pathology and radiological images, potentially providing a noninvasive and cost-effective complement to conventional molecular testing. This capability may be particularly valuable when tissue samples are limited or repeated molecular testing is difficult.
Clinical maturity of deep learning models: From proof-of-concept to clinical implementation
Although DL models have demonstrated excellent predictive performance across cancer diagnosis, treatment decision-making, and risk prediction, high AUROC, accuracy, or F1-score alone does not necessarily indicate clinical readiness. The clinical maturity of a DL model depends on multiple factors, including study design, sample size and class balance, data source, internal and external validation, prospective evaluation, comparison with clinicians, availability of open code or data, and actual implementation in clinical practice. Therefore, we further evaluated representative studies according to these dimensions and classified DL models according to their progression from proof-of-concept to clinical implementation. The detailed assessment is summarized in Table 14.
Clinical translation and maturity assessment of deep learning models in cancer research.
| Study | Task | Data source | Sample size / class balance | Prospective study | Internal validation | External validation | Clinician comparison | Open code | Implementation status | Maturity stage |
|---|---|---|---|---|---|---|---|---|---|---|
| Nagpal et al., 2020 [34] | Automated tumor detection, Gleason-pattern quantification, and Gleason grade-group classification of prostate needle-core biopsy specimens | Multi-center | Development set: 524 biopsies (biopsy-level) and 1681287 patches (region-level)Internal validation set: 430 biopsiesExternal validation set: 322 biopsies | No | Yes | Yes | Yes | No | Research only | M2: External clinical validation |
| Bulten et al., 2020 [35] | Automated prostate cancer detection, gland-level Gleason pattern segmentation, and biopsy-level Gleason score/grade-group classification | Single-center and public data | Training set: 4712 biopsiesTuning set: 497 biopsiesInternal test set: 535 biopsiesObserver set: 100 biopsiesExternal test set: 245 biopsies | No | Yes | Yes | Yes | No | Research only | M2: External clinical validation |
| Coudray et al., 2018 [41] | Classification of normal lung, LUAD, and LUSC; prediction of common LUAD mutations, including STK11, EGFR, FAT1, SETBP1, KRAS, and TP53 | Single-center and public data | Internal set: 1634 WSIsExternal test set: 340 WSIs | No | Yes | Yes | Yes | Yes | Research only | M2: External clinical validation |
| Sirinukunwattana et al., 2021 [43] | Prediction of CRC consensus molecular subtypes (CMS1-4) from H&E-stained resection and preoperative biopsy slides | Multi-center and public data | FOCUS cohort: 666 slidesTCGA cohort: 468 slidesGRAMPIAN cohort: 406 slides | No | Yes | Yes | No | No | Research only | M2: External clinical validation |
| Cheng et al., 2022 [44] | Seven-class classification of hepatocellular nodular lesions and background liver tissues from H&E WSIs: WD-HCC, HGDN, LGDN, FNH, HCA, nodular cirrhosis, and nearly normal liver | Multi-center | Internal set: 649 slidesExternal set 1: 30 slidesExternal set 2: 439 slides | No | Yes | Yes | Yes | Yes | Research only | M2: External clinical validation |
| Marostica et al., 2021 [45] | RCC tumor-region detection; three-class RCC subtype classification (ccRCC/pRCC/chRCC) | Single-center and public data | TCGA set: 2363 slidesCPTAC set: 782 slidesIndependent set: 131 patients | No | Yes | Yes | No | Yes | Research only | M2: External clinical validation |
| Li et al., 2024 [76] | iGCT subtype classification and survival prediction from MRI | Multi-center | Training set: 200 patients. Retrospective internal test set: 80 patients. Prospective internal test set: 22 patients. External test set 1: 22 patients. External test set 2: 20 patients | Yes | Yes | Yes | Yes | Yes | Research only | M3: Prospective clinical evaluation |
| Witowski et al., 2022 [78] | Breast cancer diagnosis from MRI | Multi-center | Training set: 14198 MRI examinations. Internal validation set: 3403 MRI examinations. Internal test set: 3936 MRI examinations. External test set 1: 397 MRI examinations. External test set 2: 922 MRI examinations. | No | Yes | Yes | Yes | Yes | Research only | M2: External clinical validation |
| Spaanderman et al., 2024 [85] | Differentiation of atypical lipomatous tumors from lipomas using MRI | Multi-center | Training set: 116 patients. External validation set (USA): 150 patients.External validation set (UK): 208 patients. Prospective validation set: 86 patients | Yes | Yes | Yes | Yes | Yes | Research only | M3: Prospective clinical evaluation |
| Wei et al., 2024 [88] | Focal liver lesion detection/classification using multiphase CT | Multi-center | Training set: 1580 patientsInternal test set: 1308 patientsHN validation set: 636 patientsCD validation set: 94 patientsGZ validation set: 205 patientsLS validation set: 216 patients | No | Yes | Yes | Yes | Yes | Research only | M2: External clinical validation |
| Chen et al., 2023 [91] | Pancreatic cancer detection on CT | Nationwide/multi-center | Development set: 1023 patientsInternal test set: 256 patientsExternal test set: 1473 patients | No | Yes | Yes | Yes | No | Research only | M2: External clinical validation |
| Zheng et al., 2023 [92] | Lateral lymph-node metastasis in papillary thyroid cancer | Multi-center | Training set: 874 lymph nodes. Internal validation dataset: 376 lymph nodes. External dataset A: 85 lymph nodes. External dataset B: 101 lymph nodes. Real-world dataset: 113 lymph nodes | Yes | Yes | Yes | Yes | No | Research only | M3: Prospective clinical evaluation |
| Gao et al., 2022 [100] | Ovarian cancer diagnosis using pelvic ultrasound | Multi-center | Training set: 575930 imagesInternal validation set: 8416 imagesExternal validation set 1: 1419 imagesExternal validation set 2: 6510 images | No | Yes | Yes | Yes | Yes | Research only | M2: External clinical validation |
| Long et al., 2023 [101] | Differential diagnosis of superficial soft-tissue masses using US | Multi-center | Training set: 618 patientsInternal validation cohort: 154 patientsExternal test cohort A: 156 patientsExternal test cohort B: 123 patients | No | Yes | Yes | Yes | No | Research only | M2: External clinical validation |
| Matek et al., 2021 [107] | Bone marrow cell morphology classification | Single-center | 171374 images from 945 patients | No | Yes | No | No | No | Research only | M1: Internal proof of concept |
| Sun et al., 2025 [108] | Bone marrow cell classification and hematologic diagnosis | Multi-center | Training set: 30394 images from 40 patientsInternal test set: 8507 images from 10 patientsExternal validation set (MSK-normal): 2694 images from 10 patients (morphologically normal)External validation set (MSK-mixed): 11076 images from 655 patients (with normal or diseased marrow) | No | Yes | Yes | Yes | Yes | Research/clinical research | M2: External clinical validation |
| Eckardt et al., 2022 [110] | AML detection and NPM1 mutation prediction from bone marrow smears | Single-center | Training set: 8505 imagesTest set: 2127 images | No | Yes | No | No | Yes | Research only | M1: Internal proof of concept |
| Zhao et al., 2020 [127] | Mature B-cell neoplasm classification using flow cytometry | Single-center | Training set: 18274 samplesTest set: 2348 samples | No | Yes | No | No | Yes | Research only | M1: Internal proof of concept |
| Christensen et al., 2023 [137] | Low-frequency ctDNA variant calling and cancer detection | Single-center / study-specific cohort | 85 patients | No | Yes | No | No | No | Research only | M1: Internal proof of concept |
| Zakrzewski et al., 2019 [151] | HER2 amplification detection from FISH images | Single-center | Training set: 299 FISH images and 301 nuclei imagesValidation set: 57 FISH images | No | Yes | No | Yes | No | Research only | M1: Internal proof of concept |
| Huang et al., 2021 [156] | Multimodal ultrasound breast cancer diagnosis | Single-center + independent dataset | Dataset A: 835 patientsDataset B: 163 patients | No | Yes | Yes | No | No | Research only | M2: External clinical validation |
| Yang et al., 2025 [162] | Non-invasive gallbladder cancer diagnosis using cfDNA, radiomics and clinical data | Multi-center | Training set: 142 patientsInternal test set: 61 patientsExternal validation set: 98 patients | Yes | Yes | Yes | Yes | Yes | Prospective multicenter evaluation | M3: Prospective clinical evaluation |
| Preuer et al., 2018 [164] | Prediction of anticancer drug combination synergy using DeepSynergy | Public dataset (Merck oncology screen) | 583 drug pairs tested on 39 cell lines | No | Yes | No | No | Yes | Research only | M1: Internal proof of concept |
| Wang et al., 2022 [165] | Drug synergy prediction using DeepDDS based on graph neural networks and gene expression profiles | Public drug/cell-line datasets | Benchmark set: 12415 drug pair-cell line combinationsIndependent test set: 668 drug pair-cell line combinations | No | Yes | No | No | Yes | Research only | M1: Internal proof of concept |
| Liu et al., 2022 [168] | Anticancer drug synergy prediction using HypergraphSynergy | Public O'Neil and NCI-ALMANAC datasets | NCI-ALMANAC dataset: 74139 samplesO'Neil dataset: 18950 samples | No | Yes | No | No | Yes | Research only | M1: Internal proof of concept |
| Lou et al., 2019 [169] | Individualized radiotherapy dose prediction based on pretreatment lung CT | Clinical imaging cohort | Internal study set: 849 patientsExternal validation set: 95 patients | No | Yes | Yes | No | No | Research only | M2: External clinical validation |
| Pu et al., 2022 [170] | Deep reinforcement learning for HDR cervical brachytherapy treatment planning | Clinical radiotherapy planning data | 20 patients | No | Yes | No | No | No | Research only | M1: Internal proof of concept |
| Yuan et al., 2022 [171] | Automatic generation of machine-deliverable IMRT plans for cervical cancer | Single-center clinical cohort | 90 cervical cancer IMRT plans; 66 training, 11 validation, 13 test | No | Yes | No | No | No | Research only | M1: Internal proof of concept |
| de Vette et al., 2025 [173] | Deep learning NTCP prediction for late dysphagia after head and neck radiotherapy | Multi-center clinical cohorts (UMCG and MDACC) | Training (UMCG): 941 patientsIndependent test (UMCG): 171 patientsExternal test (MDACC): 338 patients | No | Yes | Yes | No | Yes | Research only / external validation | M2: External clinical validation |
| Maruccio et al., 2024 [177] | Uncertainty estimation for lung cancer GTV segmentation | Clinical CT imaging cohort | 422 patients | No | Yes | No | Yes | No | Research only / clinical assessment | M1: Internal proof of concept |
| Mikalsen et al., 2023 [180] | Clinical evaluation of DL auto-segmentation for thorax and breast radiotherapy | Prospective clinical cohort | 30 patients | Yes | Yes | No | Yes | No | Clinical workflow evaluation | M3: Prospective clinical evaluation |
| Cha et al., 2021 [181] | Clinical implementation of DL contour auto-segmentation for prostate radiotherapy | Single-center prospective clinical cohort | 173 patients; physician evaluation available for 43/55 patients | Yes | Yes | No | Yes | No | Workflow-integrated clinical implementation | M4: Implemented with demonstrated impact |
| Zhu et al., 2025 [182] | Retrospective evaluation of a performance-monitoring framework for clinically deployed prostate radiotherapy auto-segmentation | Real-world clinical workflow | 464 patients | No | Yes | No | Yes | Yes | Auto-segmentation clinically deployed; monitoring framework evaluated retrospectively | M1: Internal proof of concept |
| Xu et al., 2025 [188] | Prediction of vessels encapsulating tumor clusters in HCC using contrast-enhanced ultrasound | Single-center | Training cohort: 195 patientstest cohort: 47 patients | No | Yes | No | No | No | Research only | M1: Internal proof of concept |
| Bergstrom et al., 2024 [191] | Prediction of homologous recombination deficiency and platinum response from histologic slides | Multi-cohort / public and independent clinical cohorts | Multiple independent breast and ovarian cancer cohorts | No | Yes | Yes | No | No | Research only | M2: External clinical validation |
| Li et al., 2024 [196] | Prediction of pathological complete response of axillary lymph nodes after neoadjuvant chemotherapy in breast cancer | Multi-center | Training and validation set: 506 patientsInternal test set: 127 patientsExternal test set: 414 patientsProspective test set: 98 patients | Yes | Yes | Yes | No | Yes | Research only | M3: Prospective clinical evaluation |
| Ahn et al., 2024 [197] | Prediction of platinum-based treatment response in high-grade serous ovarian cancer | Multi-cohort | SEV cohort: 394 patientsTCGA cohort: 284 patientsSMC cohort: 136 patients | No | Yes | Yes | Yes | Yes | Research only | M2: External clinical validation |
| Foersch et al., 2023 [200] | Prediction of prognosis and therapy response in colorectal cancer using multistain pathology | Multi-cohort / public and clinical cohorts | Prognostic cohort (Training/Cross validation): 652 patientsPrognostic cohort (External test): 339 patientsNeoadjuvant cohort (Training/Cross validation): 117 patients | No | Yes | Yes | No | Yes | Research only | M2: External clinical validation |
| Jiang et al., 2023 [202] | Non-invasive tumor microenvironment evaluation and treatment-response prediction in gastric cancer | Multi-institutional | Training cohort: 398 patientsInternal validation cohort 1: 196 patientsInternal validation cohort 2: 602 patientsExternal validation cohort 1: 101 patientsExternal validation cohort 2: 1068 patientsImmunotherapy cohort: 321 patients | No | Yes | Yes | No | Yes | Research only | M2: External clinical validation |
| Hoang et al., 2024 [203] | Prediction of cancer treatment response from histopathology through imputed transcriptomics | Multi-cohort | TCGA cohort: 6269 FFPE slidesTransNEO-breast cohort: 160 FF slidesNCI-brain cohort: 226 FFPE slides | No | Yes | Yes | No | Yes | Research only | M2: External clinical validation |
| Ye et al., 2024 [204] | Prediction of pathological complete response to neoadjuvant immunochemotherapy in NSCLC | Multi-center | Training and validation set: 113 patientsMulti-centric test set: 112 patients | No | Yes | Yes | No | Yes | Research only | M2: External clinical validation |
| She et al., 2022 [205] | Prediction of major pathological response to neoadjuvant chemoimmunotherapy in NSCLC | Multi-center | Training set: 142 patientsInternal validation set: 61 patientsExternal validation set: 71 patients | No | Yes | Yes | No | Yes | Research only | M2: External clinical validation |
| Xv et al., 2024 [218] | Preoperative disease-free survival prediction in localized clear cell renal cell carcinoma | Multi-center | Training set: 364 patientsInternal testing set: 156 patientsExternal testing set: 187 patients | No | Yes | Yes | No | Yes | Research only | M2: External clinical validation |
| Xu et al., 2025 [224] | Survival prediction in triple-negative breast cancer using real-world cohorts | Public + real-world clinical cohort | 37,818 SEER patients plus independent real-world cohort | No | Yes | Yes | No | Yes | Research only | M2: External clinical validation |
| Wang et al., 2025 [225] | Multimodal prognostic prediction in cervical cancer receiving definitive radiotherapy | Multi-center | Training set: 691 patientsValidation set: 173 patientsExternal Validation set: 154 patients | No | Yes | Yes | Yes | Yes | Research only | M2: External clinical validation |
| Amidi et al., 2025 [227] | Prediction of ROS1 and ALK fusions in NSCLC from H&E slides | Multi-cohort | Cross-validation set: 28052 patientsHold-out set: 4962 patients | No | Yes | Yes | No | Yes | Research only | M2: External clinical validation |
| Gustav et al., 2025 [229] | Assessment of genotype-phenotype correlations in colorectal cancer | Multi-center pathology cohorts | GECCO cohort(s): 1376 patientsTCGA/CPTAC cohorts: 536 patients | No | Yes | Yes | No | Yes | Research only | M2: External clinical validation |
| Wei et al., 2025 [231] | Annotation-free prediction of gene mutations from whole-slide images of AML | Single-center clinical cohort | Training set: 400 WSIsValidation set: 56 WSIsTest set: 116 WSIs | No | Yes | No | No | Yes | Research only | M1: Internal proof of concept |
Table 14 summarized the major indicators of clinical maturity, including sample size and class balance, data source, prospective study design, internal and external validation, comparison with clinicians, availability of open code, and implementation status. Overall, most currently reported models remain at the proof-of-concept or early validation stage. Although many studies have demonstrated excellent predictive performance, they are predominantly retrospective and based on single-center cohorts or publicly available datasets, with limited external and prospective validation. Therefore, high performance reported under controlled research settings may not necessarily translate into comparable effectiveness in routine clinical practice.
Compared with proof-of-concept studies, clinically mature models generally require robust external validation across multiple centers and diverse patient populations, preferably followed by prospective evaluation in real-world clinical settings. In addition, comparison with clinicians, integration with existing clinical workflows, and assessment of clinical utility are important indicators of translational maturity. As shown in Table 14, only a limited proportion of studies have simultaneously satisfied multiple criteria, particularly prospective evaluation, clinician comparison, and real-world implementation. This gap indicates that the field has largely progressed from demonstrating algorithmic feasibility toward clinical validation, whereas relatively few models have reached routine clinical implementation.
Notably, the level of clinical maturity varies across different cancer-related applications. Some models for image segmentation, pathology analysis, and radiotherapy planning have progressed toward clinical validation, particularly when they have demonstrated workflow efficiency or acceptable performance in prospective studies. In contrast, models for treatment response prediction, survival prediction, drug combination selection, and therapeutic target discovery remain largely at the proof-of-concept or retrospective validation stage. These differences indicate that algorithmic performance alone is insufficient to determine clinical readiness, and that successful clinical translation depends on robust external validation, prospective evaluation, clinically meaningful endpoints, comparison with existing clinical practice, and effective integration into real-world clinical workflows.
Discussion
Currently, DL has been increasingly applied to cancer diagnosis, treatment, and risk prediction. The studies reviewed in this work demonstrate that DL can improve diagnostic efficiency, facilitate treatment planning, and provide additional information for individualized risk stratification. However, promising model performance does not necessarily indicate clinical readiness. Many reported models were developed retrospectively using single-center datasets or relatively small cohorts, with limited external or prospective validation. This is particularly relevant in oncology, where substantial inter-tumoral and intra-tumoral heterogeneity, differences in patient populations, disease stages, imaging protocols, pathological assessment, and treatment strategies may substantially affect model generalizability. Therefore, model performance should be interpreted together with cohort characteristics, validation strategies, and clinical context rather than relying solely on metrics such as AUROC or accuracy.
During model development, several sources of bias and noise may compromise the reliability and generalizability of DL models, including data leakage, selection/spectrum bias, label noise, and center- or device-related bias. Data leakage may occur through feature selection, the use of illegitimate information, subject-level overlap, or temporal leakage. These problems may result from inadequate separation between training and test datasets, inappropriate use of information that should not be available for prediction, or test populations that do not adequately represent the population of scientific interest, thereby limiting the validity and generalizability of model evaluation [237]. Young et al. reported substantially higher predictive accuracy in datasets with a high risk of data leakage than in datasets with lower leakage risk, highlighting the potential impact of leakage on model evaluation [238]. Additionally, the subjectivity is inevitable during data screening process or only patients with typical symptoms were included in model during the inclusion/exclusion tasks, which builds a narrow, idealized, and non-representative training environment for model and makes it less universally applicable [239-241]. Moreover, the labelling work is highly labor-intensive, time-consuming, professional, and subjective. These differences can affect the accuracy of manual labeling, which introduces noise. The label noise directly interferes with the true association between image features and disease outcomes. Even if the proportion of erroneous labels in the training set is as low as 10%, the model's generalization ability may be poor. [242]. Center/device bias also often exists due to different model devices, imaging protocol, and image quality. This introduces a between-batch systematic error, which results in an inaccurate model and needs to be properly addressed [243-245]. These findings highlight the importance of representative patient selection, standardized data acquisition and annotation, and multicenter datasets for developing robust and generalizable DL models.
Beyond methodological considerations, the translation of DL into routine cancer care also involves practical and ethical challenges. Many models remain difficult to integrate into existing hospital information systems and clinical workflows, limiting their sustained use in real-world settings. More importantly, the increasing use of patient data for model development raises concerns regarding privacy protection, data sharing, informed consent, accountability for AI-assisted decisions, and patients' autonomy in accepting or refusing AI-supported care. These issues are particularly important when DL models are used for high-stakes decisions such as cancer diagnosis, treatment selection, or prognosis estimation. In addition, limited interpretability may reduce clinicians' confidence in model predictions, especially when models provide highly accurate results without clinically understandable explanations. Therefore, clinical adoption requires not only technical performance but also transparency, appropriate human oversight, and clearly defined responsibilities.
Overall, the current evidence suggests that the major challenge for DL in oncology is shifting from improving algorithmic performance to demonstrating reliability, generalizability, interpretability, and clinical utility. Standardized datasets, transparent reporting, multicenter external validation, and prospective clinical evaluation are important for establishing robust evidence. At the same time, effective integration with existing clinical workflows, appropriate regulatory and ethical frameworks, and human-AI collaboration will be necessary for responsible clinical adoption. Ultimately, the value of DL in cancer care should be evaluated not only by whether it achieves higher predictive performance, but also by whether it can provide reproducible and clinically meaningful benefits to patients.
Supplementary Material
Supplementary figure.

Acknowledgements
Funding
This work was supported by the Chongqing Technical Innovation and Application Development Special Major Project (CSTB2023TIAD-STX0008), the Chongqing Science and Health Joint Medical Research Key Project (2024DBXM004), the Youth Program of the National Natural Science Foundation of China (82300197), the Special Project for Talent Construction in Xinqiao Hospital (2022XKRC001).
AI use statement
During the preparation of this work, the authors did not use generative AI or AI-assisted technologies. The authors take full responsibility for the content of the publication.
Author contributions
SL, XW, NL, WY, and JL wrote the manuscript and made the figures and tables. SW, JZ, DH, YG, PW, and TT collected the related literature. HW, SC, YT, and CY sorted and summarized the related information. CZ, XP, and XZ designed the review and critically revised and edited the manuscript. All the authors reviewed the manuscript.
Competing Interests
The authors have declared that no competing interest exists.
References
1. Sung H, Ferlay J, Siegel RL, Laversanne M, Soerjomataram I, Jemal A. et al. Global cancer statistics 2020: GLOBOCAN estimates of incidence and mortality worldwide for 36 cancers in 185 countries. CA Cancer J Clin. 2021;71(3):209-49
2. Liu J, Gou Y, Yang W, Wang H, Zhang J, Wu S. et al. Development and application of machine learning models for hematological disease diagnosis using routine laboratory parameters: a user-friendly diagnostic platform. Front Med (Lausanne). 2025;12:1605868
3. Yang W, Liu J, Gou Y, Huang X, Chen M, Huang D. et al. Development and validation of an interpretable machine learning model for predicting philadelphia chromosome-positive acute lymphoblastic leukaemia using clinical and laboratory parameters: a single-centre retrospective study. BMJ Open. 2025;15(6):e097526
4. Unger M, Kather JN. Deep learning in cancer genomics and histopathology. Genome Med. 2024;16(1):44
5. Sounderajah V, Ashrafian H, Rose S, Shah NH, Ghassemi M, Golub R. et al. A quality assessment tool for artificial intelligence-centered diagnostic test accuracy studies: QUADAS-AI. Nat Med. 2021;27(10):1663-5
6. Bera K, Katz I, Madabhushi A. Reimagining t staging through artificial intelligence and machine learning image processing approaches in digital pathology. JCO Clin Cancer Inform. 2020;4:1039-50
7. Topol EJ. High-performance medicine: the convergence of human and artificial intelligence. Nat Med. 2019;25(1):44-56
8. Mcculloch WS, Pitts W. A logical calculus of the ideas immanent in nervous activity. The bulletin of mathematical biophysics. 1943;5(4):115-33
9. Rosenblatt F. The perceptron: a probabilistic model for information storage and organization in the brain. Psychol Rev. 1958;65(6):386-408
10. Fukushima K. Neocognitron: a self organizing neural network model for a mechanism of pattern recognition unaffected by shift in position. Biol Cybern. 1980;36(4):193-202
11. Rumelhart DE, Hinton GE, Williams RJ. Learning representations by back-propagating errors. Nature. 1986;323(6088):533-6
12. Elman JL. Finding structure in time. Cogn Sci. 1990;14(2):179-211
13. Lecun Y, Bottou L, Bengio Y, Haffner P. Gradient-based learning applied to document recognition. Proc IEEE Inst Electr Electron Eng. 1998;86(11):2278-324
14. Krizhevsky A, Sutskever I, Hinton GE. ImageNet classification with deep convolutional neural networks. Commun ACM. 2012;60:84-90
15. Xu Y, Jia Z, Wang L, Ai Y, Zhang F, Lai M. et al. Large scale tissue histopathology image classification, segmentation, and visualization via deep convolutional activation features. BMC Bioinformatics. 2017;18(1):281
16. Shin HC, Roth HR, Gao M, Lu L, Xu Z, Nogues I. et al. Deep convolutional neural networks for computer-aided detection: CNN architectures, dataset characteristics and transfer learning. IEEE Trans Med Imaging. 2016;35(5):1285-98
17. Lan L, You L, Zhang Z, Fan Z, Zhao W, Zeng N. et al. Generative adversarial networks and its applications in biomedical informatics. Front Public Health. 2020;8:164
18. Vaswani A, Shazeer N, Parmar N, Uszkoreit J, Jones L, Gomez AN. et al. Attention is all you need. Adv Neural Inf Process Syst. 2017 30
19. Li Y, Rao S, Solares JRA, Hassaine A, Ramakrishnan R, Canoy D. et al. BEHRT: transformer for electronic health records. Sci Rep. 2020;10(1):7155
20. Moussad B, Roche R, Bhattacharya D. The transformative power of transformers in protein structure prediction. Proc Natl Acad Sci U S A. 2023;120(32):e2303499120
21. Yang F, Wang W, Wang F, Fang Y, Tang D, Huang J. et al. ScBERT as a large-scale pretrained deep language model for cell type annotation of single-cell RNA-seq data. Nat Mach Intell. 2022;4(10):852-66
22. Takahashi S, Sakaguchi Y, Kouno N, Takasawa K, Ishizu K, Akagi Y. et al. Comparison of vision transformers and convolutional neural networks in medical image analysis: a systematic review. J Med Syst. 2024;48(1):84
23. Howard AG, Zhu M, Chen B, Kalenichenko D, Wang W, Weyand T. et al. MobileNets: efficient convolutional neural networks for mobile vision applications. ArXiv. 2017 abs/1704.04861
24. Gu A, Dao T. Mamba: linear-time sequence modeling with selective state spaces. ArXiv. 2023 abs/2312.00752
25. Xu B, Lu Y, Inoue Y, Lee N, Fu T, Chen J. Protein-mamba: biological mamba models for protein function prediction. arXiv preprint arXiv:2409.14617. 2024
26. Qu L, Liu S, Liu X, Wang M, Song Z. Towards label-efficient automatic diagnosis and analysis: a comprehensive survey of advanced deep learning-based weakly-supervised, semi-supervised and self-supervised techniques in histopathological image analysis. Phys Med Biol. 2022 67 (20)
27. Khan A, Asmatullah L, Malik A, Khan S, Asif H. A survey on self-supervised contrastive learning for multimodal text-image analysis. arXiv preprint arXiv:2503.11101. 2025
28. Zeng D, Wu Y, Hu X, Xu X, Shi Y. Contrastive learning with synthetic positives. ArXiv. 2024 abs/2408.16965
29. Xu Z, Dai Y, Liu F, Wu B, Chen W, Shi L. Swin MoCo: improving parotid gland MRI segmentation using contrastive learning. Med Phys. 2024;51(8):5295-307
30. Reinecke D, Maarouf N, Smith A, Alber D, Markert J, Goff NK. et al. Fast intraoperative detection of primary central nervous system lymphoma and differentiation from common central nervous system tumors using stimulated raman histology and deep learning. Neuro Oncol. 2025;27(5):1297-310
31. Liao W, He Y, Jiang B, Zhao J, Gao M, Zhang X. HistoMoCo: momentum contrastive learning pre-training on unlabeled histopathological images for oral squamous cell carcinoma detection. Electronics (Basel). 2025;14(7):1252
32. Boissin C, Wang Y, Sharma A, Weitz P, Karlsson E, Robertson S. et al. Deep learning-based risk stratification of preoperative breast biopsies using digital whole slide images. Breast Cancer Res. 2024;26(1):90
33. Tsafas V, Oikonomidis I, Gavgiotaki E, Tzamali E, Tzedakis G, Fotakis C. et al. Application of a deep-learning technique to non-linear images from human tissue biopsies for shedding new light on breast cancer diagnosis. IEEE J Biomed Health Inform. 2022;26(3):1188-95
34. Nagpal K, Foote D, Tan F, Liu Y, Chen PC, Steiner DF. et al. Development and validation of a deep learning algorithm for gleason grading of prostate cancer from biopsy specimens. JAMA Oncol. 2020;6(9):1372-80
35. Bulten W, Pinckaers H, van Boven H, Vink R, de Bel T, van Ginneken B. et al. Automated deep-learning system for gleason grading of prostate cancer using biopsies: a diagnostic study. Lancet Oncol. 2020;21(2):233-41
36. Kondejkar T, Al-Heejawi SMA, Breggia A, Ahmad B, Christman R, Ryan ST. et al. Multi-scale digital pathology patch-level prostate cancer grading using deep learning: use case evaluation of DiagSet dataset. Bioengineering (Basel). 2024 11 (6)
37. Su F, Li J, Zhao X, Wang B, Hu Y, Sun Y. et al. Interpretable tumor differentiation grade and microsatellite instability recognition in gastric cancer using deep learning. Lab Invest. 2022;102(6):641-9
38. Wei W, Zhang X, Wang H, Wang L, Wen J, Han X. et al. Application of deep learning models in the pathological classification and staging of esophageal cancer: a focus on wave-vision transformer. World J Gastroenterol. 2025;31(19):104897
39. Liu X, Sun T, Chen H, Wu S, Cheng H, Liu X. et al. A multicenter study on intraoperative glioma grading via deep learning on cryosection pathology. Mod Pathol. 2025;38(7):100749
40. Zehra T, Anjum S, Mahmood T, Shams M, Sultan BA, Ahmad Z. et al. A novel deep learning-based mitosis recognition approach and dataset for uterine leiomyosarcoma histopathology. Cancers (Basel). 2022 14 (15)
41. Coudray N, Ocampo PS, Sakellaropoulos T, Narula N, Snuderl M, Fenyö D. et al. Classification and mutation prediction from non-small cell lung cancer histopathology images using deep learning. Nat Med. 2018;24(10):1559-67
42. Haq AU, Li JP, Khan I, Agbley BLY, Ahmad S, Uddin MI. et al. DEBCM: deep learning-based enhanced breast invasive ductal carcinoma classification model in IoMT healthcare systems. IEEE J Biomed Health Inform. 2024;28(3):1207-17
43. Sirinukunwattana K, Domingo E, Richman SD, Redmond KL, Blake A, Verrill C. et al. Image-based consensus molecular subtype (imCMS) classification of colorectal cancer using deep learning. Gut. 2021;70(3):544-54
44. Cheng N, Ren Y, Zhou J, Zhang Y, Wang D, Zhang X. et al. Deep learning-based classification of hepatocellular nodular lesions on whole-slide histopathologic images. Gastroenterology. 2022;162(7):1948-61
45. Marostica E, Barber R, Denize T, Kohane IS, Signoretti S, Golden JA. et al. Development of a histopathology informatics pipeline for classification and prediction of clinical outcomes in subtypes of renal cell carcinoma. Clin Cancer Res. 2021;27(10):2868-78
46. Shi L, Shen L, Jian J, Xia W, Yang K, Tian Y. et al. Contribution of whole slide imaging-based deep learning in the assessment of intraoperative and postoperative sections in neuropathology. Brain Pathol. 2023;33(4):e13160
47. Roetzer-Pejrimovsky T, Nenning K, Kiesel B, Klughammer J, Rajchl M, Baumann B. et al. Deep learning links localized digital pathology phenotypes with transcriptional subtype and patient outcome in glioblastoma. Gigascience. 2024 13
48. Tian C, Xi Y, Ma Y, Chen C, Wu C, Ru K. et al. Harnessing deep learning for accurate pathological assessment of brain tumor cell types. J Imaging Inform Med. 2025;38(2):1098-111
49. Lami K, Ota N, Yamaoka S, Bychkov A, Matsumoto K, Uegami W. et al. Standardized classification of lung adenocarcinoma subtypes and improvement of grading assessment through deep learning. Am J Pathol. 2023;193(12):2066-79
50. Arrieta Legorburu A, Bohoyo Bengoetxea J, Gracia C, Ferreres JC, Bella-Cueto MR, Araúzo-Bravo MJ. Automatic discrimination between neuroendocrine carcinomas and grade 3 neuroendocrine tumors by deep learning of h&e images. Comput Biol Med. 2025;184:109443
51. Dov D, Elliott Range D, Cohen J, Bell J, Rocke DJ, Kahmke RR. et al. Deep-learning-based screening and ancillary testing for thyroid cytopathology. Am J Pathol. 2023;193(9):1185-94
52. Foersch S, Eckstein M, Wagner D, Gach F, Woerl A, Geiger J. et al. Deep learning for diagnosis and survival prediction in soft tissue sarcoma. Ann Oncol. 2021;32(9):1178-87
53. Zhou Y, Koyuncu C, Lu C, Grobholz R, Katz I, Madabhushi A. et al. Multi-site cross-organ calibrated deep learning (MuSClD): automated diagnosis of non-melanoma skin cancer. Med Image Anal. 2023;84:102702
54. Shi Z, Zhu J, Yu L, Li X, Li J, Chen H. et al. A two-stage end-to-end deep learning framework for pathologic examination in skin tumor diagnosis. Am J Pathol. 2023;193(6):769-77
55. Ning X, Liu R, Wang N, Xiao X, Wu S, Wang Y. et al. Development of a deep learning-based model to diagnose mixed-type gastric cancer accurately. Int J Biochem Cell Biol. 2023;162:106452
56. Wang C, Liu T, Lai P, Muzakky H, Wang Y, Yu M. et al. Ensemble transformer-based multiple instance learning to predict pathological subtypes and tumor mutational burden from histopathological whole slide images of endometrial and colorectal cancer. Med Image Anal. 2025;99:103372
57. Reinecke D, Ruess D, Meissner A, Fürtjes G, von Spreckelsen N, Ion-Margineanu A. et al. Streamlined intraoperative brain tumor classification and molecular subtyping in stereotactic biopsies using stimulated raman histology and deep learning. Clin Cancer Res. 2024;30(17):3824-36
58. Ehteshami Bejnordi B, Veta M, Johannes Van Diest P, van Ginneken B, Karssemeijer N, Litjens G. et al. Diagnostic assessment of deep learning algorithms for detection of lymph node metastases in women with breast cancer. JAMA. 2017;318(22):2199-210
59. Hu Y, Su F, Dong K, Wang X, Zhao X, Jiang Y. et al. Deep learning system for lymph node quantification and metastatic cancer identification from whole-slide pathology images. Gastric Cancer. 2021;24(4):868-77
60. Jansen P, Baguer DO, Duschner N, Arrastia JL, Schmidt M, Landsberg J. et al. Deep learning detection of melanoma metastases in lymph nodes. Eur J Cancer. 2023;188:161-70
61. Chen S, Xiang J, Wang X, Zhang J, Yang S, Yang W. et al. Deep learning-based pathology signature could reveal lymph node status and act as a novel prognostic marker across multiple cancer types. Br J Cancer. 2023;129(1):46-53
62. Albrecht T, Rossberg A, Albrecht JD, Nicolay JP, Straub BK, Gerber TS. et al. Deep learning-enabled diagnosis of liver adenocarcinoma. Gastroenterology. 2023;165(5):1262-75
63. Kriegsmann M, Kriegsmann K, Steinbuss G, Zgorzelski C, Albrecht T, Heinrich S. et al. Implementation of deep learning in liver pathology optimizes diagnosis of benign lesions and adenocarcinoma metastasis. Clin Transl Med. 2023;13(7):e1299
64. Muti HS, Röcken C, Behrens H, Löffler CML, Reitsam NG, Grosser B. et al. Deep learning trained on lymph node status predicts outcome from gastric cancer histopathology: a retrospective multicentric study. Eur J Cancer. 2023;194:113335
65. Wang W, Liang H, Zhang Z, Xu C, Wei D, Li W. et al. Comparing three-dimensional and two-dimensional deep-learning, radiomics, and fusion models for predicting occult lymph node metastasis in laryngeal squamous cell carcinoma based on CT imaging: a multicentre, retrospective, diagnostic study. EClinicalMedicine. 2024;67:102385
66. Zhou L, Zeng S, Xu J, Lv W, Mei D, Tu J. et al. Deep learning predicts cervical lymph node metastasis in clinically node-negative papillary thyroid carcinoma. Insights Imaging. 2023;14(1):222
67. Matsushima J, Sato T, Ohnishi T, Yoshimura Y, Mizutani H, Koto S. et al. The use of deep learning-based computer diagnostic algorithm for detection of lymph node metastases of gastric adenocarcinoma. Int J Surg Pathol. 2023;31(6):975-81
68. Xia L, Xu T, Zheng Y, Li B, Ao Y, Li X. et al. Lymph node metastasis prediction from in situ lung squamous cell carcinoma histopathology images using deep learning. Lab Invest. 2025;105(1):102187
69. Kazemi A, Shiri ME, Sheikhahmadi A, Khodamoradi M. Classifying tumor brain images using parallel deep learning algorithms. Comput Biol Med. 2022;148:105775
70. Dénes-Fazakas L, Kovács L, Eigner G, Szilágyi L. Enhancing brain tumor diagnosis with l-net: a novel deep learning approach for MRI image segmentation and classification. Biomedicines. 2024 12 (10)
71. Rasool N, Wani NA, Bhat JI, Saharan S, Sharma VK, Alsulami BS. et al. CNN-TumorNet: leveraging explainability in deep learning for precise brain tumor diagnosis on MRI images. Front Oncol. 2025;15:1554559
72. Naser MA, Deen MJ. Brain tumor segmentation and grading of lower-grade glioma using deep learning in MRI images. Comput Biol Med. 2020;121:103758
73. Garcia-Ruiz A, Pons-Escoda A, Grussu F, Naval-Baudin P, Monreal-Aguero C, Hermann G. et al. An accessible deep learning tool for voxel-wise classification of brain malignancies from perfusion MRI. Cell Rep Med. 2024;5(3):101464
74. Li R, Guo Y, Zhao Z, Chen M, Liu X, Gong G. et al. MRI-based two-stage deep learning model for automatic detection and segmentation of brain metastases. Eur Radiol. 2023;33(5):3521-31
75. Kim M, Kim HS, Kim HJ, Park JE, Park SY, Kim Y. et al. Thin-slice pituitary MRI with deep learning-based reconstruction: diagnostic performance in a postoperative setting. Radiology. 2021;298(1):114-22
76. Li Y, Zhuo Z, Weng J, Haller S, Bai HX, Li B. et al. A deep learning model for differentiating paediatric intracranial germ cell tumour subtypes and predicting survival with MRI: a multicentre prospective study. BMC Med. 2024;22(1):375
77. Shin H, Park JE, Jun Y, Eo T, Lee J, Kim JE. et al. Deep learning referral suggestion and tumour discrimination using explainable artificial intelligence applied to multiparametric MRI. Eur Radiol. 2023;33(8):5859-70
78. Witowski J, Heacock L, Reig B, Kang SK, Lewin A, Pysarenko K. et al. Improving breast cancer diagnostics with deep learning for MRI. Sci Transl Med. 2022;14(664):eabo4802
79. Khosravi P, Lysandrou M, Eljalby M, Li Q, Kazemi E, Zisimopoulos P. et al. A deep learning approach to diagnostic classification of prostate cancer using pathology-radiology fusion. J Magn Reson Imaging. 2021;54(2):462-71
80. Bhattacharya I, Seetharaman A, Kunder C, Shao W, Chen LC, Soerensen SJC. et al. Selective identification and localization of indolent and aggressive prostate cancers via CorrSigNIA: an MRI-pathology correlation and deep learning framework. Med Image Anal. 2022;75:102288
81. Ye L, Miao X, Cai W, Xu W. Medical image diagnosis of prostate tumor based on PSP-net+VGG16 deep learning network. Comput Methods Programs Biomed. 2022;221:106770
82. Lan T, Kuang S, Liang P, Ning C, Li Q, Wang L. et al. MRI-based deep learning and radiomics for prediction of occult cervical lymph node metastasis and prognosis in early-stage oral and oropharyngeal squamous cell carcinoma: a diagnostic study. Int J Surg. 2024;110(8):4648-59
83. Eweje FR, Bao B, Wu J, Dalal D, Liao W, He Y. et al. Deep learning for classification of bone lesions on routine MRI. EBioMedicine. 2021;68:103402
84. Wang S, Sun M, Sun J, Wang Q, Wang G, Wang X. et al. Advancing musculoskeletal tumor diagnosis: automated segmentation and predictive classification using deep learning and radiomics. Comput Biol Med. 2024;175:108502
85. Spaanderman DJ, Hakkesteegt SN, Hanff DF, Schut ARW, Schiphouwer LM, Vos M. et al. Multi-center external validation of an automated method segmenting and differentiating atypical lipomatous tumors from lipomas using radiomics and deep-learning on MRI. EClinicalMedicine. 2024;76:102802
86. Park Y, Choi D, Choi JY, Hyun SH. Performance evaluation of a deep learning system for differential diagnosis of lung cancer with conventional CT and FDG PET/CT using transfer learning and metadata. Clin Nucl Med. 2021;46(8):635-40
87. Wesp P, Grosu S, Graser A, Maurus S, Schulz C, Knösel T. et al. Deep learning in CT colonography: differentiating premalignant from benign colorectal polyps. Eur Radiol. 2022;32(7):4749-59
88. Wei Y, Yang M, Zhang M, Gao F, Zhang N, Hu F. et al. Focal liver lesion diagnosis with deep learning and multistage CT imaging. Nat Commun. 2024;15(1):7040
89. Gao R, Zhao S, Aishanjiang K, Cai H, Wei T, Zhang Y. et al. Deep learning for differential diagnosis of malignant hepatic tumors based on multi-phase contrast-enhanced CT and clinical data. J Hematol Oncol. 2021;14(1):154
90. Balaguer-Montero M, Marcos Morales A, Ligero M, Zatse C, Leiva D, Atlagich LM. et al. A CT-based deep learning-driven tool for automatic liver tumor detection and delineation in patients with cancer. Cell Rep Med. 2025;6(4):102032
91. Chen P, Wu T, Wang P, Chang D, Liu K, Wu M. et al. Pancreatic cancer detection on CT scans with deep learning: a nationwide population-based study. Radiology. 2023;306(1):172-82
92. Zheng G, Zhang H, Lin F, Zafereo M, Gross N, Sun P. et al. Performance of CT-based deep learning in diagnostic assessment of suspicious lateral lymph nodes in papillary thyroid cancer: a prospective diagnostic study. Int J Surg. 2023;109(11):3337-45
93. Xu X, Xi L, Wei L, Wu L, Xu Y, Liu B. et al. Deep learning assisted contrast-enhanced CT-based diagnosis of cervical lymph node metastasis of oral cancer: a retrospective study of 1466 cases. Eur Radiol. 2023;33(6):4303-12
94. Yu Q, Ning Y, Wang A, Li S, Gu J, Li Q. et al. Deep learning-assisted diagnosis of benign and malignant parotid tumors based on contrast-enhanced CT: a multicenter study. Eur Radiol. 2023;33(9):6054-65
95. Chen C, Wang Y, Niu J, Liu X, Li Q, Gong X. Domain knowledge powered deep learning for breast cancer diagnosis based on contrast-enhanced ultrasound videos. IEEE Trans Med Imaging. 2021;40(9):2439-51
96. Li Y, Liu Y, Huang L, Wang Z, Luo J. Deep weakly-supervised breast tumor segmentation in ultrasound images with explicit anatomical constraints. Med Image Anal. 2022;76:102315
97. Zheng X, Yao Z, Huang Y, Yu Y, Wang Y, Liu Y. et al. Deep learning radiomics can predict axillary lymph node status in early-stage breast cancer. Nat Commun. 2020;11(1):1236
98. Wang X, Nie L, Zhu Q, Zuo Z, Liu G, Sun Q. et al. Artificial intelligence assisted ultrasound for the non-invasive prediction of axillary lymph node metastasis in breast cancer. BMC Cancer. 2024;24(1):910
99. Tian G, Xu D, He Y, Chai W, Deng Z, Cheng C. et al. Deep learning for real-time auxiliary diagnosis of pancreatic cancer in endoscopic ultrasonography. Front Oncol. 2022;12:973652
100. Gao Y, Zeng S, Xu X, Li H, Yao S, Song K. et al. Deep learning-enabled pelvic ultrasound images for accurate diagnosis of ovarian cancer in china: a retrospective, multicentre, diagnostic study. Lancet Digit Health. 2022;4(3):e179-87
101. Long B, Zhang H, Zhang H, Chen W, Sun Y, Tang R. et al. Deep learning models of ultrasonography significantly improved the differential diagnosis performance for superficial soft-tissue masses: a retrospective multicenter study. BMC Med. 2023;21(1):405
102. Lee JH, Lee D, Lu MT, Raghu VK, Park CM, Goo JM. et al. Deep learning to optimize candidate selection for lung cancer CT screening: advancing the 2021 USPSTF recommendations. Radiology. 2022;305(1):209-18
103. Horry M, Chakraborty S, Pradhan B, Paul M, Gomes D, Ul-Haq A. et al. Deep mining generation of lung cancer malignancy models from chest x-ray images. Sensors (Basel). 2021 21 (19)
104. Al-Antari MA, Han S, Kim T. Evaluation of deep learning detection and classification towards computer-aided diagnosis of breast lesions in digital x-ray mammograms. Comput Methods Programs Biomed. 2020;196:105584
105. Xu Z, Niu K, Tang S, Song T, Rong Y, Guo W. et al. Bone tumor necrosis rate detection in few-shot x-rays based on deep learning. Comput Med Imaging Graph. 2022;102:102141
106. Wang Y, Chang Y, Chen J, Han M, Hu J, Hu J. et al. Consensus on the monitoring, treatment, and prevention of leukaemia relapse after allogeneic haematopoietic stem cell transplantation in china: 2024 update. Cancer Lett. 2024;605:217264
107. Matek C, Krappe S, Münzenmayer C, Haferlach T, Marr C. Highly accurate differentiation of bone marrow cell morphologies using deep neural networks on a large image data set. Blood. 2021;138(20):1917-27
108. Sun S, Yin Z, Van Cleave JG, Wang L, Fried B, Bilal KH. et al. DeepHeme, a high-performance, generalizable deep ensemble for bone marrow morphometry and hematologic diagnosis. Sci Transl Med. 2025;17(802):eadq2162
109. Zhang ZC, Shi ZZ, Zhou D, Dang XM, Guo XY, Hi L. Differential diagnosis of multiple myeloma and systemic light chain amyloidosis using plasma cell morphology based on deep learning. Blood. 2024;144:3348-9
110. Eckardt J, Middeke JM, Riechert S, Schmittmann T, Sulaiman AS, Kramer M. et al. Deep learning detects acute myeloid leukemia and predicts NPM1 mutation status from bone marrow smears. Leukemia. 2022;36(1):111-8
111. Rastogi P, Khanna K, Singh V. LeuFeatx: deep learning-based feature extractor for the diagnosis of acute leukemia from microscopic images of peripheral blood smear. Comput Biol Med. 2022;142:105236
112. Sun X, Shi A, Liu JM, Liu J, Gong Y, Hu Z. Abstract b031: artificial intelligence-enhanced image analysis of peripheral blood smears supports the diagnosis and monitoring of acute promyelocytic leukemia. Clin Cancer Res. 2025;31(13_Supplement):B031
113. Kimura K, Tabe Y, Ai T, Takehara I, Fukuda H, Takahashi H. et al. A novel automated image analysis system using deep convolutional neural networks can assist to differentiate MDS and AA. Sci Rep. 2019;9(1):13385
114. Hehr M, Sadafi A, Matek C, Lienemann P, Pohlkamp C, Haferlach T. et al. Explainable AI identifies diagnostic cells of genetic AML subtypes. PLOS Digit Health. 2023;2(3):e0000187
115. Sidhom J, Siddarthan IJ, Lai B, Luo A, Hambley BC, Bynum J. et al. Deep learning for diagnosis of acute promyelocytic leukemia via recognition of genomically imprinted morphologic features. NPJ Precis Oncol. 2021;5(1):38
116. Chen S, Zhang K, Hu J, Li N, Xu A, Li H. et al. KaryoXpert: an accurate chromosome segmentation and classification framework for karyotyping analysis without training with manually labeled metaphase-image mask annotations. Comput Biol Med. 2024;177:108601
117. Pravalphruekul N, Tangpornpisit T, Limtoprasert W, Phengphon C, Hinthong W, Herabutya P, et al. Detecting philadelphia chromosome on metaphase images using a convolutional neural network 2020 1st International Conference on Big Data Analytics and Practices (IBDAP); 2020: 1-6
118. Yan J, Tucci E, Jaffe N. Detection of t(9;22) chromosome translocation using deep residual neural network. Journal of Computer and Communications. 2019;7(12):102-11
119. Wang J, Xia C, Fan Y, Jiang L, Yang G, Chen Z. et al. An integral r-banded karyotype analysis system of bone marrow metaphases based on deep learning. Arch Pathol Lab Med. 2024;148(8):905-13
120. Xia C, Wang J, You X, Fan Y, Chen B, Chen S. et al. ChromTR: chromosome detection in raw metaphase cell images via deformable transformers. Front Med. 2024;18(6):1100-14
121. Bechar MEA, Guyader J, El Bouz M, Douet-Guilbert N, Al Falou A, Troadec M. Highly performing automatic detection of structural chromosomal abnormalities using siamese architecture. J Mol Biol. 2023;435(8):168045
122. Cox A, Park C, Koduru P, Wilson K, Weinberg O, Chen W. et al. Automated classification of cytogenetic abnormalities in hematolymphoid neoplasms. Bioinformatics. 2022;38(5):1420-6
123. Uzolas L, Rico J, Coupé P, Sanmiguel JC, Cserey G. Deep anomaly generation: an image translation approach of synthesizing abnormal banded chromosome images. IEEE Access. 2022;10:59090-8
124. Blampey Q, Bercovici N, Dutertre C, Pic I, Ribeiro JM, André F. et al. A biology-driven deep generative model for cell-type annotation in cytometry. Brief Bioinform. 2023 24 (5)
125. Wödlinger M, Reiter M, Weijler L, Maurer-Granofszky M, Schumich A, Sajaroff EO. et al. Automated identification of cell populations in flow cytometry data with transformers. Comput Biol Med. 2022;144:105314
126. Cheng F, Lo S, Lin C, Lo W, Chien S, Sun T. et al. Deep learning assists in acute leukemia detection and cell classification via flow cytometry using the acute leukemia orientation tube. Sci Rep. 2024;14(1):8350
127. Zhao M, Mallesh N, Höllein A, Schabath R, Haferlach C, Haferlach T. et al. Hematologist-level classification of mature b-cell neoplasm using deep learning on multiparameter flow cytometry data. Cytometry A. 2020;97(10):1073-80
128. Vora N, Shekar P, Esmail M, Patra A, Georgakoudi I. Deep learning-enabled, detection of rare circulating tumor cell clusters in whole blood using label-free, flow cytometry. bioRxiv. 2023
129. Wei J, Wang L, Zhou Z, Zhuo L, Zeng X, Fu X. et al. BloodPatrol: revolutionizing blood cancer diagnosis - advanced real-time detection leveraging deep learning & cloud technologies. IEEE J Biomed Health Inform. 2024 PP
130. Otesteanu CF, Ugrinic M, Holzner G, Chang Y, Fassnacht C, Guenova E. et al. A weakly supervised deep learning approach for label-free imaging flow-cytometry-based blood diagnostics. Cell Rep Methods. 2021;1(6):100094
131. Hybel TE, Jensen SH, Rodrigues MA, Hybel TE, Pedersen MN, Qvick SH. et al. Imaging flow cytometry and convolutional neural network-based classification enable discrimination of hematopoietic and leukemic stem cells in acute myeloid leukemia. Int J Mol Sci. 2024 25 (12)
132. Xin L, Xiao X, Xiao W, Peng R, Wang H, Pan F. Screening for urothelial carcinoma cells in urine based on digital holographic flow cytometry through machine learning and deep learning methods. Lab Chip. 2024;24(10):2736-46
133. Dong A, Lu Y, Lu B. Genomic/epigenomic alterations in ovarian carcinoma: translational insight into clinical practice. J Cancer. 2016;7(11):1441-51
134. Kaczmarek E, Pyman B, Nanayakkara J, Tuschl T, Tyryshkin K, Renwick N. et al. Discriminating neoplastic from nonneoplastic tissues using an miRNA-based deep cancer classifier. Am J Pathol. 2022;192(2):344-52
135. Borah K, Das HS, Budhathoki RK, Aurangzeb K, Mallik S. DOMSCNet: a deep learning model for the classification of stomach cancer using multi-layer omics data. Brief Bioinform. 2025 26 (2)
136. Li J, Wei L, Zhang X, Zhang W, Wang H, Zhong B. et al. DISMIR: deep learning-based noninvasive cancer detection by integrating DNA sequence and methylation information of individual cell-free DNA reads. Brief Bioinform. 2021 22 (6)
137. Christensen MH, Drue SO, Rasmussen MH, Frydendahl A, Lyskjær I, Demuth C. et al. DREAMS: deep read-level error model for sequencing data applied to low-frequency variant calling and circulating tumor DNA detection. Genome Biol. 2023;24(1):99
138. Ziegler J, Hechtman JF, Rana S, Ptashkin RN, Jayakumaran G, Middha S. et al. A deep multiple instance learning framework improves microsatellite instability detection from tumor next generation sequencing. Nat Commun. 2025;16(1):136
139. Yaqoob A, Verma NK, Aziz RM, Shah MA. RNA-seq analysis for breast cancer detection: a study on paired tissue samples using hybrid optimization and deep learning techniques. J Cancer Res Clin Oncol. 2024;150(10):455
140. Zhao X, Chen Z, Wang H, Sun H. Occlusion enhanced pan-cancer classification via deep learning. BMC Bioinformatics. 2024;25(1):260
141. Xie Y, Yang J, Ouyang JF, Petretto E. Scpanel: a tool for automatic identification of sparse gene panels for generalizable patient classification using scRNA-seq datasets. Brief Bioinform. 2024 25 (6)
142. Li B, Nabavi S. A multimodal graph neural network framework for cancer molecular subtype classification. BMC Bioinformatics. 2024;25(1):27
143. Feng S, Wang Z, Jin Y, Xu S. TabDEG: classifying differentially expressed genes from RNA-seq data based on feature extraction and deep learning framework. PLoS One. 2024;19(7):e0305857
144. Sokač M, Kjær A, Dyrskjøt L, Haibe-Kains B, Jwl Aerts H, Birkbak NJ. Spatial transformation of multi-omics data unlocks novel insights into cancer biology. Elife. 2023 12
145. Chen J, Wang X, Ma A, Wang Q, Liu B, Li L. et al. Deep transfer learning of cancer drug responses by integrating bulk and single-cell RNA-seq data. Nat Commun. 2022;13(1):6494
146. Liao J, Qian J, Fang Y, Chen Z, Zhuang X, Zhang N. et al. De novo analysis of bulk RNA-seq data at spatially resolved single-cell resolution. Nat Commun. 2022;13(1):6498
147. Yeh S, Chen B. Systems medicine design based on systems biology approaches and deep neural network for gastric cancer. IEEE/ACM Trans Comput Biol Bioinform. 2022;19(5):3019-31
148. Park S, Huang E, Ahn T. Classification and functional analysis between cancer and normal tissues using explainable pathway deep learning through RNA-sequencing gene expression. Int J Mol Sci. 2021 22 (21)
149. Yang R, Jiang M, Zhao J, Chen H, Gong J, You Y. et al. Identification of chromosomal abnormalities and genomic features in near-triploidy/tetraploidy-acute leukemia by fluorescence in situ hybridization. Cancer Manag Res. 2019;11:1559-67
150. Wang C, Chu K, Su T, Liu K, Lin Y, Chao T. Automated quantification of HER2 amplification levels using deep learning. IEEE J Biomed Health Inform. 2025;29(1):333-44
151. Zakrzewski F, de Back W, Weigert M, Wenke T, Zeugner S, Mantey R. et al. Automated detection of the HER2 gene amplification status in fluorescence in situ hybridization images for the diagnostics of cancer tissues. Sci Rep. 2019;9(1):8231
152. Höfener H, Homeyer A, Förster M, Drieschner N, Schildhaus H, Hahn HK. Automated density-based counting of FISH amplification signals for HER2 status assessment. Comput Methods Programs Biomed. 2019;173:77-85
153. Niu Z, O'Farrell A, Li J, Reffsin S, Jain N, Dardani I. et al. Piscis: a novel loss estimator of the f1 score enables accurate spot detection in fluorescence microscopy images via deep learning. bioRxiv. 2025
154. Frankenstein Z, Uraoka N, Aypar U, Aryeequaye R, Rao M, Hameed M. et al. Automated 3d scoring of fluorescence in situ hybridization (FISH) using a confocal whole slide imaging scanner. Appl Microsc. 2021;51(1):4
155. Xu H, Lv R. Rapid diagnosis of lung cancer by multi-modal spectral data combined with deep learning. Spectrochim Acta A Mol Biomol Spectrosc. 2025;335:125997
156. Huang R, Lin Z, Dou H, Wang J, Miao J, Zhou G. et al. AW3m: an auto-weighting and recovery framework for breast cancer diagnosis using multi-modal ultrasound. Med Image Anal. 2021;72:102137
157. Khan RA, Fu M, Burbridge B, Luo Y, Wu F. A multi-modal deep neural network for multi-class liver cancer diagnosis. Neural Netw. 2023;165:553-61
158. Guo J, Bu R, Shen W, Feng T. Towards robust multimodal ultrasound classification for liver tumor diagnosis: a generative approach to modality missingness. Comput Methods Programs Biomed. 2025;265:108759
159. Wu C, Wang C, Zhou H, Zhang Y, Wang Q, Wang Y. et al. MMFusion: multi-modality diffusion model for lymph node metastasis diagnosis in esophageal cancer. In: Linguraru MG, Dou Q, Feragen A, et al, eds. Cham: Springer Nature Switzerland. 2024:469-79
160. Wu Y, Liu Y, Yang Y, Yao MS, Yang W, Shi X. et al. A concept-based interpretable model for the diagnosis of choroid neoplasias using multimodal data. Nat Commun. 2025;16(1):3504
161. Xing X, Chen Z, Hou Y, Yuan Y. Gradient modulated contrastive distillation of low-rank multi-modal knowledge for disease diagnosis. Med Image Anal. 2023;88:102874
162. Yang M, Zhao Y, Li C, Weng X, Li Z, Guo W. et al. Multimodal integration of liquid biopsy and radiology for the noninvasive diagnosis of gallbladder cancer and benign disorders. Cancer Cell. 2025;43(3):398-412
163. Chen G, Tsoi A, Xu H, Zheng WJ. Predict effective drug combination by deep belief network and ontology fingerprints. J Biomed Inform. 2018;85:149-54
164. Preuer K, Lewis RPI, Hochreiter S, Bender A, Bulusu KC, Klambauer G. DeepSynergy: predicting anti-cancer drug synergy with deep learning. Bioinformatics. 2018;34(9):1538-46
165. Wang J, Liu X, Shen S, Deng L, Liu H. DeepDDS: deep graph neural network with attention mechanism to predict synergistic drug combinations. Brief Bioinform. 2022 23 (1)
166. Zhang T, Zhang L, Payne PRO, Li F. Synergistic drug combination prediction by integrating multiomics data in deep learning models. Methods Mol Biol. 2021;2194:223-38
167. Sun Z, Huang S, Jiang P, Hu P. DTF: deep tensor factorization for predicting anticancer drug synergy. Bioinformatics. 2020;36(16):4483-9
168. Liu X, Song C, Liu S, Li M, Zhou X, Zhang W. Multi-way relation-enhanced hypergraph representation learning for anti-cancer drug synergy prediction. Bioinformatics. 2022;38(20):4782-9
169. Lou B, Doken S, Zhuang T, Wingerter D, Gidwani M, Mistry N. et al. An image-based deep learning framework for individualizing radiotherapy dose. Lancet Digit Health. 2019;1(3):e136-47
170. Pu G, Jiang S, Yang Z, Hu Y, Liu Z. Deep reinforcement learning for treatment planning in high-dose-rate cervical brachytherapy. Phys Med. 2022;94:1-7
171. Yuan Z, Wang Y, Hu P, Zhang D, Yan B, Lu H. et al. Accelerate treatment planning process using deep learning generated fluence maps for cervical cancer radiation therapy. Med Phys. 2022;49(4):2631-41
172. Elhaminia B, Gilbert A, Scarsbrook A, Lilley J, Appelt A, Gooya A. Deep learning combining imaging, dose and clinical data for predicting bowel toxicity after pelvic radiotherapy. Phys Imaging Radiat Oncol. 2025;33:100710
173. de Vette SPM, Neh H, van der Hoek L, Macrae DC, Chu H, Gawryszuk A. et al. Deep learning NTCP model for late dysphagia after radiotherapy for head and neck cancer patients based on 3d dose, CT and segmentations. Radiother Oncol. 2025;213:111169
174. Wei L, Aryal MP, Cuneo K, Matuszak M, Lawrence TS, Ten Haken RK. et al. Deep learning prediction of post-SBRT liver function changes and NTCP modeling in hepatocellular carcinoma based on DGAE-MRI. Med Phys. 2023;50(9):5597-608
175. Hüllermeier E, Waegeman W. Aleatoric and epistemic uncertainty in machine learning: an introduction to concepts and methods. Mach Learn. 2021;110(3):457-506
176. Kendall A, Gal Y. What uncertainties do we need in bayesian deep learning for computer vision? Adv Neural Inf Process Syst. 2017 30
177. Maruccio FC, Eppinga W, Laves M, Navarro RF, Salvi M, Molinari F. et al. Clinical assessment of deep learning-based uncertainty maps in lung cancer segmentation. Phys Med Biol. 2024 69 (3)
178. Eriksson O, Zhang T. Robust automated radiation therapy treatment planning using scenario-specific dose prediction and robust dose mimicking. Med Phys. 2022;49(6):3564-73
179. Smolders A, Bengtsson I, Forsgren A, Lomax A, Weber DC, Fredriksson A. et al. Robust optimization strategies for contour uncertainties in online adaptive radiation therapy. Phys Med Biol. 2024 69 (16)
180. Mikalsen SG, Skjøtskift T, Flote VG, Hämäläinen NP, Heydari M, Rydén-Eilertsen K. Extensive clinical testing of deep learning segmentation models for thorax and breast cancer radiotherapy planning. Acta Oncol. 2023;62(10):1184-93
181. Cha E, Elguindi S, Onochie I, Gorovets D, Deasy JO, Zelefsky M. et al. Clinical implementation of deep learning contour autosegmentation for prostate radiotherapy. Radiother Oncol. 2021;159:1-7
182. Zhu L, Rong Y, Yu NY, Holmes JM, Vargas CE, James SE. et al. Establishing prospective performance monitoring for real-world implementation of deep learning-based auto-segmentation in prostate cancer radiotherapy. Phys Imaging Radiat Oncol. 2025;36:100886
183. Zhou Y, Zhang Y, Zhao D, Yu X, Shen X, Zhou Y. et al. TTD: therapeutic target database describing target druggability information. Nucleic Acids Res. 2024;52(D1):D1465-77
184. Wang T, Shao W, Huang Z, Tang H, Zhang J, Ding Z. et al. MOGONET integrates multi-omics data using graph convolutional networks allowing patient classification and biomarker identification. Nat Commun. 2021;12(1):3445
185. López-Cortés A, Cabrera-Andrade A, Vázquez-Naya JM, Pazos A, Gonzáles-Díaz H, Paz-Y-Miño C. et al. Prediction of breast cancer proteins involved in immunotherapy, metastasis, and RNA-binding using molecular descriptors and artificial neural networks. Sci Rep. 2020;10(1):8515
186. Gomes R, Paul N, He N, Huber AF, Jansen RJ. Application of feature selection and deep learning for cancer prediction using DNA methylation markers. Genes (Basel). 2022 13 (9)
187. Zeng Z, Mao C, Vo A, Li X, Nugent JO, Khan SA. et al. Deep learning for cancer type classification and driver gene identification. BMC Bioinformatics. 2021;22(Suppl 4):491
188. Xu W, Zhang H, Zhang R, Zhong X, Li X, Zhou W. et al. Deep learning model based on contrast-enhanced ultrasound for predicting vessels encapsulating tumor clusters in hepatocellular carcinoma. Eur Radiol. 2025;35(2):989-1000
189. Yu Y, Cao L, Shen B, Du M, Gu W, Gu C. et al. Deep learning radiopathomics models based on contrast-enhanced MRI and pathologic imaging for predicting vessels encapsulating tumor clusters and prognosis in hepatocellular carcinoma. Radiol Imaging Cancer. 2025;7(2):e240213
190. Liu W, Li L, Deng J, Li W. A comprehensive approach for evaluating lymphovascular invasion in invasive breast cancer: leveraging multimodal MRI findings, radiomics, and deep learning analysis of intra- and peritumoral regions. Comput Med Imaging Graph. 2024;116:102415
191. Bergstrom EN, Abbasi A, Díaz-Gay M, Galland L, Ladoire S, Lippman SM. et al. Deep learning artificial intelligence predicts homologous recombination deficiency and platinum response from histologic slides. J Clin Oncol. 2024;42(30):3550-60
192. Gamble P, Jaroensri R, Wang H, Tan F, Moran M, Brown T. et al. Determining breast cancer biomarker status and associated morphological features using deep learning. Commun Med (Lond). 2021;1:14
193. Zhang B, Yao K, Xu M, Wu J, Cheng C. Deep learning predicts EBV status in gastric cancer based on spatial patterns of lymphocyte infiltration. Cancers (Basel). 2021 13 (23)
194. Ha R, Chin C, Karcich J, Liu MZ, Chang P, Mutasa S. et al. Prior to initiation of chemotherapy, can we predict breast tumor response? Deep learning convolutional neural networks approach using a breast MRI tumor dataset. J Digit Imaging. 2019;32(5):693-701
195. Qu Y, Zhu H, Cao K, Li X, Ye M, Sun Y. Prediction of pathological complete response to neoadjuvant chemotherapy in breast cancer using a deep learning (DL) method. Thorac Cancer. 2020;11(3):651-8
196. Li Z, Gao J, Zhou H, Li X, Zheng T, Lin F. et al. Multiregional dynamic contrast-enhanced MRI-based integrated system for predicting pathological complete response of axillary lymph node to neoadjuvant chemotherapy in breast cancer: multicentre study. EBioMedicine. 2024;107:105311
197. Ahn B, Moon D, Kim H, Lee C, Cho NH, Choi H. et al. Histopathologic image-based deep learning classifier for predicting platinum-based treatment responses in high-grade serous ovarian cancer. Nat Commun. 2024;15(1):4253
198. Rui R, Zhou L, He S. Cancer immunotherapies: advances and bottlenecks. Front Immunol. 2023;14:1212476
199. Jiang Y, Zhang Z, Wang W, Huang W, Chen C, Xi S. et al. Biology-guided deep learning predicts prognosis and cancer immunotherapy response. Nat Commun. 2023;14(1):5135
200. Foersch S, Glasner C, Woerl A, Eckstein M, Wagner D, Schulz S. et al. Multistain deep learning for prediction of prognosis and therapy response in colorectal cancer. Nat Med. 2023;29(2):430-9
201. Park C, Na KJ, Choi H, Ock C, Ha S, Kim M. et al. Tumor immune profiles noninvasively estimated by FDG PET with deep learning correlate with immunotherapy response in lung adenocarcinoma. Theranostics. 2020;10(23):10838-48
202. Jiang Y, Zhou K, Sun Z, Wang H, Xie J, Zhang T. et al. Non-invasive tumor microenvironment evaluation and treatment response prediction in gastric cancer using deep learning radiomics. Cell Rep Med. 2023;4(8):101146
203. Hoang D, Dinstag G, Shulman ED, Hermida LC, Ben-Zvi DS, Elis E. et al. A deep-learning framework to predict cancer treatment response from histopathology images through imputed transcriptomics. Nat Cancer. 2024;5(9):1305-17
204. Ye G, Wu G, Qi Y, Li K, Wang M, Zhang C. et al. Non-invasive multimodal CT deep learning biomarker to predict pathological complete response of non-small cell lung cancer following neoadjuvant immunochemotherapy: a multicenter study. J Immunother Cancer. 2024 12 (9)
205. She Y, He B, Wang F, Zhong Y, Wang T, Liu Z. et al. Deep learning for predicting major pathological response to neoadjuvant chemoimmunotherapy in non-small cell lung cancer: a multicentre study. EBioMedicine. 2022;86:104364
206. Delgado A, Guddati AK. Clinical endpoints in oncology - a primer. Am J Cancer Res. 2021;11(4):1121-31
207. Poirion OB, Jing Z, Chaudhary K, Huang S, Garmire LX. DeepProg: an ensemble of deep-learning and machine-learning models for prognosis prediction using multi-omics data. Genome Med. 2021;13(1):112
208. Wang R, Dai W, Gong J, Huang M, Hu T, Li H. et al. Development of a novel combined nomogram model integrating deep learning-pathomics, radiomics and immunoscore to predict postoperative outcome of colorectal cancer lung metastasis patients. J Hematol Oncol. 2022;15(1):11
209. Hou J, Jia X, Xie Y, Qin W. Integrative histology-genomic analysis predicts hepatocellular carcinoma prognosis using deep learning. Genes (Basel). 2022 13 (10)
210. Oh S, Im J, Kang S, Oh I, Kim M. PET-based deep-learning model for predicting prognosis of patients with non-small cell lung cancer. IEEE Access. 2021;9:138753-61
211. Wei Z, Xv Y, Liu H, Li Y, Yin S, Xie Y. et al. A CT-based deep learning model predicts overall survival in patients with muscle invasive bladder cancer after radical cystectomy: a multicenter retrospective cohort study. Int J Surg. 2024;110(5):2922-32
212. Song AH, Williams M, Williamson DFK, Chow SSL, Jaume G, Gao G. et al. Analysis of 3d pathology samples using weakly supervised AI. Cell. 2024;187(10):2502-20
213. Shi J, Wang X, Ding G, Dong Z, Han J, Guan Z. et al. Exploring prognostic indicators in the pathological images of hepatocellular carcinoma based on deep learning. Gut. 2021;70(5):951-61
214. Wang K, Xiang Y, Yan J, Zhu Y, Chen H, Yu H. et al. A deep learning model with incorporation of microvascular invasion area as a factor in predicting prognosis of hepatocellular carcinoma after r0 hepatectomy. Hepatol Int. 2022;16(5):1188-98
215. Mahootiha M, Tak D, Ye Z, Zapaishchykova A, Likitlersuang J, Climent Pardo JC. et al. Multimodal deep learning improves recurrence risk prediction in pediatric low-grade gliomas. Neuro Oncol. 2025;27(1):277-90
216. Li Z, Chen W, Zhong H, Liang C. PCLSurv: a prototypical contrastive learning-based multi-omics data integration model for cancer survival prediction. Brief Bioinform. 2025 26 (2)
217. Chen S, Gao F, Guo T, Jiang L, Zhang N, Wang X. et al. Deep learning-based multi-model prediction for disease-free survival status of patients with clear cell renal cell carcinoma after surgery: a multicenter cohort study. Int J Surg. 2024;110(5):2970-7
218. Xv Y, Wei Z, Jiang Q, Zhang X, Chen Y, Xiao B. et al. Three-dimensional deep learning model complements existing models for preoperative disease-free survival prediction in localized clear cell renal cell carcinoma: a multicenter retrospective cohort study. Int J Surg. 2024;110(11):7034-46
219. Guo J, Miao J, Sun W, Li Y, Nie P, Xu W. Predicting bone metastasis-free survival in non-small cell lung cancer from preoperative CT via deep learning. NPJ Precis Oncol. 2024;8(1):161
220. Xu Y, Hosny A, Zeleznik R, Parmar C, Coroller T, Franco I. et al. Deep learning predicts lung cancer treatment response from serial medical imaging. Clin Cancer Res. 2019;25(11):3266-75
221. Zheng Y, Wang F, Zhang W, Li Y, Yang B, Yang X. et al. Preoperative CT-based deep learning model for predicting overall survival in patients with high-grade serous ovarian cancer. Front Oncol. 2022;12:986089
222. Zheng S, Guo J, Langendijk JA, Both S, Veldhuis RNJ, Oudkerk M. et al. Survival prediction for stage i-IIIA non-small cell lung cancer using deep learning. Radiother Oncol. 2023;180:109483
223. Qiu B, Zheng Y, Liu S, Song R, Wu L, Lu C. et al. Multitask deep learning based on longitudinal CT images facilitates prediction of lymph node metastasis and survival in chemotherapy-treated gastric cancer. Cancer Res. 2025;85(13):2527-36
224. Xu Y, Li B, Zou B, Fan B, Wang S, Yu J. et al. Deep learning for survival prediction in triple-negative breast cancer: development and validation in real-world cohorts. Sci Rep. 2025;15(1):30248
225. Wang W, Yang G, Liu Y, Wei L, Xu X, Zhang C. et al. Multimodal deep learning model for prognostic prediction in cervical cancer receiving definitive radiotherapy: a multi-center study. NPJ Digit Med. 2025;8(1):503
226. Huang K, Mo Z, Zhu W, Liao B, Yang Y, Wu F. Prediction of target-drug therapy by identifying gene mutations in lung cancer with histopathological stained image and deep learning techniques. Front Oncol. 2021;11:642945
227. Amidi E, Ramzanpour M, Chen M, Boucher T, Varma M, Samec T. et al. Predicting ROS1 and ALK fusions in NSCLC from h&e slides with a two-step vision transformer approach. NPJ Precis Oncol. 2025;9(1):266
228. Bian C, Wang Y, Lu Z, An Y, Wang H, Kong L. et al. ImmunoAIzer: a deep learning-based computational framework to characterize cell distribution and gene mutation in tumor microenvironment. Cancers (Basel). 2021 13 (7)
229. Gustav M, van Treeck M, Reitsam NG, Carrero ZI, Loeffler CML, Rabasco Meneghetti A. et al. Assessing genotype-phenotype correlations in colorectal cancer with deep learning: a multicentre cohort study. Lancet Digit Health. 2025;7(8):100891
230. Berloco F, Zaccaria GM, Altini N, Colucci S, Bevilacqua V. A multimodal framework for assessing the link between pathomics, transcriptomics, and pancreatic cancer mutations. Comput Med Imaging Graph. 2025;123:102526
231. Wei B, Tsai XC, Sun K, Lo M, Hung S, Chou W. et al. Annotation-free deep learning for predicting gene mutations from whole slide images of acute myeloid leukemia. NPJ Precis Oncol. 2025;9(1):35
232. Wang C, Xu X, Shao J, Zhou K, Zhao K, He Y. et al. Deep learning to predict EGFR mutation and PD-l1 expression status in non-small-cell lung cancer on computed tomography images. J Oncol. 2021;2021:5499385
233. Song K, Zhao Z, Ma Y, Wang J, Wu W, Qiang Y. et al. A multitask dual-stream attention network for the identification of KRAS mutation in colorectal cancer. Med Phys. 2022;49(1):254-70
234. Ma Y, Wang J, Song K, Qiang Y, Jiao X, Zhao J. Spatial-frequency dual-branch attention model for determining KRAS mutation status in colorectal cancer with t2-weighted MRI. Comput Methods Programs Biomed. 2021;209:106311
235. Ma Y, Guo Y, Cui W, Liu J, Li Y, Wang Y. et al. SG-transunet: a segmentation-guided transformer u-net model for KRAS gene mutation status identification in colorectal cancer. Comput Biol Med. 2024;173:108293
236. Chen X, Lin X, Shen Q, Qian X. Combined spiral transformation and model-driven multi-modal deep learning scheme for automatic prediction of TP53 mutation in pancreatic cancer. IEEE Trans Med Imaging. 2021;40(2):735-47
237. Bernett J, Blumenthal DB, Grimm DG, Haselbeck F, Joeres R, Kalinina OV. et al. Guiding questions to avoid data leakage in biological machine learning applications. Nat Methods. 2024;21(8):1444-53
238. Young VM, Gates S, Garcia LY, Salardini A. Data leakage in deep learning for alzheimer's disease diagnosis: a scoping review of methodological rigor and performance inflation. Diagnostics (Basel). 2025 15 (18)
239. Yang H, Celi LA, Lee H, Park S, Lee S, Jung C. et al. The effect of selection bias on the performance of a deep learning-based intraoperative hypotension prediction model using real-world samples from a publicly available database. Br J Anaesth. 2025;135(3):571-81
240. Russ AJ, Weber SM, Rettammel RJ, Mahvi DM, Rikkers LF, Cho CS. Impact of selection bias on the utilization of adjuvant therapy for pancreas adenocarcinoma. Ann Surg Oncol. 2010;17(2):371-6
241. Glesby MJ, Hoover DR. Survivor treatment selection bias in observational studies: examples from the AIDS literature. Ann Intern Med. 1996;124(11):999-1005
242. Samala RK, Chan H, Hadjiiski LM, Helvie MA, Richter CD. Generalization error analysis for deep convolutional neural network with transfer learning in breast cancer diagnosis. Phys Med Biol. 2020;65(10):105002
243. Rakaee M, Tafavvoghi M, Ricciuti B, Alessi JV, Cortellini A, Citarella F. et al. Deep learning model for predicting immunotherapy response in advanced non-small cell lung cancer. JAMA Oncol. 2025;11(2):109-18
244. Dong D, Fang M, Tang L, Shan X, Gao J, Giganti F. et al. Deep learning radiomic nomogram can predict the number of lymph node metastasis in locally advanced gastric cancer: an international multicenter study. Ann Oncol. 2020;31(7):912-20
245. Dong X, Jia X, Zhang W, Zhang J, Xu H, Xu L. et al. Interpretable and generalizable deep learning model for preoperative assessment of microvascular invasion and outcome in hepatocellular carcinoma based on MRI: a multicenter study. Insights Imaging. 2025;16(1):151
Author contact
Corresponding authors: Cheng Zhang, Email: chzhang2014edu.cn; Xiangui Peng, Email: Pxg1964com, pxgpxg1964edu.cn; Xi Zhang, Email: zhangxxicom, zhangxiedu.cn.