Impact Factor ISSN: 1449-2288




Int J Biol Sci 2027; 23(1):255-269. doi:10.7150/ijbs.133831 This issue Cite
Research Paper
Activin A directs porcine embryonic stem cell commitment to extraembryonic endoderm lineage
Hanning Wang1,*,  , Liang Zhong3,*, Xiaofeng Yan1, Kaipeng Wang1, Chengchen Zhao1, Jinzhu Xiang1, , Duanqing Pei1,2,
1. Laboratory of Cell Fate Control, School of Life Sciences, Westlake University, Hangzhou, 310030, China.
2. Westlake Laboratory of Life Sciences and Biomedicine, Hangzhou, 310030, China.
3. Hebei Provincial Key Laboratory of Basic Medicine for Diabetes, The Shijiazhuang Second Hospital, Shijiazhuang, 050051, China.
* These authors contributed equally to this work.
Received 2026-3-3; Accepted 2026-7-31; Published 2027-1-1
Abstract
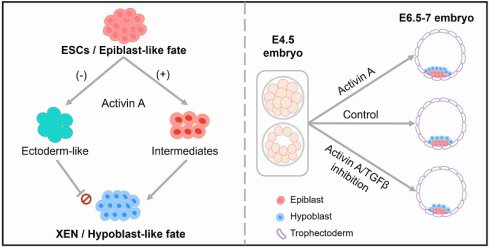
The porcine extraembryonic endoderm (XEN) plays a critical role in early embryogenesis. Although functionally conserved, the pig exhibits species-specific regulatory networks compared to rodents and humans, making it an effective model for investigating evolutionary dynamics and translational potential of mammalian extraembryonic development. Porcine stem cell models, including embryonic stem cells (ESCs) and XEN, provide valuable tools for dissecting embryonic and extraembryonic lineage specification in large mammals. However, how signals govern hypoblast lineage formation remains poorly defined in pigs. Here, we show that Activin A is indispensable for acquiring XEN potential from porcine ESCs, actively suppressing ectodermal priming during lineage transition. Activin A and FGF signaling act synergistically to drive efficient XEN specification. Additionally, FGF2 can rescue the ESC-to-XEN transition impaired by Activin A deficiency. During porcine early embryo development, Activin A promotes hypoblast formation. Our study uncovers, for the first time, a positive regulatory role of Activin A in hypoblast formation in pigs, providing a robust platform to investigate lineage segregation in livestock species. These findings open new avenues for comparative and evolutionary studies of embryogenesis.
Introduction
Pigs serve as a highly relevant preclinical model for human diseases and organ regeneration due to their genetic, physiological, and anatomical similarities with humans[1]. During embryogenesis, a fertilized zygote undergoes a series of cell divisions and compaction to form the blastocyst, which consists of the epiblast, hypoblast (or primitive endoderm in mice), and trophectoderm. Porcine inner cell mass (ICM) and trophectoderm are specified at 5 days post-fertilization (dpf)[2]. The epiblast and hypoblast specification from ICM then occurs at 6 dpf[2]. Given that the epiblast differentiates into the embryo proper and the hypoblast specifies the yolk sac lineage[3, 4], elucidating the progression of cell lineage determination is critical for understanding early embryonic development.
Signaling pathways regulating early embryonic development exhibit evolutionary conservation across different species, yet species-specific signaling emerges in the molecular mechanisms governing lineage segregation and specification[5]. For example, in the epiblast, PI3K-Akt signaling targets such as ITGA5 are upregulated in humans and monkeys, but downregulated in pigs[6]. Compared to the mouse, human, and monkey, the rapidly developing conceptus elongation is unique to the pig[2]. In post-trophectoderm, genes including IL1B, FGF4, and FGFR2 regulating embryo elongation are upregulated in pigs, but not in monkeys[6]. BMP ligands, including BMP2, BMP4, and BMP6, are expressed in the human hypoblast. In macaque, BMP2 and BMP4 are enriched in the extraembryonic mesenchyme, whereas in mice, BMP4 and BMP8B are restricted to the extraembryonic ectoderm, and BMP2 is specifically enriched in the visceral endoderm[5]. Additionally, MAPK/ERK kinase inhibition using low-dose PD0325901 abolishes hypoblast formation in mice[7] and rabbits[8], but does not suppress hypoblast marker expression in humans[9], pigs[10], and cattle[9]. Conversely, high-dose PD0325901 reduces hypoblast cell numbers in humans[11] and pigs[3]. Transforming growth factor beta (TGFβ) family members, particularly Activin A, are critical regulators of early embryogenesis. In humans, Activin A treatment (25 ng/mL) decreases trophectoderm cell numbers without affecting epiblast or hypoblast cell lineage[5]. In contrast to the human, Activin A promotes trophectoderm formation in mice (500 ng/mL) and bovine (25 ng/mL) and suppresses epiblast development[12, 13]. However, the role of Activin A in porcine lineage specification remains undefined.
As in vitro stem cell models of epiblasts and hypoblasts, embryonic stem cells (ESCs) and extraembryonic endoderm (XEN) cells are valuable tools to study cell fate specification in early embryonic development. In our previous study, we established the 4FIXY medium to derive porcine ESCs[14] and developed an efficient method and culture conditions to directly generate porcine XEN cells from ESCs without gene editing[15]. Inhibition of Wnt signaling safeguards porcine ESCs from acquiring XEN fate. During the transition of XEN cells from ESCs, the withdrawal of Wnt inhibitors results in the increased XEN lineage potential. How other factors affect the fate of porcine ESCs and XEN cells remains unresolved. Signaling pathways involved in porcine hypoblast specification have not been properly described. Here, we identify a window for Activin A signaling for porcine hypoblast lineage specification and elucidate the in vitro porcine ESC-to-XEN transition trajectory. Our findings facilitate understanding the relationship between porcine embryonic and extraembryonic lineages and learning of their development.
Material and Methods
Animal treatment and ethics statements
All animal experiments were approved by the Animal Care and Use Committee of Westlake University (AP#25-105-PDQ).
Establishing and culturing porcine ESCs and XEN cells
The porcine ESCs from parthenogenetic blastocysts were generated according to the previous report[14]. The porcine XEN cells were transformed from ESCs[15]. The porcine ESCs and XEN cells were maintained on mitomycin C-treated mouse embryonic fibroblast cells and cultured in 4FIXY and 2FYSC medium, respectively. They were dissociated as single cells by TrypLETM Express (38.5 ℃, 5 min), centrifuged (250g, 5 min), and seeded in their respective culture medium. Cells were cultured at 38.5 ℃, 5% O2, and 5% CO2.
For FGF2-induced ESC-to-XEN transition, about 7,500 single cells per well (1.6×10³ cells/cm2) were directly seeded into a 24-well plate under 4FIXY medium for 1 day. Then, the medium was replaced with the 3FY+FGF2 medium. After the cells reached about 80% confluence on days 3, they were dissociated with TrypleTM Express into single cells and passaged to a new feeder cell-coated 24-well plate at a 1:2-1:3 split ratio. The cells were maintained in the 2FYSC medium. Porcine XEN cells derived from ESCs were passaged at a ratio of 1:3 and cultured at 38.5 °C, 5% O2, and 5% CO2.
The 2FYSC medium[15] was composed of 1:1 (v/v) mix of Neurobasal medium (Gibco, 21103049) and DMEM/F12 (Gibco, 10565018) supplemented with N2 (Gibco, 17502048) and B27 (Gibco, 17504044) supplements, penicillin/streptomycin (Gibco, 15140122), NEAA (Gibco, 11140050), GlutaMAX (Gibco, 35050061), 5% KOSR, 100 μM 2-mercaptoethanol (Sigma, M3148), 50 ng/mL human EGF (Peprotech, AF-100-15), 20 ng/mL human FGF-basic (Peprotech, 100-18B), 50 µg/mL 2-Phospho-L-ascorbic acid trisodium salt (Sigma, 49752), 10 μM Y-27632 (TargetMol, T1725), 1 μM SB431542 (Selleck, S1067), and 2 μM CHIR99021 (Tocris, 4423).
The 4FIXY medium[15] was composed of 1:1 (v/v) mix of Neurobasal medium and DMEM/F12 supplemented with N2 and B27 supplements, penicillin/streptomycin, NEAA, GlutaMAX, 5% KOSR, 0.15% FBS (Gibco, 10099141C), 100 μM 2-mercaptoethanol, 20 ng/mL human IL-6 (Peprotech, AF-200-06), 20 ng/mL human sIL-6 Receptor α (Peprotech, 200-06RC), 20 ng/mL Activin A (Peprotech, 120-14-1000), 50 ng/mL human IGF1 (MCE, HY-P7018), 2.5 μM XAV939 (Selleck, S1108), 2.5 μM IWR1 (Selleck, S7086), 50 µg/mL 2-Phospho-L-ascorbic acid trisodium salt and 5 μM Y-27632.
The 4FY medium was the 4FIXY medium minus XAV939 and IWR1. The 3FY medium was the 4FY medium minus Activin A. Unless otherwise specified, Activin A and FGF2 were both used at 20 ng/mL to treat cells. 1 μM SB431542 was used in 3FY+SB431542, 4FY+SB431542, 3FY+FGF2+SB431542. 2 μM SB431542 was used in 4FY+FGF2+SB431542. PD0325901 and PD173074 were used at 1 μM to treat cells. 2 μM A83-01 was used in 4FY+A83-01.
EB formation
XEN cells were digested into single cells and plated to ultra-low attachment well plates in EB medium for about one week. Cells were cultured at 38.5 ℃, 5% O2, and 5% CO2. The EB medium was composed of 1:1 (v/v) mix of Neurobasal medium and DMEM/F12 with N2 and B27 supplements, NEAA, penicillin/streptomycin, GlutaMAX, 5% KOSR, 100 μM 2-mercaptoethanol, and 10 μM Y-27632.
RNA extraction and real-time quantitative PCR
Total RNA was extracted using RNA-easy Isolation Reagent (Vazyme, R701). Reverse transcription was performed using HiScript II Q RT SuperMix (Vazyme, R222). Real-time quantitative PCR reactions were performed using ChamQ SYBR Color qPCR Master Mix (Vazyme, Q411) and run on CFX96 Touch Real-Time PCR Detection System (BIO-RAD). Relative expression values were normalized to EF1α. Primers in this study are shown in Supplementary Table S1.
Porcine embryo derivation and treatment
The porcine parthenogenetic embryos were generated according to the previous report[14]. Embryos were incubated in PZM-3 culture medium up to E4.5 and in N2B27 medium supplemented with the following cytokines and inhibitors: 500 ng/mL Activin A, 250 ng/mL FGF2, 50 μM SB431542, and 10 μM PD0325901. For the cytokine treatment, equal amounts of BSA were added to the N2B27 medium as a control. Inhibitors were dissolved in DMSO, and the control groups were treated with DMSO accordingly. After 52-56 h treatment, E6.5-7 blastocysts were collected for the immunofluorescent staining. Additionally, porcine embryos were treated with SB431542 (10 μM) and A83-01 (10 μM and 20 μM) from morula to late blastocyst for about 66 hours and then collected for the immunofluorescent staining. The N2B27 medium[3] was composed of Advanced DMEM/F-12 supplemented with N2 and B27 supplements and 0.3% fatty acid free BSA (Sigma, SRE0098).
Immunofluorescent staining
Cells and embryos were fixed with 4% paraformaldehyde for about 60 min at room temperature, washed in PBS, and permeabilized with 0.2% Triton X-100 in PBS for 20 min. Samples were then blocked with the blocking buffer at room temperature for about 45 min. Cells were incubated in primary antibodies overnight at 4℃, washed three times for 5 minutes with PBS, and incubated with fluorescent-dye conjugated secondary antibodies diluted in secondary antibody dilution buffer for 1 h at room temperature. Finally, samples were washed three times with PBS and counterstained with DAPI at room temperature for about 3 min. Primary antibodies are as follows: anti-SOX17 (AF1924, R&D), anti-GATA6 (5851, Cell Signaling Technology), anti-GATA4 (sc-25310, Santa Cruz Biotechnology), anti-SOX2 (MAB2018, R&D), anti-GATA3 (5852, Cell Signaling Technology), and anti-PAX6 (ET1612-89, HUABIO). Embryos were imaged in a glass slide under a coverslip.
Flow cytometry
Porcine ESCs were genetically engineered with SOX17-tdTomato to generate the fluorescence reporter cell lines[15]. Cells were digested into single cells by Tryple TM Express, suspended in DPBS, and analyzed by flow cytometry (Beckman Coulter, CytoFLEX SRT).
Bulk RNA-sequencing (RNA-Seq) and analysis
About 1 µg RNA was used for constructing the library and sequenced on an Illumina Novaseq PE150 platform. Raw data were processed using Trim Galore; Clean reads were aligned to the Sus scrofa 11.1 reference genome with HISAT219, and the expression was calculated by featureCount[16] with Ensembl annotations (v112). To make a comparable analysis with previously published data, batch effects and other unwanted variations were removed in the expression data from PRJNA1208701[15] using sva[17]. Bulk RNA-Seq data of cells in 4FIXY and 4FY were collected[15]. Differentially expressed genes (DEGs) were identified using DESeq2[18]. The gene ontology (GO), KEGG enrichment, and gene set enrichment analysis (GSEA) were performed using clusterProfiler[19]. The plot was generated using R software (v.4.2.2) package“pheatmap”(v.1.0.12)[20] through Hiplot Pro (https://hiplot.com.cn/), a comprehensive web service for biomedical data analysis and visualization.
ATAC-Seq and analysis
About 105 cells were used for constructing the library using the Hyperactive ATAC-Seq Library Prep Kit for Illumina (Vazyme Biotech Co. Ltd, TD711). The initial quality of raw data was assessed using FastQC to evaluate sequencing quality and adapter contamination. The raw reads were trimmed for sequencing adapters using Trim Galore, and the clean reads were aligned to the Sus scrofa 11.1 reference using bwa[21]. Post-alignment, the resulting BAM files were sorted and deduplicated using samtools and picard. Normalized signal tracks were generated using deeptools (v3.5.5)[22] for downstream visualization and analysis. To analyze the differentially accessible regions (DARs) between samples, consensus peaks were merged with bedtools[23], and the count of peaks was calculated by featureCount[16]. Downstream DARs were performed with DESeq2[18]. HOMER[24] was used to annotate the peaks and perform the motif analysis. The GO enrichment analysis of genes located in DARs was performed using clusterProfiler[19]. The genomic view of DARs was generated by IGV[25]. ATAC-Seq data of cells in 4FIXY and 4FY were collected[15].
Single-cell RNA sequencing (scRNA-seq) library construction, sequencing, and analysis
DNBelab C Series High-throughput Single-Cell RNA Library Preparation Set was utilized for library preparation. Briefly, the single-cell suspensions were converted to barcoded scRNA-seq libraries. The cDNA production was sheared to short fragments with 300-500 bp, and indexed sequencing libraries were constructed according to the manufacturer's protocol. The sequencing reads contained 30-bp read 1 (including the 10-bp cell barcode 1, 10-bp cell barcode 2, and 10-bp unique molecular identifiers), 100-bp read 2 for gene sequences, and 10-bp barcodes read for sample index. Raw data analysis was performed using the DNBelab C Series HT scRNA analysis workflow (v2.1.3), which performs sequencing read alignment, aligned file manipulation, filtering, and feature counting with the genome of Sus scrofa 11.1 (ENSEMBL). Gene expressions were converted to a Seurat object using the Seurat v5 package (version 5.0.0)[26]. Cells were removed if they had >10,000 or fewer than 500 expressed genes or if over 10 to 25% of their UMIs were derived from the mitochondrial genome. Mitochondrial genes were identified with the AnnotationHub package using Sus scrofa ENSEMBL v112. After filtering, the gene expression matrices for each sample were log-normalized with a scale factor of 10,000, and the top 2000 variable features were identified. Immune system-related anchors were identified, and the three datasets were integrated. The data was then scaled, and linear dimension reduction was performed using uniform manifold approximation and projection (UMAP) for visualization. To delineate the dynamic transitions of cell states during differentiation or development, we performed single-cell pseudo-time trajectory analysis with seurat analyzed object. Two complementary computational approaches, Monocle3 (a reconstruction-based algorithm)[27] and Slingshot (a cluster-based minimum-path algorithm)[28], were employed to robustly infer differentiation trajectories and pseudotemporal ordering of cells. To integrate single-cell RNA sequencing data with bulk RNA-seq data, we first aggregated the single-cell data into pseudo-bulk RNA data based on cell type and clustering results. The Seurat package was used to convert the single-cell expression matrix into a pseudo-bulk expression matrix. To correct for batch effects and potential confounding factors in the data, the sva and harmony[29, 30] packages were employed for data correction.
Statistical analysis
The data were presented as the mean ± SD. The numbers of sample sizes for each experiment were indicated in the figure legend. For comparisons between two groups, an unpaired two-tailed Student's t-test was used to assess statistical significance. For comparisons among multiple groups, one-way ANOVA was applied. P-value < 0.05 is considered significant. * p<0.05; ** p<0.01; *** p<0.001; **** p<0.0001. GraphPad Prism 10 (GraphPad Software, Inc., USA) was used for the statistical analysis.
Results
Activin A is essential for acquiring the XEN potential from porcine ESCs
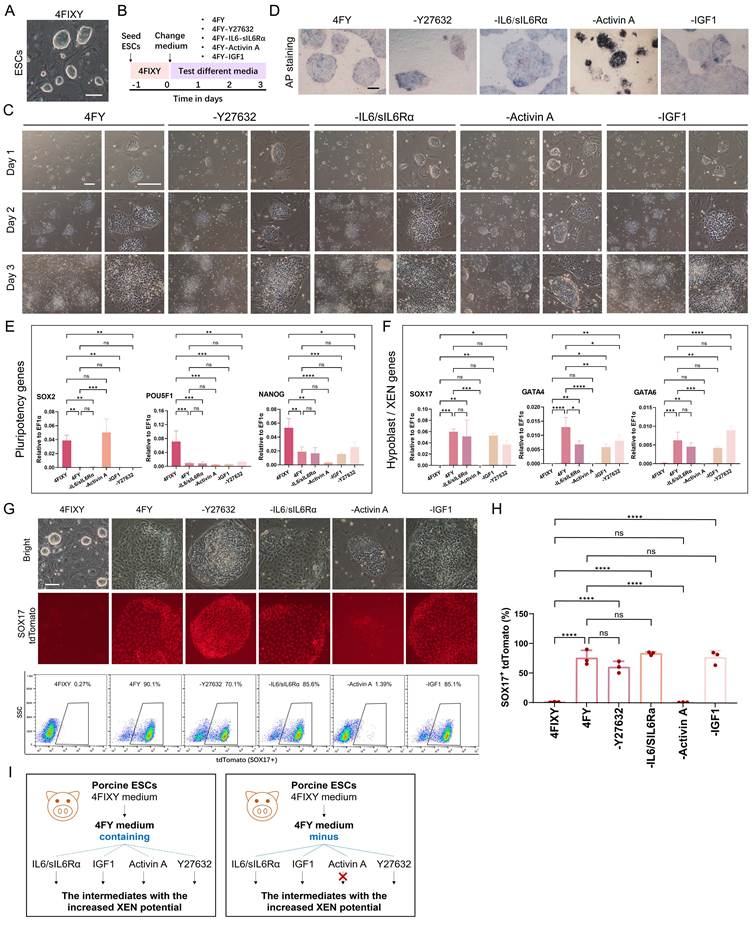
We recently established a two-way strategy to derive porcine XEN cells from ESCs[15]. Porcine ESCs cultured in the 4FIXY medium (Figure 1A) form the intermediates with the increased XEN potential in the 4FY medium. The intermediates further transform into stable XEN cells in the 2FYSC medium. To evaluate the impact of individual factors during the transition, we performed dropout experiments for each cytokine and chemical compound and showed that Activin A is absolutely required (Figure 1B). When removing Activin A in 4FY (called 3FY), cells exhibited morphological heterogeneity that differs from intermediates with the increased XEN potential in 4FY (Figure 1C). The alkaline phosphatase (AP) staining in 3FY was still positive, while other cells in 4FY, 4FY-Y27632, 4FY-IL6-sIl6Rα, and 4FY-IGF1 became negative (Figure 1D). Real-time quantitative PCR showed that the withdrawal of each cytokine or chemical compound down-regulated the pluripotency genes POU5F1 and NANOG (Figure 1E). The pluripotency gene SOX2 was not down-regulated in 3FY (Figure 1E). Hypoblast/XEN genes SOX17, GATA4, and GATA6 were not up-regulated in 3FY, while these genes were up-regulated in 4FY, 4FY-Y27632, 4FY-IL6/sIl6Rα, and 4FY-IGF1 (Figure 1F). Similarly, little SOX17-tdTomato expression was recorded when cultured in 3FY, which is distinct from cells cultured in 4FY, 4FY-Y27632, 4FY-IL6-sIl6Rα, and 4FY-IGF1(Figure 1G and H). These results indicate that the withdrawal of Activin A from the 4FY medium impedes the shift toward XEN fate (Figure 1I). Next, we generated XEN lineage intermediates in the medium containing 0, 5, 10, 20, and 50 ng/mL Activin A, the range where changes in SOX17-positive cells were pronounced. As the concentration of Activin A increased, so did the proportion of SOX17-positive cells (Figure S1), indicating that the effect of Activin A is concentration-dependent.
Activin A is required for the porcine ESC-to-XEN cell transition. A) Morphology of porcine ESCs in the 4FIXY medium. Scale bar, 100 μm. B) Schematic of testing different media during ESC-to-XEN cell transition. C) Morphology of cells during ESC-to-XEN cell transition. Scale bar, 200 μm. D) AP staining in different conditions. Scale bar, 200 μm. E) and F) Real-time quantitative PCR data of pluripotency markers (E) and hypoblast/XEN markers (F). The data are presented as the mean ± SD. n = 3. ns, no significance; * p<0.05; ** p<0.01; *** p<0.001; **** p<0.0001. The p-values were calculated using one-way ANOVA. G) Cell morphologies and flow cytometric analysis of SOX17-positive cells. Scale bar, 100 μm. H) Bar chart showing the SOX17 positive cells quantified by flow cytometry analysis as in (G). The data are presented as the mean ± SD. n = 3. ns, no significance; **** p<0.0001. The p-values were calculated using one-way ANOVA. I) Schematic showing the effects of small molecules and cytokines on ESC-to-XEN cell transition.
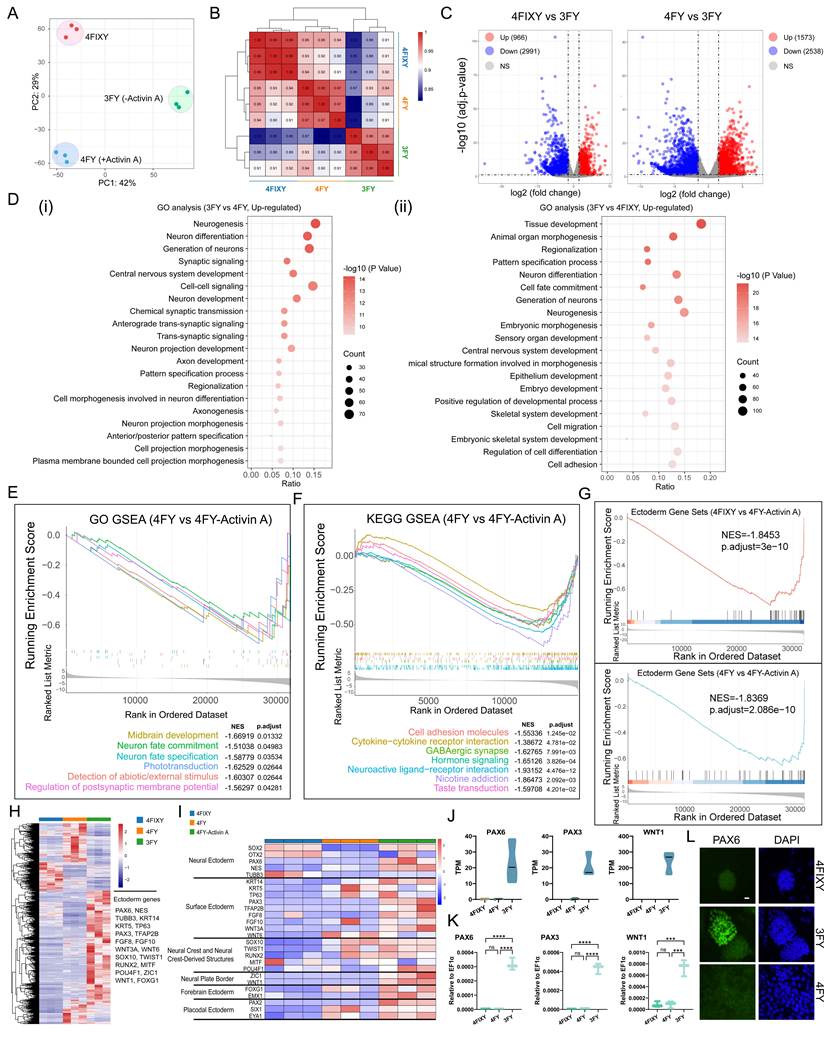
We then performed bulk RNA-Seq and analyzed the transcriptome. The principal component analysis (PCA) and Pearson correlation analysis revealed a distinct gene expression pattern among ESCs in 4FIXY[15], the intermediates with the increased XEN potential in 4FY[15], and cells in 4FY- Activin A (Figure 2A and B). The volcano plot showed 3957 DEGs between ESCs and cells in 3FY and 4111 DEGs between cells in 4FY and 3FY (Figure 2C). GSEA revealed a down-regulation of pluripotency genes in cells in 4FY and 3FY compared to ESCs in 4FIXY (Figure S2A). In detail, pluripotency genes including POU5F1, NANOG, and DNMT3B were down-regulated in 4FY and 3FY groups (Figure S2B). While SOX2 was only down-regulated in 4FY and still highly expressed in 3FY (Figure S2B and C), consistent with the real-time quantitative PCR data (Figure 1E). It has been reported that SOX2 is an early marker of neuroectodermal specification[31]. The down-regulation of pluripotency genes and the expression of SOX2 in 3FY hint that removing Activin A from the 4FY medium leads to the formation of ectoderm cell lineage. As our previous report described[15], cells in 4FY exhibit increased XEN lineage potential. We further tested the expression of hypoblast/XEN genes in distinct groups. The hypoblast/XEN genes, such as SOX17, GATA4, GATA6, HNF4A, and PDGFRA, were upregulated in 4FY, but not in 3FY (Figure S2D and E). By immunofluorescent staining, we did not detect the presence of hypoblast/XEN markers SOX17, GATA4, and GATA6 in 3FY (Figure S2F). These results indicate that the withdrawal of Activin A from the 4FY medium leads to the loss of pluripotency and does not contribute to XEN lineage transition, which differs from cells in 4FY.
Activin A inhibits the acquisition of the ectoderm lineage. A) PCA of bulk RNA-Seq data of 3FY, 4FIXY, and 4FYgroups. B) Correlation analysis among cells in 3FY, 4FIXY, and 4FYgroups. C) Volcano plots of DEGs between ESCs in 4FIXY, and cells in 4FY or 3FY for 3 days. log2 fold change > 1.5; adj. p < 0.05. D) GO analysis between 3FY and 4FIXY or 4FY. E) GSEA of GO functions between 4FY and 3FY. 4FY vs 3FY, NES<-1. NES, normalized enrichment score. F) GSEA of KEGG pathways between 4FY and 3FY. 4FY vs 3FY, NES<-1. G) GSEA of ectoderm-associated genes. H) Heatmap showing DEGs between 3FY and 4FIXY, 3FY and 4FY, and 4FIXY and 4FY. I) Heatmap indicating the expression of ectoderm genes. G) RNA-Seq expression (TPM values) of ectoderm genes. K) Real-time quantitative PCR showing the expression of ectoderm genes. n = 3. ns, no significance; ** p<0.01; **** p<0.0001. The p-values were calculated using one-way ANOVA. L) Immunofluorescent staining for ectoderm markers PAX6. Scale bar, 20 μm.
Activin A inhibits ectoderm lineage formation
To elucidate the fate of cells in 3FY, we first performed the GO analysis. Down-regulation of genes in 3FY was related to epithelium development, epithelial cell differentiation, and cell junction organization (Figure 2D). Up-regulated genes in 3FY were mainly associated with neuron differentiation, sensory organ development, generation of neurons, and neuron development, indicating the conversion of ectoderm lineage cells when removing Activin A from the 4FY medium (Figure 2D). GSEA highlighted significant enrichment in midbrain development, neuron fate commitment/specification, GABAergic synapse, Neuroactive ligand-receptor interaction, and taste transduction (Figure 2E and F). GSEA also showed an up-regulation of ectoderm genes in cells in 3FY (Figure 2G). Cells in 3FY expressed neural ectoderm genes (i.e., PAX6 and NES), surface ectoderm genes (i.e., KRT14, PAX3, and TFAP2B), neural crest and neural crest-derived structures-related genes (i.e., SOX10 and TWIST1), and placodal ectoderm genes (i.e., PAX2 and EYA1) (Figure 2K). By immunofluorescent staining, we detect the presence of ectoderm marker PAX6 in cells in 3FY but not in other groups (Figure 2L).
It has been reported that Activin A is a member of the TGF-β superfamily[32]. Next, we tested whether adding a TGF-β inhibitor could lead to the exit from pluripotency and potentially convert into ectoderm lineage cells (Figure S3A). With the addition of SB431542, a selective inhibitor of the TGF-β type I receptor, in 4FY and 3FY, cell morphologies and little SOX17-tdTomato expression were consistent with cells in 3FY (Figure S3B-D). Real-time quantitative PCR showed that the pluripotency genes POU5F1 and NANOG were down-regulated; hypoblast/XEN genes SOX17, GATA4, and GATA6 were not expressed; and ectoderm genes PAX6, PAX3, and WNT1 were up-regulated in 3FY, 3FY+SB431542, and 4FY+SB431542 (Figure S3E-G). Similar to cells in 3FY, cells in 3FY+SB431542 and 4FY+SB431542 expressed ectoderm protein PAX6 and did not express hypoblast/XEN-associated proteins, including GATA4 and GATA6 (Figure S3H). To validate TGFβ pathway specificity, we applied the distinct inhibitor A83-01 to treat cells. With the addition of A83-01 in 4FY, little SOX17-tdTomato expression were recorded (Figure S3I). Real-time quantitative PCR showed the downregulation of hypoblast/XEN genes SOX17, GATA4, and GATA6, and upregulation of ectoderm genes PAX6, PAX3, and WNT1 in 4FY+A83-01 (Figure S3J). Taken together, these results indicate that Activin A suppresses ectodermal priming during ESC-to-XEN transition.
Single-cell transcriptome analysis of conversion trajectory
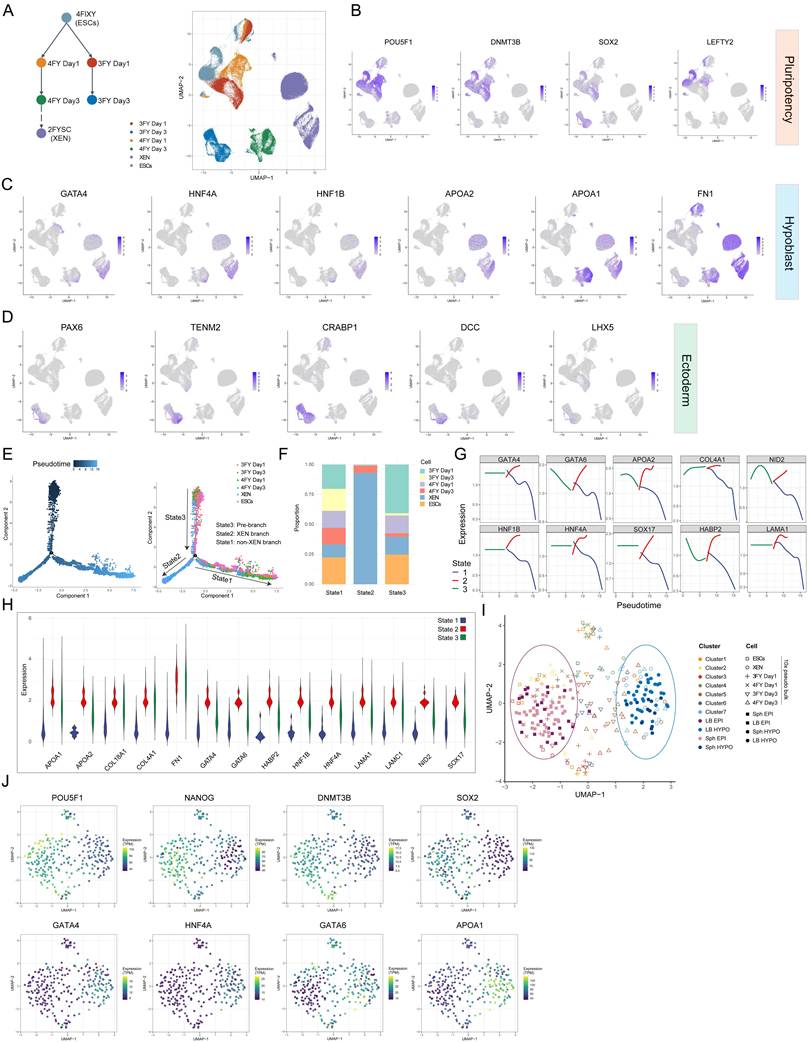
To investigate the role of Activin A in regulating the transition dynamics from porcine ESCs to XEN, we performed scRNA-seq. UMAP visualization showed a relatively continuous progression (Figure 3A). Downregulation of pluripotency genes (i.e., SOX2, POU5F1, DMNT3B, and LEFTY2) was reciprocal to upregulation of hypoblast genes (i.e., GATA4, HNF4A, HNF1B, and APOA2) in the vast majority of 4FY-cells and XEN cells (Figure 3B and C). To conform hypoblast identity, we took advantage of a porcine gastrulation scRNA-seq dataset to identify genes enriched in the hypoblast but exhibiting low or absent expression in definitive endoderm, such as APOA1, APOA2, and RBP4. These genes all show significant expression in XEN cells (Figure S4A). Additionally, UMAP analysis revealed that relatively few of the 3FY-cells expressed hypoblast genes. Instead, they specifically and highly expressed neuroectodermal genes PAX6[33], CRABP1[34], DCC[35], TENM2[36], and LHX5[37] (Figure 3D), suggesting the ESC-to-ectoderm lineage transition in 3FY. Next, we performed trajectory inference and pseudotime analysis to reconstruct cell lineage trajectories of biological processes. Cells were resolved into two main branches, representing the XEN branch (State 2) and the non-XEN branch (State 1) (Figure 3E). The XEN branch comprised XEN and 4FY-cells on day 3, with cells at this state exhibiting robust expression of hypoblast/XEN-related genes (Figure 3F-H) alongside minimal expression of pluripotency-associated genes (Figure S4B). In the absence of Activin A, 3FY-cells on day 1 were predominantly located in the pre-branch, and by day 3, most 3FY-cells were found in the non-XEN branch, indicating a failure to undergo the transition toward the XEN fate (Figure 3E and F). We also carried out integrated analysis with Smart-seq2 single-cell transcriptomes derived from porcine hypoblast and epiblast from late blastocyst (LB, E7-8) and spherical embryo (Sph, E10-11)[3]. To evaluate the temporal identity of ESCs, XEN, and intermediate cells, we performed pseudo bulk analysis on the 10 × single-cell RNA-seq data at a low and a high cluster resolution, to compensate for the differences in sequencing depth to Smart-seq2 data [38] (Figure 3I). ESCs and cells from 4FY and 3FY on day 1 were mapped closer to epiblast; XEN and 4FY-cells on day 3 mainly overlapped with hypoblast (Figure 3I and J). Cluster 7 was predominantly composed of XEN cells and 4FY-cells at day 3, displaying a gene expression profile consistent with in vivo hypoblast, including coordinated downregulation of pluripotency-associated genes and robust activation of hypoblast-specific markers (Figure S4C and D). In contrast, Clusters 1 and 2 were predominantly composed of ESCs and intermediate cells at day 1, exhibiting a gene expression profile that aligns with the in vivo epiblast (Figure S4C and D). Collectively, the single-cell transcriptome analysis reveals the porcine ESC-to-XEN transition and demonstrates that Activin A is necessary for the acquisition of XEN identity.
Single-cell analysis for cells during the ESC-to-XEN cell transition. A) UMAP visualization of scRNA-seq data from time courses, colored according to the sample. B) UMAP showing the expression of pluripotency genes. C) UMAP showing the expression of hypoblast-related genes. D) UMAP showing the expression of ectoderm-related genes. E) Trajectory reconstruction of all single cells throughout ESC-to-XEN transition. State3: Pre-branch. State 2: the XEN branch. State 1: the non-XEN branch. F) The cell proportion in individual state as shown in (E). G) Expression of hypoblast-related genes as a function of pseudo-time. H) Violin plot showing the expression of hypoblast-related genes in the top 10% of cells closest pseudotime from the terminal of each state. I) UMAP of pseudo bulk conversion of the data of ESCs, 4FY-cells on day1 and day3, 4FY-cells on day 1 and 3, XEN cells. LB: late blastocyst; Sph: spherical embryo; EPI: epiblast; HYPO: hypoblast. J) UMAP showing the expression of pluripotency genes (POU5F1, NANOG, DNMT3B, and SOX2) hypoblast-related genes (GATA4, HNF4A, GATA6, and APOA1).
Activin A promotes porcine XEN chromatin remodeling
To investigate how Activin A influences the chromatin accessibility landscape during the porcine ESC-to-XEN transition, we analyzed ATAC-seq data. PCA reveals the distinct trajectory for ESC-to-XEN cells with and without Activin A (Figure S5A and B). We then classified ATAC-seq peaks into five categories: closed in 4FIXY-ESCs but open in 3FY-cells (CO); open in 4FIXY-ESCs but closed in 3FY-cells (OC); closed in 4FIXY-ESCs and 3FY-cells but open in 4FY-cells (COC); open in 4FIXY-ESCs and 3FY-cells but closed in 4FY-cells (OCO); permanently open in all cells (PO) (Figure S5C and D). The CO and OC peaks were further divided into three subgroups (CO1-3 and OC1-3). The shared open loci (CO1, 3.07%) between 4FY- and 3FY-cells were fewer than the loci that were uniquely open (Figure S5E). Loci for hypoblast-related genes, including GATA4 and GATA6, were opened. Loci for hypoblast gene SOX17 exhibited chromatin opening during the transition from 4FIXY to 4FY medium, but remained closed in the 3FY medium (Figure S5F). Loci for neuron-associated genes, such as GFAP, ZIC1, and HOXA2[37], opened in 3FY but remained closed in both 4FIXY and 4FY media (Figure S5G). We further confirm the expression of these genes based on RNA-Seq data (Figure S5H and 2D). GO analysis showed that peaks open in 3FY-cells but closed in 4FY-cells (OCO, CO2, and CO3) were near genes involved in neuron differentiation, neurogenesis, generation of neurons, and central nervous system development (Figure S5J and K), indicating that Activin A inhibits ectoderm lineage differentiation, which is consistent with transcriptome data. Motif analysis revealed that OC1 loci were enriched with pluripotency transcription factors (TFs), such as OCT4 and SOX2 (Figure S5I), suggesting the pluripotency exit. COC loci were mainly enriched with hypoblast-related TFs (Figure S5I), including GATA4, GATA6, and SOX17, marking the Activin A-dependent XEN/hypoblast transition from porcine ESCs.
Activin A and FGF signaling synergistically modulate XEN specification
KEGG and Heatmap of RNA-seq data showed that, compared to 3FY-cells, the MAPK signaling pathway was the most enriched in 4FY-cells, and MAPK-related genes were up-regulated in 4FY-cells (Figure S2G and H). Notably, 4FY-cells highly expressed FGF2 and FGFR (Figure S2H). Next, we investigated the requirement of FGF signaling for porcine XEN specification (Figure 4A). Without Activin A (0 ng/mL), the addition of FGF2 in 3FY led to the SOX17-positive cells (71.1%), implying that FGF2 can trigger the XEN transition (Figure 4B-D). With a low dosage of Activin A (5 ng/mL), adding FGF2 in 4FYLow significantly increased the SOX17-positive cells (87.5%) compared to 4FYLow (23.1%) (Figure 4B-D). We analyzed the proportion of SOX17-positive cells in 4FY, 3FY+FGF2, and 4FY+FGF2 conditions, detecting approximately 82.7%, 71.6%, and 90.1% SOX17-positive cells, respectively (Figure 4E). These results suggest that FGF2 may substitute for Activin A to drive ESC-to-XEN transition.
Activin A and FGF2 orchestrate porcine XEN specification. A) Schematic of adding FGF2 in 4FY and 3FY during ESC-to-XEN cell transition. B) Morphology of cells in 3FY, 3FY+FGF2, 4FYLow, and 4FYLow+FGF2. Scale bar, 200 μm. C) The flow cytometric analysis of SOX17-positive cells in 3FY, 3FY+FGF2, 4FYLow, and 4FYLow+FGF2. D) Bar chart showing the SOX17-positive cells quantified by flow cytometry analysis as in (C). The data are presented as the mean ± SD. n = 3. *** p<0.001. The p-values were calculated using one-way ANOVA. E) Bar chart showing the SOX17-positive cells quantified by flow cytometry analysis in 4FY, 3FY+FGF2, and 4FY+FGF2. The data are presented as the mean ± SD. n = 3. ns, no significance; ** p<0.01; *** p<0.001. The p-values were calculated using one-way ANOVA. F) Schematic of adding FGF2, PD173074, PD0325901, and SB431542 in 4FY and 3FY during ESC-to-XEN cell transition. G) Morphology of cells in 3FY+FGF2, 3FY+FGF2+PD173074, and 3FY+FGF2+PD0325901. Scale bar, 100 μm. H) The flow cytometric analysis of SOX17-positive cells in 3FY+FGF2, 3FY+FGF2+PD173074, and 3FY+FGF2+PD0325901. I) Bar chart showing the SOX17 positive cells quantified by flow cytometry analysis shown in (H). The data are presented as the mean ± SD. n = 3. ns, no significance; **** p<0.0001. The p-values were calculated using one-way ANOVA. G) Morphology of cells in 3FY+FGF2 and 3FY+FGF2+SB421542. Scale bar, 100 μm. K) The flow cytometric analysis of SOX17-positive cells in 3FY+FGF2 and 3FY+FGF2+SB421542. L) Bar chart showing the SOX17 positive cells quantified by flow cytometry analysis shown in (K). The data are presented as the mean ± SD. n = 3. * p<0.05. The p-values were calculated using a t-test. M) Morphology of cells in 4FY, 4FY+PD173074, and 4FY+PD0325901. Scale bar, 100 μm. N) The flow cytometric analysis of SOX17-positive cells in 4FY, 4FY+PD173074, and 4FY+PD0325901. O) Bar chart showing the SOX17-positive cells quantified by flow cytometry shown in (N). The data are presented as the mean ± SD. n = 3. ns, no significance; **** p<0.0001. The p-values were calculated using one-way ANOVA. P) Morphology of cells in 4FY+FGF2, 4FY+FGF2+PD173074, 4FY+FGF2+PD0325901, and 4FY+FGF2+SB431542. Scale bar, 100 μm. Q) The flow cytometric analysis of SOX17-positive cells in 4FY+FGF2, 4FY+FGF2+PD173074, 4FY+FGF2+PD0325901, and 4FY+FGF2+SB431542. R) Bar chart showing the SOX17 positive cells quantified by flow cytometry shown in (Q). The data are presented as the mean ± SD. n = 3. ns, no significance; **** p<0.0001. The p-values were calculated using one-way ANOVA.
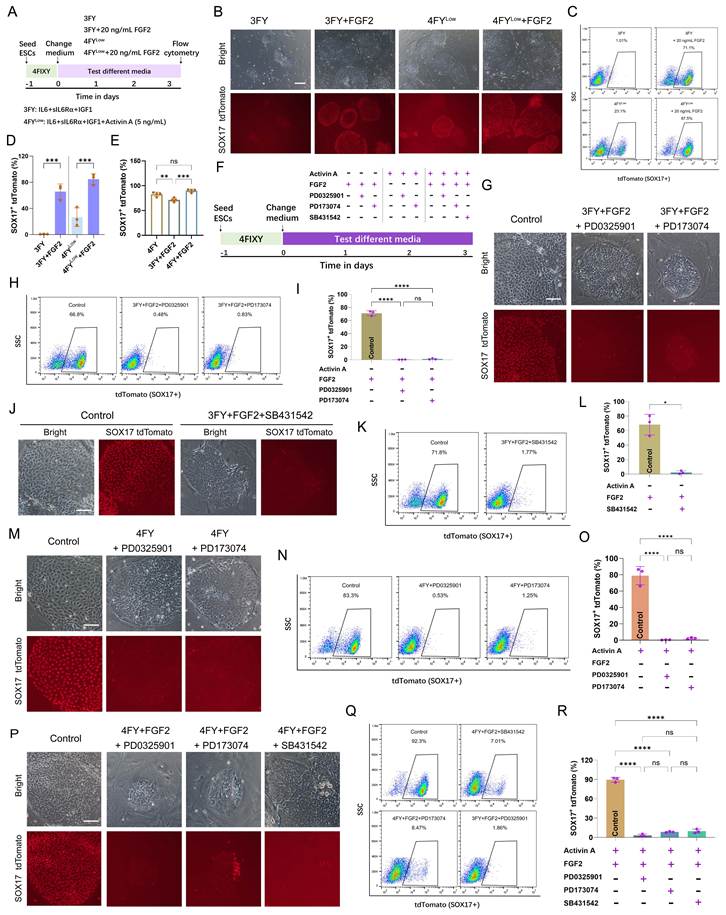
To examine the FGF signaling function, we first applied an FGF receptor inhibitor, PD173074, to inhibit the FGF signaling activation and assayed XEN transition efficiency (Figure 4F). Flow cytometry showed a dramatic reduction of the SOX17-positive cell population from about 66.8% to 0.83% due to the addition of PD173074 (Figure 4G-I). It has been reported that FGF2 can function through MAPK/ERK[39]. We then applied inhibitors of these signaling pathways in FGF-mediated transition (3FY+FGF2). Adding MAPK/ERK inhibitor PD0325901 markedly decreased SOX17-positive cells from about 66.8% to 0.48% (Figure 4G- I).
As SB431542 impedes Activin A-mediated XEN formation (Figure S3), we investigate whether FGF2 can rescue this ESC-to-XEN transition. The results showed that few SOX17-positive cells (1.77%) were recorded in 3FY+FGF2+SB431542 (Figure 4J-L), indicating that adding FGF2 did not rescue the transformation of XEN from ESCs. Adding PD173074 or PD0325901 in 4FY decreased SOX17-positive cells from 83.3% to 1.25% or 0.53%, respectively (Figure 4M-O). These data indicate that PD173074 and PD0325901 negatively impact Activin A-mediated XEN transition, and Activin A does not rescue the XEN conversion due to FGF inhibition. When porcine ESCs were cultured in 4FY+FGF2, the SOX17-positive cell population was about 90%. The SOX17 expression can be inhibited by adding SB431542 (7.01%), PD173074 (8.47%), or PD0325901(1.86%) (Figure 4P-R). Furthermore, the expression of hypoblast genes SOX17, GATA4, and GATA6 was detected by real-time quantitative PCR. The porcine ESC-derived intermediates using 3FY+FGF2 expressed hypoblast/XEN genes, including SOX17, GATA4, and GATA6, consistent with that in 4FY (Figure S6A). During Activin A-mediated XEN cell transition, the addition of PD173074 or PD0325901 led to downregulation of hypoblast gene expression (Figure S6B). In FGF2-mediated XEN cell transition, supplementation with PD173074, PD0325901, or SB431542 similarly suppressed hypoblast gene expression (Figure S6C). Consistent with these findings, in the 4FY+FGF2 condition, the addition of PD173074, PD0325901, and SB431542 also reduced hypoblast gene expression (Figure S6D). Collectively, these results indicate that Activin A and FGF signaling orchestrate XEN specification.
FGF2 can rescue the ESC-to-XEN transition impaired by Activin A deficiency
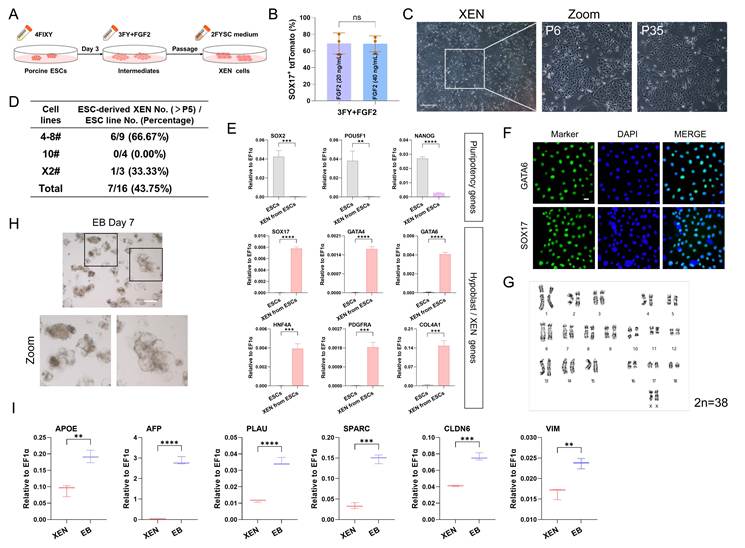
We previously derived intermediates with the XEN potential from porcine ESCs using 4FY medium, and then obtained XEN cells using 2FYSC medium[15]. Here, we investigate whether FGF2 can rescue the ESC-to-XEN transition impaired by Activin A deficiency in this process (Figure 5A). The flow cytometry revealed a similar SOX17-positive cell population under the FGF2 concentrations ranging from 20 to 40 ng/mL (Figure 5B). Porcine XEN cells can be generated from the intermediates with the XEN potential, but the efficiency was lower than that in Activin A-induced transition[15] (Figure 5C and D). The average efficiency was less than 50%, while the efficiency of the Activin-A driven ESC-to-XEN transition is more than 90%[15] (Figure 5D). For the FGF2-mediated ESC-to-XEN transition, compared with porcine ESCs, SOX17, GATA4, GATA6, PDGFRA, and HNF4A were up-regulated, while pluripotency genes NANOG, SOX2, and POU5F1 were down-regulated (Figure 5E). SOX17 and GATA6 were detected by immunofluorescent staining (Figure 5F). FGF2-mediated ESC-derived XEN cells retained normal karyotypes (Figure 5G). These XEN cells can form EB-like structures and up-regulate VE and ParE-related genes APOE, AFP, PLAU, CLDN6, VIM, and SPARC (Figure 5H and I). These results indicate that FGF2-induced intermediates from porcine ESCs can form XEN cells in the 2FYSC culture condition, albeit with lower efficiency.
FGF2 can rescue the ESC-to-XEN transition impaired by Activin A deficiency. A) Schematic of FGF2-induced ESC-to-XEN cell transition. B) Bar chart showing the SOX17-positive cells quantified by flow cytometry analysis. The data are presented as the mean ± SD. n = 3. ns, no significance. The p-values were calculated using Student's t. C) Morphology of XEN cells transformed from ESCs. Scale bar, 500 μm. D) Summary of the conversion of XEN cells from ESCs induced by FGF2. E) Real-time quantitative PCR data showing pluripotency and hypoblast/XEN gene expression. The data are presented as the mean ± SD. n = 3. ** p<0.01; *** p<0.001; **** p<0.0001. The p-values were calculated using Student's t. F) Immunofluorescent staining for hypoblast/XEN markers. Scale bar, 20 μm. G) Karyotypes analysis of XEN cells. H) EB structure formation of XEN cells. Scale bar, 100 μm. I) Real-time quantitative PCR data showing ParE and VE marker gene expression. The data are presented as the mean ± SD. n = 3. ** p<0.01; *** p<0.001; **** p<0.0001. The p-values were calculated using Student's t.
Hypoblast lineage specification in porcine embryos depends on Activin A and FGF signaling
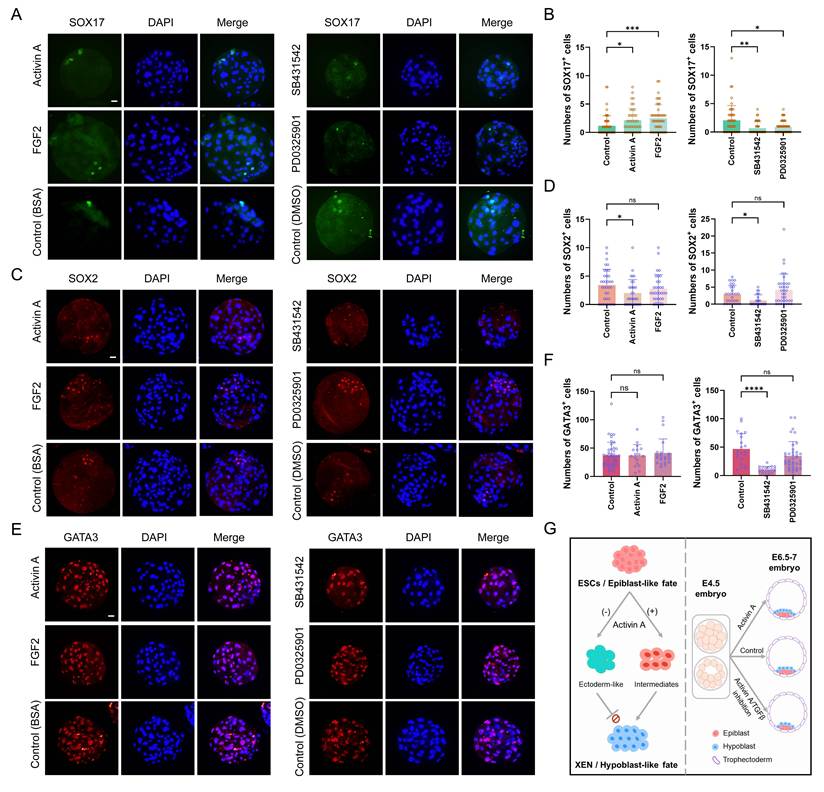
Porcine stem cell-based model studies indicate that Activin A and FGF signaling are critical to hypoblast lineage generation. We next validate the role of Activin A and FGF in porcine embryos. The embryonic day (E) 4.5 embryos were cultured in N2B27 medium containing Activin A or FGF2 for 52-56 h. Embryos treated with Activin A or FGF2 showed increased SOX17-positive cells (Figure 6A and B). The number of SOX2-positive cells showed a downward trend in Activin A-treated embryos, but was unaffected in FGF2-treated embryos (Figure 6C and D). Neither Activin A nor FGF2 altered the number of GATA3-positive cells (Figure 6E and F). We blocked the TGFβ and MAPK/ERK pathways using inhibitors SB431542 and PD0325901, respectively, from E4.5 to E6.5-7 stage. TGFβ inhibition with high-dose SB431542 (50 μM) reduced the numbers of SOX17-, SOX2-, and GATA3-positive cells (Figure 6). MAPK/ERK inhibition decreased SOX17-positive cells (Figure 6A and B), but did not affect SOX2- and GATA3-positive cells (Figure 6C-F). We further treated porcine embryos with SB431542 at 10 μM from morula to late blastocyst, which did not significantly impair embryonic development (Figure S7). Immunofluorescence analysis revealed a consistent reduction in SOX17-positive cells at these doses (Figure S7). To validate TGFβ pathway specificity, we applied the structurally distinct inhibitor A83-01 (10 μM and 20 μM) under identical developmental conditions. Both inhibitors produced comparable decreases in SOX17-positive cell populations (Figure S7), confirming the role of TGFβ signaling in porcine hypoblast regulation. These results reveal the positive role of Activin A in hypoblast lineage specification in early porcine blastocysts. FGF2 signaling is required for porcine hypoblast formation, which is consistent with findings of FGF in the mouse and human embryos[11, 40].
Activin A and FGF2 drive porcine hypoblast in blastocysts. A) Immunofluorescent staining for SOX17 in E6.5-7 blastocysts following about 52-56 h culture in N2B27 medium containing Activin A, FGF2, SB431542, or PD0325901. Scale bar, 20 μm. B) Bar chart showing the number of hypoblast (SOX17-positive) cells. Activin A, 500 ng/mL, n=41; FGF2, 250 ng/mL, n=47; Control, n=55. SB431542, 50 μM, n=42; PD0325901, 10 μM, n=58; Control (DMSO), n=48. Statistical tests: Kruskal-Wallis test with Dunn's multiple comparisons test. * p<0.05; ** p<0.01; *** p<0.001. C) Immunofluorescent staining for SOX2 in E6.5-7 blastocysts following about 52-56 h culture in N2B27 medium containing Activin A, FGF2, SB431542, or PD0325901. Scale bar, 20 μm. D) Bar chart showing the number of epiblast (SOX2-positive) cells. Activin A, 500 ng/mL, n=32; FGF2, 250 ng/mL, n=32; Control, n=35. SB431542, 50 μM, n=25; PD0325901, 10 μM, n=36; Control (DMSO), n=28. Statistical tests: Kruskal-Wallis test with Dunn's multiple comparisons test. ns, no significance; * p<0.05. E) Immunofluorescent staining for GATA3 in E6.5-7 blastocysts following about 52-56 h culture in N2B27 medium containing Activin A, FGF2, SB431542, or PD0325901. Scale bar, 20 μm. F) Bar chart showing the number of trophectoderm (GATA3-positive) cells. Activin A, 500 ng/mL, n=17; FGF2, 250 ng/mL, n=22; Control, n=44. SB431542, 50 μM, n=19; PD0325901, 10 μM, n=37; Control (DMSO), n=21. Statistical tests: Kruskal-Wallis test with Dunn's multiple comparisons test. ns, no significance; **** p<0.0001. G) Schematic diagram illustrating the critical role of Activin A in porcine hypoblast formation.
Discussion
Pigs are regarded as highly valuable animal models for regenerative medicine owing to their close similarities to humans in anatomical, immunological, and physiological characteristics. Stem cells represent a promising cell source for biomedical research and therapeutic applications. We have established an in vitro cell model for porcine ESC-to-XEN transition. Following a period of exposure to Activin A, porcine ESCs convert into intermediates with the XEN potential. In contrast, the inhibition of Activin A/TGFβ signaling impedes the conversion of the two cell types. Single-cell transcriptomic analysis reveals the in vitro transition trajectory from porcine ESCs to XEN lineage and demonstrates that Activin A is essential for acquiring XEN identity.
Previous reports have shown that, in humans, Activin A treatment (25 ng/mL) decreases trophectoderm cell numbers without affecting epiblast or hypoblast cell lineage[5]. In contrast to the human, Activin A promotes trophectoderm formation in mice (500 ng/mL) and bovine (25 ng/mL) and suppresses epiblast development [12, 13]. In our study, we show that Activin A (5-50 ng/mL) is indispensable for acquiring XEN potential from porcine ESCs; Porcine embryos treated with Activin A showed increased SOX17-positive hypoblast cells. Taken together, Activin A influences early embryonic development in mammals, including humans, mice, bovine, and pigs, with its effects on specific cell lineages varying across species.
Species-specific responses to TGFβ and FGF/MAPK/ERK pathway inhibition critically influence hypoblast specification in mammalian embryos, with outcomes dependent on inhibitor dosage, exposure time, and biological context. In porcine embryos treated with the Activin A/TGFβ pathway inhibitor SB431542 (20 μM) from pre-morula to early blastocyst, or from morula to mid blastocyst (48 hours), SOX17-positive cell numbers remain unchanged[3]. Here, we tested the effect of SB431542 at a higher concentration (50 μM), which induces a downward trend in SOX17-positive cells. Notably, high-dose SB431542 also suppresses the specification of both epiblast and trophectoderm lineages. We further treated porcine embryos with SB431542 at 10 μM from morula to late blastocyst, which did not significantly impair embryonic development. We then applied another TGFβ inhibitor A83-01 (10 μM and 20 μM) under identical developmental conditions. Both inhibitors produced comparable decreases in SOX17-positive cells. Concurrently, inhibition of the FGF/MAPK/ERK pathway using PD0325901 (10 μM) from E4.5 to E6.5-7 reduced SOX17-positive cell numbers, aligning with prior porcine studies[3]. Our experiments reveal, for the first time, a positive regulatory role of Activin A in hypoblast formation in pigs. We also find that Activin A suppresses epiblast development, consistent with previous observations in mice and cattle[12, 13]. In contrast to mice and cattle, however, Activin A does not affect trophectoderm cell fate in pigs. Additionally, FGF2 promotes hypoblast formation in pigs, as evidenced by increased SOX17-positive cell counts, a finding consistent with observations in humans[40]. In summary, this study provides evidence for a critical role of Activin A signaling in hypoblast lineage formation in pigs (Figure 6G).
Supplementary Material
Supplementary figures and table.

Acknowledgements
This work was supported by the National Key Research and Development Program of China (2025YFA1804200), National Natural Science Foundation of China (32600963, 32601080, and 32630024), the Noncommunicable Chronic Diseases - National Science and Technology Major Project (2025ZD0552201), Shijiazhuang Innovation Capability Improvement Project (2564602309A), and Government-Funded Outstanding Clinical Medicine Talent Cultivation Program (ZF2026029). We thank all the members of Pei Lab for their help.
Author contributions
H.W., and J.X. designed and supervised the study. H.W. and J.X. performed the experiments and analyzed the data. L.Z. performed the bioinformatic analysis. X.Y., K.W., and C.Z. assisted in experiments. H.W. and J.X. wrote the original draft and D.P. revised the manuscript. All authors read and approved the final manuscript.
Data availability
The RNA-Seq, scRNA-Seq and ATAC-Seq data have been submitted to the GSA database with CRA032506.
Competing Interests
The authors have declared that no competing interest exists.
References
1. Lunney JK, Van Goor A, Walker KE, Hailstock T, Franklin J, Dai CH. Importance of the pig as a human biomedical model. Sci Transl Med. 2021;13:eabd5758
2. Dufour A, Kurylo C, Stöckl JB, Laloë D, Bailly Y, Manceau P. et al. Cell specification and functional interactions in the pig blastocyst inferred from single-cell transcriptomics and uterine fluids proteomics. Genomics. 2024;116:110780
3. Ramos-Ibeas P, Sang F, Zhu QF, Tang WWC, Withey S, Klisch D. et al. Pluripotency and X chromosome dynamics revealed in pig pre-gastrulating embryos by single cell analysis. Nat Commun. 2019;10:500
4. Simpson L, Strange A, Klisch D, Kraunsoe S, Azami T, Goszczynski D. et al. A single-cell atlas of pig gastrulation as a resource for comparative embryology. Nat Commun. 2024;15:5210
5. Weatherbee BAT, Weberling A, Gantner CW, Iwamoto-Stohl LK, Barnikel Z, Barrie A. et al. Distinct pathways drive anterior hypoblast specification in the implanting human embryo. Nat Cell Biol. 2024;26:353-65
6. Liu TB, Li J, Yu LQ, Sun HX, Li J, Dong GY. et al. Cross-species single-cell transcriptomic analysis reveals pre-gastrulation developmental differences among pigs, monkeys, and humans (vol 7, 8, 2021). Cell Discov. 2021;7:8
7. Nichols J, Silva J, Roode M, Smith A. Suppression of Erk signalling promotes ground state pluripotency in the mouse embryo. Development. 2009;136:3215-22
8. Piliszek A, Madeja ZE, Plusa B. Suppression of ERK signalling abolishes primitive endoderm formation but does not promote pluripotency in rabbit embryo. Development. 2017;144:3719-30
9. Kuijk EW, van Tol LTA, Van de Velde H, Wubbolts R, Welling M, Geijsen N. et al. The roles of FGF and MAP kinase signaling in the segregation of the epiblast and hypoblast cell lineages in bovine and human embryos. Development. 2012;139:871-82
10. Rodríguez A, Allegrucci C, Alberio R. Modulation of Pluripotency in the Porcine Embryo and iPS Cells. Plos One. 2012;7:e49079
11. Dattani A, Corujo-Simon E, Radley A, Heydari T, Taheriabkenar Y, Carlisle F. et al. Naive pluripotent stem cell-based models capture FGF-dependent human hypoblast lineage specification. Cell Stem Cell. 2024;31:1058-71
12. Xiao Y, Sosa F, Ross PJ, Diffenderfer KE, Hansen PJ. Regulation of NANOG and SOX2 expression by activin A and a canonical WNT agonist in bovine embryonic stem cells and blastocysts. Biol Open. 2021;10:bio058669
13. Xiang JZ, Cao SY, Zhong L, Wang HN, Pei YL, Wei QQ. et al. Pluripotent stem cells secrete Activin A to improve their epiblast competency after injection into recipient embryos. Protein Cell. 2018;9:717-28
14. Xiang JZ, Wang HN, Shi BB, Li JJ, Liu D, Wang KP. et al. Pig blastocyst-like structure models from embryonic stem cells. Cell Discov. 2024;10:72
15. Wang HN, Zhong L, Wang ZF, Xiang JZ, Pei DQ. Wnt Inhibition Safeguards Porcine Embryonic Stem Cells From the Acquisition of Extraembryonic Endoderm Cell Fates. Adv Sci. 2025 12
16. Liao Y, Smyth GK, Shi W. featureCounts: an efficient general purpose program for assigning sequence reads to genomic features. Bioinformatics. 2014;30:923-30
17. Leek JT, Johnson WE, Parker HS, Jaffe AE, Storey JD. The sva package for removing batch effects and other unwanted variation in high-throughput experiments. Bioinformatics. 2012;28:882-3
18. Love MI, Huber W, Anders S. Moderated estimation of fold change and dispersion for RNA-seq data with DESeq2. Genome Biol. 2014;15:550
19. Yu GC, Wang LG, Han YY, He QY. clusterProfiler: an R Package for Comparing Biological Themes Among Gene Clusters. Omics. 2012;16:284-7
20. Kolde R, Kolde MR. Package 'pheatmap'. R package. 2018 1
21. Li H, Durbin R. Fast and accurate short read alignment with Burrows-Wheeler transform. Bioinformatics. 2009;25:1754-60
22. Ramírez F, Dündar F, Diehl S, Grüning BA, Manke T. deepTools: a flexible platform for exploring deep-sequencing data. Nucleic Acids Res. 2014;42:W187-W91
23. Quinlan AR, Hall IM. BEDTools: a flexible suite of utilities for comparing genomic features. Bioinformatics. 2010;26:841-2
24. Heinz S, Benner C, Spann N, Bertolino E, Lin YC, Laslo P. et al. Simple Combinations of Lineage-Determining Transcription Factors Prime-Regulatory Elements Required for Macrophage and B Cell Identities. Mol Cell. 2010;38:576-89
25. Robinson JT, Thorvaldsdóttir H, Winckler W, Guttman M, Lander ES, Getz G. et al. Integrative genomics viewer. Nat Biotechnol. 2011;29:24-6
26. Hao YH, Stuart T, Kowalski MH, Choudhary S, Hoffman P, Hartman A. et al. Dictionary learning for integrative, multimodal and scalable single-cell analysis. Nat Biotechnol. 2024;42:293-304
27. Trapnell C, Cacchiarelli D, Grimsby J, Pokharel P, Li SQ, Morse M. et al. The dynamics and regulators of cell fate decisions are revealed by pseudotemporal ordering of single cells. Nat Biotechnol. 2014;32:381-U251
28. Street K, Risso D, Fletcher RB, Das D, Ngai J, Yosef N. et al. Slingshot: cell lineage and pseudotime inference for single-cell transcriptomics. Bmc Genomics. 2018;19:477
29. Korsunsky I, Millard N, Fan J, Slowikowski K, Zhang F, Wei K. et al. Fast, sensitive and accurate integration of single-cell data with Harmony. Nat Methods. 2019;16:1289-96
30. Leek JT, Storey JD. A general framework for multiple testing dependence. P Natl Acad Sci USA. 2008;105:18718-23
31. Graham V, Khudyakov J, Ellis P, Pevny L. SOX2 functions to maintain neural progenitor identity. Neuron. 2003;39:749-65
32. Massagué J. How cells read TGF-β signals. Nat Rev Mol Cell Bio. 2000;1:169-78
33. Thakurela S, Tiwari N, Schick S, Garding A, Ivanek R, Berninger B. et al. Mapping gene regulatory circuitry of Pax6 during neurogenesis. Cell Discov. 2016;2:15045
34. Yan LH, Zhang X, Jin LL, Li Y, Chen Y, Zhang JB. et al. The ARC(CRABP1) neurons play a crucial role in the regulation of energy homeostasis. Nat Commun. 2025;16:2319
35. Jasmin M, Ahn EH, Voutilainen MH, Fombonne J, Guix C, Viljakainen T. et al. Netrin-1 and its receptor DCC modulate survival and death of dopamine neurons and Parkinson's disease features. Embo J. 2021;40:e105537
36. Mosca TJ. a new synaptic organization molecule emerges. Front Cell Neurosci. 2015;9:204
37. Russo L, Sladitschek HL, Neveu PA. Multi-layered regulation of neuroectoderm differentiation by retinoic acid in a primitive streak-like context. Stem Cell Rep. 2022;17:231-44
38. Pinzon-Arteaga CA, Wang Y, Wei Y, Ribeiro Orsi AE, Li L, Scatolin G. et al. Bovine blastocyst-like structures derived from stem cell cultures. Cell Stem Cell. 2023;30:611-6 e7
39. Xie YL, Su N, Yang J, Tan QY, Huang S, Jin M. et al. FGF/FGFR signaling in health and disease. Signal Transduct Tar. 2020;5:181
40. Yamanaka Y, Lanner F, Rossant J. FGF signal-dependent segregation of primitive endoderm and epiblast in the mouse blastocyst. Development. 2010;137:715-24
Author contact
Corresponding authors: peiduanqingedu.cn; xiangjinzhuedu.cn; wanghanningsedu.cn.