Impact Factor ISSN: 1449-2288




Int J Biol Sci 2027; 23(1):341-357. doi:10.7150/ijbs.132239 This issue Cite
Research Paper
In-Depth Interaction Proteomics Defines Global GABAA Receptor Interactome and Reveals Novel Receptor Associated Proteins
Miao Chen1, Frank Koopmans1, Miguel Angel Gonzalez-Lozano1,2, August Benjamin Smit1, Ka Wan Li1 
1. Department of Molecular and Cellular Neurobiology, Center for Neurogenomics and Cognitive Research, Amsterdam Neuroscience, Vrije Universiteit Amsterdam, 1081 HV Amsterdam, The Netherlands.
2. Current address: Department of Cell Biology, Harvard Medical School, Harvard University, MA 02115 Boston, USA.
Received 2026-1-27; Accepted 2026-8-19; Published 2027-1-1
Abstract
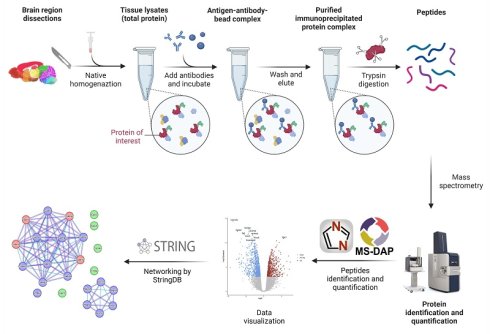
GABAA receptors (GABAARs) are pentameric ligand-gated ion channels that mediate the vast majority of fast inhibitory synaptic transmission in the brain. Their functional diversity and distinct pharmacological properties stem from variations in subunit composition, as well as dynamic interactions with auxiliary and scaffolding proteins. However, the combinatorial complexity of native receptor assemblies, coupled with the low endogenous abundance of many candidate interactors, has posed a major obstacle to achieving a comprehensive, molecular-level characterization of the native GABAAR protein complex. To address this, we conducted a systematic, large-scale mapping of GABAAR protein networks using the high-sensitivity, quantitative mass spectrometry-based interaction proteomics approach. Each immunoprecipitation yielded tens to hundreds of significantly enriched proteins, enabling the reconstruction of subunit-resolved receptor interactomes. GABAAR subunits and key adhesion molecules were robustly identified that tightly clustered within the interaction networks. The intersection of Gabra1, Gabrb2/3, Gabrg2, Nlgn2, and Lhfpl4 interactomes revealed six novel interactors, Gpc1, Gpc6, Sdc4, Camkv, Rack1, Srrm2. The novel interactors were also present in Gabra3 immunoprecipitate. The association of Camkv and Gpc1 with GABAAR were validated using co-expression and co-immunoprecipitation assays in heterologous systems. Camkv knockdown in primary hippocampal neuronal cultures resulted in a marked decrease in surface-expressed GABAAR indicating a specific role for Camkv in regulating GABAAR trafficking to, or stabilization at, the plasma membrane.
Keywords: GABAA receptor, protein complexes, proteomics, affinity isolation, novel receptor associated proteins
Introduction
Inhibitory neurotransmission in the brain is primarily mediated by synaptic and extra-synaptic GABAA receptors (GABAARs)[1,2]; the disruptions in GABAergic neurotransmission are the causes of many psychiatric, neurodevelopmental, and neurodegenerative disorders[3-6]. These receptors belong to the family of hetero-pentameric ligand-gated ion channels, assembled from 19 distinct subunit types α1-6, β1-3, γ1-3, δ, ε, π, ρ1-3, and θ, typically arranged in a stoichiometry of two α subunits, two β subunits, and one γ or δ subunit[7]. The precise subunit composition determines the receptor's physiological and pharmacological properties, as well as its subcellular localization[8,9]. For instance, GABAARs comprised of α1-α3 (Gabra1-3) subunits are widely expressed across the brain, mostly clustered at synapses and mediate phasic inhibition[10,11]. In contrast, α4-α6 (Gabra4-6) containing GABAARs exhibit more restricted expression patterns, localize predominantly to extra-synaptic sites, and mediate mainly tonic inhibition[10,12].
A variety of GABAAR-associated proteins play essential roles in the assembly[13], trafficking[14,15], anchoring[16,17], and recycling processes of GABAAR[18]. Several have been identified and functionally characterized[12,19-21]. Gephyrin (Gphn) and collybistin (Arhgef9) act as scaffolds, dynamically regulating the GABAAR cell membrane distribution at synaptic and extrasynaptic sites[22-24]. In contrast to glycine receptor clustering that depends on its interaction with Gphn, surface synaptic clusters of α1, α2, and γ2 (Gabrg2) subunits were present in Gphn knockout neurons[6], implicating different mechanisms in their aggregation, surface insertion or stabilization. Neuroligin-2 (Nlgn2) and Lipoma HMGIC fusion partner-like 4 (Lhfpl4) are another functional class of receptor interactors. They regulate synaptic clustering of GABAARs[25,26] and synapse formation, with Lhfpl4 being essential for motor behaviors[19]. Lhfpl4 works in concert with Nlgn2, and promotes retention of GABAARs at synapses in a subunit-dependent manner[17,19,25,27]. Another GABAAR associated protein, Cleft Lip and Palate Transmembrane Protein 1 (Clptm1), inhibits the forward trafficking of GABAAR in the ER and Golgi apparatus[20].
Given the established roles of these associated proteins in regulating GABAAR trafficking and channel properties, defining the full repertoire of interacting partners is crucial for understanding how inhibitory signaling governs neuronal excitability and neural circuit dynamics in both healthy and pathological states[18,21,28]. Immunoaffinity based techniques have been extensively used to investigate GABAAR subunit composition of the major receptor types and the interactions with associated proteins[20,29]. For example, Ge et al. generated a mouse with transgenic epitope-tagged GABAAR γ2 subunits and successfully established the proteome of this subunit, from which they identified a novel GABAAR associated protein with functional characterization. Using a similar technique, the GABAAR α2 proteome was also defined[20,30]. Besides, many other GABAAR associated proteins were identified that co-localize with GABAAR subunits or Gphn, such as GABA Type A Receptor-Associated Protein (Gabarap)[31] and Shisa Family Member 7 (Shisa7)[32], as well as Nlgn2 and Lhfpl4[17,25]. Despite these advances, the intricate diversity of subunit combinations and the low abundance of many putative interactors have hindered comprehensive molecular characterization of the GABAAR complex.
Advances in proteomics technology now enables higher liquid chromatography-mass spectrometry sensitivity, which might reveal previously not identified interactors. In this study, we performed high-density immunoprecipitation (IP)-based proteomic profiling using antibodies targeting the GABAAR subunits α1, α2, α3, α4, α5, β2/β3, and γ2; the GABAAR-associated proteins Nlgn2, Lhfpl4, and Gphn. We applied enrichment analysis to filter out nonspecific binders thereby identified tens to hundreds of interactors per immunoprecipitate. By intersecting the interactomes derived from Gabra1, Gabrb2/3, Gabrg2, Nlgn2 and Lhfpl4 IP, we identified six novel GABAAR-interacting proteins, among which CaM kinase-like vesicle-associated protein (Camkv) and glypican (namely Gpc1 and 6) emerged as prominent interactors. Physical interaction between Camkv and Gpc1 to the recombinant GABAAR α1β2γ2 subtype were validated through co-immunoprecipitation assays following co-expression in HEK293 cells. Knock-down of Camkv in primary neuronal culture reduced GABAAR cell surface expression, indicating that Camkv acts as a positive regulator of GABAAR trafficking to, or stabilization at, the plasma membrane.
Materials and Methods
Immunoprecipitation/SDS-PAGE fractionation
The immunoprecipitation was performed as described previously[33,34]. Mouse cortex was homogenized using a mortar and pestle (Sartorius, Göttingen, Germany; 12 strokes, 900 rpm) in 1% Maltose-neopentyl glycol buffer, containing 25 mm HEPES, 150 mm NaCl (pH 7.4), and proteinase inhibitor (Roche), and incubated for 1 h at 4 °C. After centrifugation at 20.000 × g, 2 μg antibody was added to the supernatant and incubated overnight at 4 °C. The antibody was captured by 40 μl protein A/G plus agarose beads (Santa Cruz). After washing four times with 0.1% Maltose-neopentyl glycol containing 25 mm HEPES and 150 mm NaCl (pH 7.4), the beads were mixed with SDS sample buffer and heated to 98°C for 5 min. Proteins were separated on a 10% SDS polyacrylamide gel and stained with Coomassie Blue. Each sample lane was cut into three fractions, each fraction was further cut into small gel pieces and transferred to a 96-well plate (0.45 μm filter; MultiScreen-HV 96-well filter plate from Millipore). Gel pieces were destained by sequential incubation with 100 μl 50 mM NH3HCO3/50% acetonitrile and then 75 μl 100% acetonitrile. For each step, brief centrifugation of the plate was performed to remove the supernatant. Gel pieces were subsequently incubated with MS grade endolysC/trypsin (Promega) at 37°C overnight. 100 μl 0.1% TFA in 50% acetonitrile was added to each fraction, incubated for 40 min, collected in an Eppendorf tube and dried in the SpeedVac.
The commercial antibodies used were from NeuroMab, α1 (N95/35, AB_10697873), β2/3 (62-3G1, AB_2315837), γ2 (N452/30, AB_2714201), α6 (N229A/32, AB_2491091), α2 (N399/19, AB_2877202), α4 (N398A/34, AB_2341108), α5 (N398A/34, AB_2686910); from proteintech, α3 (12708-1-AP); from Synaptic system, Neuroligin 2 (129 203); and from Santa cruz, Ipo7 (sc-365231), Bag6 (sc-365928), Camkv (sc-517082). We obtained custom-made antibodies from GenScript against GluA2/GluA3 (antigen peptide: CQNFATYKEGYNVYGIESVKI), Lhfpl4 (antigen peptide: TVSSVLRPGGDVSG), and Gphn (antigen peptide: PTPKQIRRPDESKG).
The experimnts were performed according to the guidelines approved by the Central Committee for Anmal Experiment (CCD) and the Animal Welfare Body (IVD) of the Vrije Universiteit Amsterdam.
HPLC-ESI MS/MS
Evosep One coupled to TimsTOF Pro 2 mass spectrometer was used for the analysis of the immunoprecipitation samples[35]. In brief, the peptide solution was transferred to an Evotip and run on a 15 cm x 75 µm, 1.9 µm Performance Column (EV1112 from EvoSep) using the Evosep One liquid chromatography system with the 30 samples per day program. Peptides were electro-sprayed into the TimsTOF Pro 2 mass spectrometer and analysed with diaPASEF[36,37]. The MS scan was between 100-1700 m/z. The Tims settings were 1/Ko from start to end between 0.6-1.6 V.s/cm2, ramp time 100 ms, accumulate time 100 ms, and ramp rate 9.42 Hz.
Data analysis
DIA-PASEF raw data were processed with DIA-NN 1.9.2[38]. An in-silico spectral library was generated from the Uniprot mouse proteome (SwissProt and TrEMBL canonical sequences, release 2023-03) using Trypsin/P digestion and at most 1 missed cleavage. Methionine oxidation was enabled, and maximum number of variable modifications was set to 1. Precursor charge range was set to 2-4, both MS1 and MS2 mass accuracy were set to 10 ppm. Protein inference was set to isoform. All other settings were left as default.
MS-DAP 1.0.5[39] was used to preprocess the DIA-NN results and perform differential expression analysis to find the subset of prey proteins for each bait protein. In MS-DAP settings, filter_min_detect was set to 3, filter_fraction_detect was set to 0.75, filter_fraction_quant was set to 0.75, Variance Stabilizing Normalization (VSN) and “modebetween_protein” were used to normalized data. The DEqMS algorithm was used for differential expression analysis. In the first instance, proteins were filtered with log2fold change ≥ 2. However, in our proteomic analysis, many proteins were uniquely identified in the bait protein IPs but absent in the control IPs. As differential expression analysis with DEqMS (and similar approaches) is not applicable for proteins with excessive missing values in one condition, we further applied the differential detection test that is integrated in MS-DAP. In brief, this qualitative analysis compares, per protein, the number of detected peptides across all samples between conditions. Throughout this manuscript we refer to these results as Z-scores (i.e. z-scores computed by the differential detection method). This qualitative metric complements the primary DEqMS-based analysis by capturing proteins with strong group-specific detection. We considered any protein with a Z-score ≥5 as a true interactor. Together, the filter we applied to the enriched proteins for each bait were either significantly enriched (5% FDR) with 4-fold increased abundance as compared to the contrating IP set (such as Gria2/3 IPs), and/or consistently detected and (near) absent in the contrasting set.
Protein intensities were normalized by group specific filter within MS-DAP. Volcano plots, UpSet plot, and the “correction of English by AI” were generated using the CNSknowall platform (https://cnsknowall.com). The protein networks were generated by STRING database. The minimum required interaction score for filtering protein-protein interactions was set as either high or medium confidence, with full STRING network or physical subnetwork[40]. The STRING images were sent to Cytoscape for visualization of the interactomes. Overexpression GO enrichment analysis was performed by ShinyGO[41], with FDR cutoff at 0.05 and pathway sizes of 10-2500. A hierarchical clustering tree generated by ShinyGO summarizes the correlation among significant pathways. GO terms from branches of the tree as representative example of the pathways with many shared genes were usd to construct bubble plot of GO terms for the comparison across the groups. The bubble plots for the GO terms comparison and the heatmap were generated using OmicStudio platform[42]. The gene set GO enrichment analysis was performed in GOAT with the Gene Ontology database (2025-1-1)[43], gene score type “effect size”, gene set size between 10-1500, p-value adjustment with FDR at a threshold of 0.05.
Heterologous expression in Hek293 cells
HEK293T cells were cultured on 10 cm2 tissue-culture treated culture dishes at 37℃ and 5% CO2 incubator within 10 ml Dulbecco's modified Eagle's medium (Gibco) supplemented with 10% fetal bovine serum (Invitrogen), 1% penicillin-streptomycin (Gibco). Cells were transfected using polyethylenimine at ~70% confluency, with in total 5μg plasmid cDNA. The amount ratio among GABAAR α1: β2: γ2: candidate is 1:2:2:1. The following Plasmids were used: α1-HA (pcDNA3.1 (+)-C-HA - α1 NM_010250.5), β2-HA (pcDNA3.1(+)-C-HA-β2 NM_001347314.1), γ2-HA (pcDNA3.1(+)-C-HA- γ2 NM_008073.3), Gpc1-Flag (pCMV6_Entry_Gpc1_Myc_DDK NM_016696), Ipo7-Flag (pcDNA3.1+C-(K)-Ipo7-DYK NM_181517.3), Bag6-Flag (pcDNA3.1+C-(K)-Bag6-DYK), Camkv-Flag (pcDNA3.1 (+)-C-(k)DYK- Camkv NM_024046.4).
HEK293T cell lysates were subject to immunoprecipitation as previously described[44]. 2 μg antibody was added to the cell lysate and two commercial antibodies were used: Anti-HA tag antibody (ab9110, Abcam) and anti-Flag M2 antibody (F1804, Sigma-Aldrich). Immunoprecipitated samples from cell lysate on SDS polyacrylamide gel were subjected to immunoblotting. Protein complexes on the gel were transferred onto a PVDF membrane overnight at 4℃, 40 V. The membrane was blocked with 5% non-fat milk in Tris-buffered saline (pH 7.4) with 0.1% Tween-20 (TBS-T), then membrane was incubated with primary antibody against HA tag (1:1000, if anti-Flag antibody was used for IP) and Flag-tag (1:1000, if anti-HA antibody was used for IP) at 4℃, overnight. After three washes with TBS-T buffer, the blot was incubated with HRP-conjugated Goat anti-Rabbit IgG secondary antibody (Dako, 1: 1000) in 3% non-fat milk added to TBS-T buffer. The blot was washed an additional three times, incubated with SuperSignal West Femto Chemiluminescent Substrate (Thermo Fisher) and scanned on an Odyssey Fc scanner (Licor Biosciences).
Primary neuronal culture
A hippocampal primary neuron culture was prepared as previously described[45]. In short, E18 wildtype hippocampi were dissected and incubated in Hank's balance salts solution (1 M, Thermo Fisher) and digested in buffer containing 7 mM HEPES (pH 7.4), and 0.25% trypsin (Thermo Fisher). After hippocampi were washed three times in HEPES buffer and twice in neurobasal medium (Thermo Fisher), neurons were triturated with Pasteur pipettes and neuronal concentration was calculated in a Fuchs-Rosenthal chamber. 12.5 K/well cells were plated in neurobasal medium for culturing supplemented with 2% B-27 (Thermo Fisher), 2% HEPES solution, 0.25% glutamine (200 mM, Thermo Fisher) and 1% penicillin/streptomycin on a 96-well glass plate bottom, which was coated in poly-d-lysine/laminin (Sigma-Aldrich) at 37 ℃, 5% CO2 incubator.
Immunocytochemistry
Neurons at DIV21 were fixed using 4% paraformaldehyde and 1% sucrose in PBS (Thermo Fisher) for 20 min and washed twice with PBS. Cells were permeabilized with 0.5% Triton-X (Sigma-Aldrich) for 20 min on a shaker at RT and blocked with 2% goat serum and 0.1% Triton-X in PBS for 1h at RT. For primary antibody incubation, all antibodies were diluted to 1:1000 in blocking solution and were used to incubate with the cells at 4 ℃ overnight. Cells were washed three times with PBS and immediately incubated with secondary antibody in blocking solution with the ratio of 1:400 (v/v) at RT for 2h in dark. After washing for three times in PBS, cells were ready for immunocytochemistry analysis.
For confocal imaging, the following antibodies were used: anti-Camkv (Santa Cruz, sc-517082, 1:1000). Anti-α1 (Milipore, AB5592, 1:1000), and anti-vGAT (Synaptic Systems, Göttingen, Germany, 131-004, 1:1000). Hippocampal neurons were incubated with primary antibodies overnight at 4 °C. Cells were then washed with PBS and incubated with corresponding Alexa conjugated secondary antibodies (Thermo Fisher, 1:400) with a thin foil cover for 1 h at RT. Images were captured using a Nikon Eclipse Ti microscope confocal laser scanning microscope (Nikon, 40× objective; NA 1.3) with NIS-Elements 4.30 software. Quantification of colocalization was performed by ImageJ for Pearson correlation coefficient and Mander's coefficient analysis via the JACop plugin[37,46,47].
Lentivirus production and virus infection
Virus production and infection followed a similar approach as previously described[48]. In short, three Camkv knockdown plasmids were pLentiCRISPR_Camkv1 (target sequence: ACTCGCTCAAGATTGTGCAC), pLentiCRISPR_Camkv4 (target sequence: GAGGATTCCAATCTCGTTCT) and pLentiCRISPR_Camkv6 (target sequence: AGATGTGTTTGTGACCCGCA). They were obtained from Genscript, which were used to transfected HEK293T cells together with envelope and packaging plasmids in medium overnight at 37℃, 5% CO2 incubator. The transfection medium was replaced with Optimem medium supplemented with 1% penicillin/streptomycin and 1% glutamine. On the next day, the medium was collected and centrifuged at 1000 x g for 5 mins and supernatant containing the viral particles was filtered (0.45 mm pore size) and aliquoted.
Hippocampal primary neurons were plated on a 96-well glass plate bottom as previously described and infected at DIV2 with 0.125 μl virus in 200 μl neurobasal medium for culture per well. Neurons at DIV14 were washed three times with ice-cold PBS. Then, 500 μl PBS supplemented with a protease inhibitor cocktail (Roche) was added to each well and neurons were collected by gentle scraping. Neurons were centrifuged for 5 min at 3000×g at 4°C and the pellet was collected and lysed in Laemmli Loading Buffer containing 4% SDS, 100 mM Tris pH 6.8, 200 mM DTT, 20% glycerol, 0.04% bromophenol blue. In-gel digestion was performed overnight at 37°C with MS grade endo Trypsin/LysC (Promega). The digested peptides were dried using a SpeedVac and stored at -20°C. An SDS-PAGE LC-MS/MS approach was used for peptide identification as previously reported[37].
Neuronal surface protein biotinylation
Hippocampal primary neuron culture was prepared as previously described[37]. In short, 125K hippocampal neurons per well were cultured on a 24 well plate and infected with 5.6 μl lentivirus containing three Camkv knockdown plasmids individually. At DIV 21, cells were washed with ice-cold PBS three times and cell surface proteins were subjected to biotinylation by treating these with 2 mM EZ-Link™ Sulfo-NHS-LC-Biotin (A39257, Thermo Fisher) in PBS for 30 mins at RT. After removing the biotin reagent, the reaction was quenched by washing with 100 mM glycine in PBS for three times. The neuronal total proteins in each well were then extracted by 45 μl 2% SDS extraction buffer and harvested by a tip scrape. Protein extractions were boiled at 98℃ for 5 mins and centrifuged down at 20,000 x g. 10 μl supernatant of each sample was transferred to another tube and treated with 2.5 μl 5x SDS loading buffer as total protein subfraction. The remaining ~40 μl extractions were filled with 750 μl dilution buffer containing 50 mM Tris, 150 mM NaCl and 1% Triton. Neuronal surface proteins were pulled down by incubating with 75 μl Avidin beads on a rotator at 4℃ overnight. On the second day, beads were centrifuged at 2500 x g, 20℃ for 2 mins and washed three time with wash buffer containing 50 mM Tris, 150 mM NaCl and 0.2% SDS, 1% Triton (pH = 7.4). After washing, neuronal surface proteins were eluted from the beads by treating these with 30 μl 2x SDS loading buffer.
Immunoblotting was performed as previously described[37]. In brief, each blot was cut horizontally at the 65 kDa marker position. The upper parts of the blots were incubated with a mixed primary antibodies solution containing anti-GluA2/3 (Genscript, 1:1000) and Camkv (Santa Cruz, 1:1000) antibodies and a mix of secondary antibody containing HRP-conjugated Goat anti-Rabbit IgG (Dako, 1: 1000) and HRP-conjugated Goat anti-Mouse secondary antibody (Dako, 1: 1000) in 3% non-fat milk added to TBS-T buffer. The lower part of the blots was incubated with primary antibody anti-α1 antibody (Neuromab, 1:1000) and secondary antibody HRP-conjugated Goat anti-Mouse secondary antibody (Dako, Santa, 1: 1000).
Data availability
Data in this study are included in the supplement. The raw data supporting the conclusions of this article will be made available by the authors, without undue reservation. The mass spectrometry proteomics data have been deposited to the ProteomeXchange Consortium (https://proteomecentral.proteomexchange.org) via the iProX partner repository[49,50] with the dataset identifier PXD048233. All data will be made public once the manuscript is accepted for publication.
Results
Characterization of GABAAR protein networks by interaction proteomics
We performed interaction proteomics on mouse cortical tissue extracts to comprehensively characterize the GABAAR interactomes (Fig. 1A). We conducted IP using antibodies targeting the most abundant GABAAR subunits in the cortex, the α1, β2/3, and γ2 subunits. Because functional GABAARs are anchored at the synaptic membrane with scaffold and auxiliary proteins. We additionally performed IP using antibodies against Lhfpl4, Nlgn2, and Gphn to selectively enrich for mature, synaptically localized, and functionally competent receptors. To further explore subunit-specific organization, we extended our analysis to other α subunits, namely α2, α3, α4, and α5, to assess both shared and distinct features of their interactomes.
The protein interactomes of Gabra1, Gabrb2/3, Gabrg2, Lhfpl4, Nlgn2, and Gphn. (A) Schematic drawing of the workflow for the proteomics analysis of GABAAR interactomes. Mouse cortex was dissected and homogenized in lysis buffer and the protein complexes immunoprecipitated by antibodies and captured by Protein A/G beads. The IP proteins were trypsin digested and the peptides identified and quantified by liquid chromatography-mass spectrometry followed by database search, differential expression analysis, and the construction of protein networks. (B) The UpSet diagram illustrates the number of unique and overlapping proteins among the enriched proteins identified in the IP groups of Gabra1, Gabrb2/3, Gabrg2, Lhfpl4, Nlgn2, and Gphn. (C) A protein-protein interaction network constructed from the shared proteins across the Gabra1, Gabrb2/3, Gabrg2, Nlgn2, and Lhfpl4 interactomes, and Gabra1, Gabrb2/3, Gabrg2, Lhfpl4, Nlgn2, and Gphn interactomes, as hightlighted with arrows in B. Bait proteins are labeled in pale blue. (D) Log-transformed intensity values of the proteins depicted in panel C, derived from IP of Gabra1, Gabrb2/3, and Gabrg2. Proteins classified into the groups of “Gabra1-Gabrb2/3-Gabrg2”, “known GABAAR-associated proteins”, and “novel GABAAR-associated proteins” are highlighted. Arrows indicate the two most abundantly detected novel interactors, Camkv and Gpc1, which are selected for subsequent experimental validation.
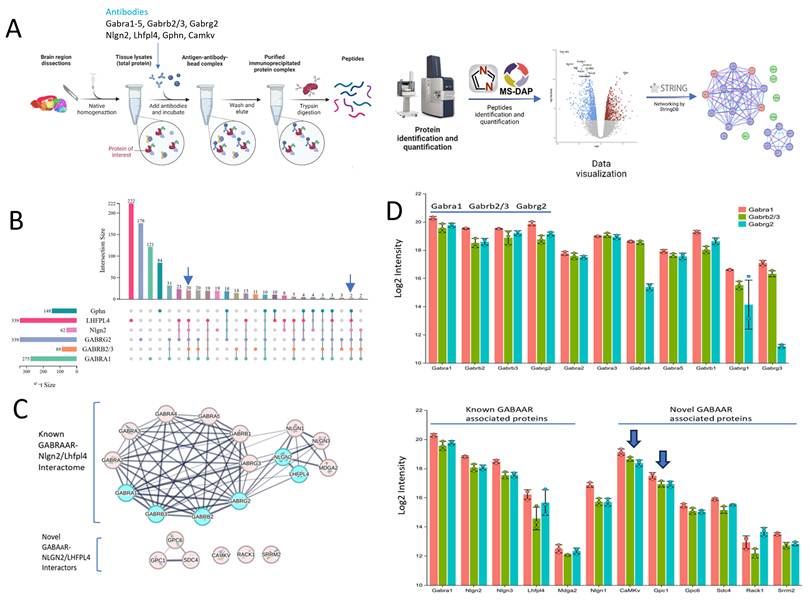
Each IP experiment targeting Gabra1 (α1), Gabrb2/3 (β2/3), Gabrg2 (γ2), Lhfpl4, Nlgn2, and Gphn identified tens to hundreds of proteins significantly enriched relative to the negative control IP for Glutamate Ionotropic Receptor AMPA Type Subunit GluA2/3 (Gria2/3). We selected Gria2/3 as the negative control because prior interactome studies of this protein failed to co-immunoprecipitate GABAAR subunits[32,51]. Differential enrichment analysis results are summarized in Supplementary Table S1 and S2. Figure 1B presents an UpSet diagram summarizing the overlap and uniqueness among proteins significantly enriched in IPs. The intersection of Gabra1, Gabrb2/3, Gabrg2, Lhfpl4, Nlgn2 IP sets yields 20 shared proteins, and intersection of Gabra1, Gabrb2/3, Gabrg2, Lhfpl4, Nlgn2, Gphn IP sets 2 shared proteins. To reveal how these proteins may be structurally or functionally connected, we applied STRING analysis and revealed the canonical GABAAR subunits and previously validated receptor-associated proteins (Fig. 1C). Evidently, the α1-α5, β1-β3, and γ2 subunits form a highly interconnected network. Among the six α subunit isoforms, α6 is notably absent, a finding consistent with its restricted cerebellar expression and negligible presence in cortical tissue[52,53]. The synaptic scaffolding and anchoring proteins including MAM Domain Containing Glycosylphosphatidylinositol Anchor 2 (Mdga2), neuroligins, and Lhfpl4 are also integrated into a tightly associated complex. Of particular interest is a distinct cluster composed of glypicans (Gpc1, Gpc6) and syndecan4 (Sdc4), all of which are cell-surface heparan sulfate proteoglycans (HSPGs). These HSPGs may collectively serve as a signaling hub that modulates neuronal adhesion to the extracellular matrix and potentially influences GABAAR synaptogenesis or stabilization. In addition, three proteins, Camkv, Receptor For Activated C Kinase 1 (Rack1), and Serine/Arginine Repetitive Matrix 2 (Srrm2), are enriched. These six proteins exhibit diverse molecular functions and represent candidates for novel GABAAR-associated proteins.
It is essential to recognize that all antibody-based experiments are inherently limited by antibody specificity and affinity, as well as physical accessibility of the target epitope. Collectively, these factors introduce the potential for both false-positive and false-negative results. In contrast, the overlap of shared proteins across multiple IP sets as demonstrated here substantially reduces the likelihood of false positives.
The GABAAR interactome generated from IP depicts in Figure 1C cluster all GABAAR subunits together as a composite network representing the totality of currently known physical interactions among them, despite the fact that individual GABAAR complexes are strictly pentameric. In the cerebral cortex, GABAARs are predominantly composed of two α subunits, two β subunits, and one γ or δ subunit. Quantitative proteomics data (Fig. 1D) confirm that the 2×α1/2×β2 or β3/1×γ2 receptor subtype is the most abundant configuration. These data also reveal the presence of additional, less prevalent subunit combinations including heteromeric assemblies such as α1/α2, α1/α3, α1/α4, and α1/α5 paired with various β and γ subunits. Among the scaffolding proteins, Nlgn2 displays the highest relative abundance. Among the newly identified GABAAR interactors, Camkv is the most abundant, followed by Gpc1 and Gpc6; Rack1 and Srrm2 are the least abundant.
The Gphn interactome exhibits substantially less overlap with other interactomes shown above. Notably, Gphn IP yields a distinct protein profile (Fig. S1, Table S2), specifically enriching the validated gephyrin-binding partners Collybistin (Arhgef9)[54]. It also shows co-precipitation of glycine receptor (GlyR) subunits, including Glra1, Glra2, Glra3, and Glrb, as well as their established interactor IQ Motif and Sec7 Domain ArfGEF 3 (Iqsec3)[55]. Furthermore, two Inhibitory Synaptic Factor proteins, Insyn1 and Insyn2a, are detected in Gphn IP, reinforcing gephyrin's role as a central organizing hub for diverse inhibitory postsynaptic specializations[56].
To investigate the interactomes of GABAARs associated with different α subunits, we performed IPs targeting the α1-α5 subunits. To elucidate the relationships among these subunits and their associated proteins, we generated a heatmap (Fig. 2) focused on proteins identified in Figure 1, with particular emphasis on candidate GABAAR-interacting proteins. Included for reference are Gphn and its binding partner Arhgef9, as well as Shisa7 and the AMPA receptor subunits Gria1 and 2. Given that protein intensities varied substantially across samples, for instance Lhfpl4 and Nlgn2 exhibit approximately a fivefold difference in abundance, we applied z-score normalization across each protein to generate the heatmap. This normalization ensures comparability across all variables by scaling them to a common distribution, thereby enhancing interpretability of co-enrichment patterns.
Heatmap of selected proteins from IP of GABAAR subunits and Gria2/3. The intensities were transformed by Zscore and plotted with correlation between proteins across all the IP. Proteins with missing values were imputed with an raw intensity of 5, which is lower than all measured intensities.
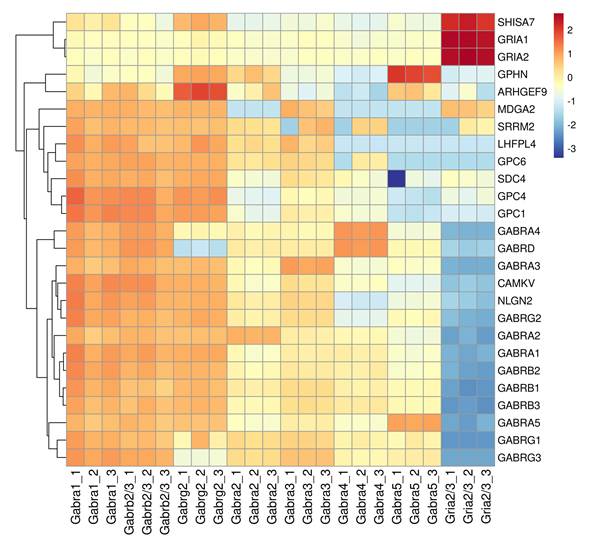
Clustering analysis reveals distinct functional groupings. While Gabra1, Gabrb2/3 and Gabrg2 share high levels of similarity, notable diferences are found in Gabrg2 having more Gphn/Arhgf9 and less or absent of Gabrg3, Gabrd and Gabra4. A second cluster comprises of Gpc1, 4, 5 Sdc4, and Lhfpl4, consistent with prior evidence indicating that Sdc4 and Gpc reside within the same protein complex (Fig. 1C)[57,58]. Gphn and Arhgef9 constitute a separate, well-defined cluster, aligning with established literature describing their stable interaction[59,60]. Finally, Shisa7 clusters robustly with Gria1, supporting its preferential association with excitatory glutamatergic receptors[61].
The heatmap further reveals several nuanced yet biologically compelling patterns. Notably, Gabra5 exhibit relatively high enrichment of Gphn and Arhgef9, concomitant with lower levels of Nlgn2 and Lhfpl4. Gabra2 also demonstrates modest enrichment of Gphn, a finding consistent with prior evidence indicating Gphn-dependent selective synaptic accumulation of α2-containing GABAA receptor complexes[62]. In contrast, subunits such as Gabra1 and Gabra3 display stronger associations with Nlgn2 and Lhfpl4 and show reduced enrichment of Gphn and Arhgef9. Moreover, the novel interactors identified in Figure 1 (Gpc1, Camkv, Srrm2, Sdc4) are more prominently detected in IP of Gabra1 and Gabra3, but less abundant in IP of Gabra4 and Gabra5. Mdga2 is another protein that is associated with both excitatory (Gria1 and 2) and inhibitory (Gabra1, Gabrb2/3, Gabrg2 and Gabra3) receptor subunits. Raw and normalized protein intensities are provided in Table S3.
In vitro interaction of novel GABAAR interactors Gpc1 and Camkv to GABRAAR
Among the putative GABAAR interactors (Figure 1), Rack1 emerges as the most plausible candidate, given its well-established role in regulating GABAergic neurotransmission[63]. In contrast, the involvement of Srrm2 is less certain, as it functions primarily as a nuclear splicing factor with no known direct role at synapses. Camkv and members of the glypican family have been predominantly reported in the context of excitatory synapses[58,64]. Strikingly, our data reveal that both Gpc and Camkv are significantly enriched with the inhibitory GABAAR complex, and at the higher intensities than Rack1 and Srrm2 (Fig. 1). Accordingly, we prioritize Gpc and Camkv for further investigation as an initial step toward elucidating their potential contributions to inhibitory neurotransmission.
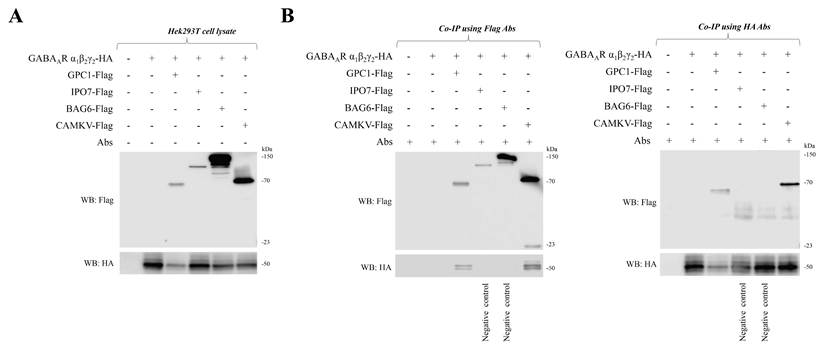
To independently validate that Gpc and Camkv are bona fide components of the GABAAR complex, we performed co-immunoprecipitation experiments in HEK293T cells to confirm their physical association with the GABAAR. Specifically, HEK293T cells were transfected to co-express hemagglutinin (HA)-tagged recombinant GABAAR α1, β2, and γ2 subunits together with Flag-tagged Camkv or Gpc1. As negative controls, we included two proteins previously identified in anti-GABAAR α1 immunoprecipitates but not significantly enriched, namely the BAG Cochaperone 6 (Bag6) and Importin 7 (Ipo7). Immunoblotting confirms robust expression of all transfected proteins at their expected molecular weights, detected via HA- and Flag-specific antibodies, respectively (Figure 3A). In co-IP assays using anti-Flag antibody for immunoprecipitation, both Camkv and Gpc1, but not Bag6 or Ipo7, were specifically pulled down with HA-tagged GABAAR α1β2γ2 subunits (Figure 3B, left blot). Reciprocal co-IP, using anti-HA antibody for immunoprecipitation and anti-Flag antibody for immunoblotting, further corroborates these interactions (Figure 3B, right blot). Collectively, these data provide biochemical evidence that Camkv or Gpc1 and the GABAAR α1β2γ2 receptor complex exist in a complex within a cellular environment in the absence of neuronal context or neuron-specific adaptor proteins.
The interactions of Camkv and Gpc1 with the recombinant GABAAR α1β2γ2 subtype validated in Hek293T cells. A) HEK293T cells were co-transfected with HA-tagged GABAAR α1, β2 and γ2 subunits with Flag-tagged Gpc1, Ipo7, Bag6, or Camkv. All co-transfected proteins were successfully expressed. B) Co-transfected Flag-tagged Gpc1 and Camkv on HEK293T cells show interaction with HA-tagged GABAAR subunit, but Flag-tagged Ipo7 or Bag6 does not.
Reversed IP on Camkv identified multiple protein complexes and implicates Camkv as a plural organizer of neurotransmission
Reversed immunoprecipitation is an alternative strategy to validate protein-protein interactions. Antibodies targeting Gpc and Camkv, respectively, were tested in IP assays; only the anti-Camkv antibody yielded a robust and specific signal. Consequently, Camkv was selected as the primary focus for subsequent investigation.
To determine whether the Camkv interactome is confined exclusively to GABAAR or extends to additional proteins, we performed anti-Camkv immunoprecipitation and compare the resulting interactors against three negative controls: IPs conducted with antibodies against Gria2/3, Bag6, and Ipo7. Bag6 and Ipo7 were chosen as negative controls based on prior experimental evidence demonstrating no physical interaction with Camkv (see Fig. 3). A protein-protein interaction network is constructed (Fig. 4) by integrating proteins consistently identified across all three comparative IP experiments, Camkv versus Gria2/3, Camkv versus Bag6, and Camkv versus Ipo7, using STRING database analysis with high-confidence interaction scoring.
Camkv protein networks. (A) The intersection of enriched proteins from the three comparisons Camkv-Gria2/3, Camkv-Bag6 and Camkv-Ipo7 were used to construct protein networks of Camkv. The four major subnetworks are magnified to facilitate visualization. (B) Tree format from the GO cellular component enrichment analysis. The subnetworks in A labeled in light blue and numbered 1-3 are mapped to the corresponding GO terms in the tree format in B.
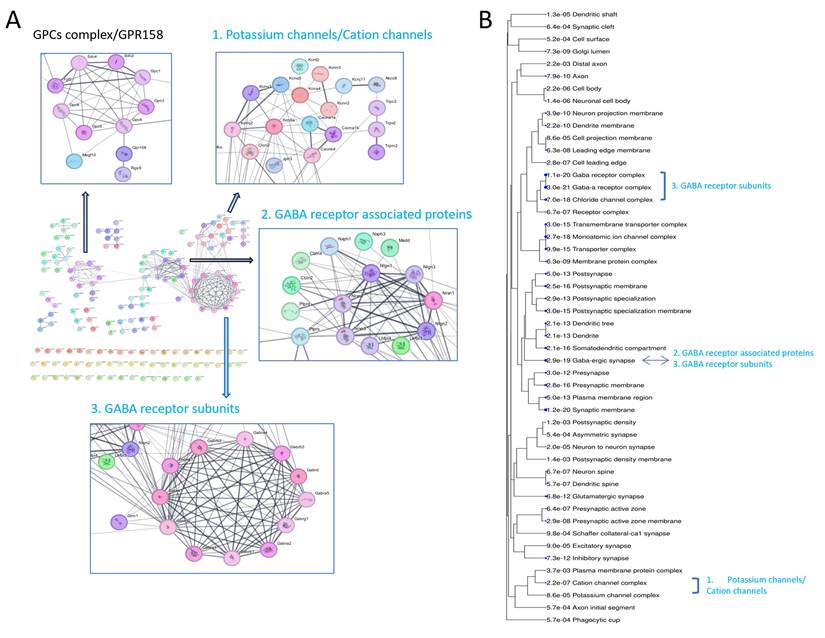
The dominant module within this network corresponds to the canonical GABAAR complex, comprising core subunits Gabra1-5, Gabrb1-3, Gabrg1-3, and Gabrd, along with key auxiliary and synaptic scaffolding proteins including Nlgn2, Neurexin 2 (Nrxn2), and Lhfpl4. Notably, Gabrg and Gabrd exhibit mutually exclusive expression patterns: Gabrg is predominantly incorporated into synaptic GABAARs, whereas Gabrd is selectively enriched in extrasynaptic GABAARs[65,66]. The Cerebellin Precursor Cbln2 and Cbln4, synaptic organizers essential for the formation and maintenance of inhibitory GABAergic synapses[67], are embedded within the Nlgn2-Nrxn2 subcomplex. Beyond canonical ionotropic inhibitory receptors, our analysis also identify Glutamate Metabotropic Receptor 1 (Grm1) and the G Protein-Coupled Receptor 158 (GPR158, also known as metabotropic glycine receptor, mGlyR)[68], suggesting that Camkv engages with a broader repertoire of neurotransmitter receptors. Additional modules include voltage-gated and ligand-gated potassium and calcium channels, as well as multiple members of the Gpc family.
We next performed GO enrichment analysis to characterize the cellular localization of the identified Camkv associated proteins. Results reveal significant enrichment for synaptic components, particularly the GABAergic synapse, and to a lesser extent cation channel complexes (Fig. 4B). These GO terms closely mirror the functional modules highlighted in the interaction network (Fig. 4A). Differential expression analyses comparing Camkv IP against each negative control (Camkv vs. Gria2/3; Camkv vs. Bag6; Camkv vs. Ipo7) are presented in Table S4. The full list of enriched proteins from each IP experiment, along with their pairwise and triple-wise overlaps across the three comparisons, is detailed in Table S5.
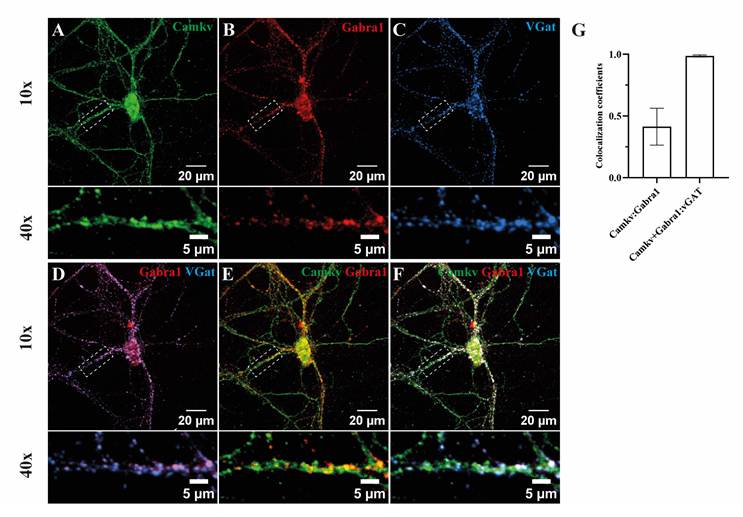
We next examined the subcellular localization of Camkv at dendritic and synaptic sites on cultured mouse hippocampal neurons. Camkv immunoreactivity is observed as large clusters along dendrites (Fig. 5A), in agreement with previously reported distribution in neurons[64]. GABAAR α1 immunoreactivity co-localizes with the inhibitory presynaptic maker protein vGAT (SLC32A1) (Fig. 5B-D), consistent with previously reported predominant postsynaptic localization of the α1 subunit[37,53]. Co-labeling of Camkv and GABAAR α1 subunit immunoreactivity is observed in many puncta (Fig. 5E-G). Quantitative analysis using Manders' coefficient demonstrates that approximately 45% of Camkv immunoreactivity co-localize with α1 (Fig. 5G), indicating that a substantial portion of Camkv is present at the inhibitory synapse. The wider distribution of Camkv than inhibitory synapse is consistent with its interaction with other protein complexes such as potassium and calcium channels and metabotropic glutamate receptors (Fig. 4).
Camkv colocalizes with α1 GABAAR at inhibitory synapses. The distribution of Camkv and GABAAR α1 subunits was investigated on cultured hippocampal neurons (A, B) and both subunits were co-stained with the inhibitory presynaptic marker protein vGAT (C). (D) The GABAAR α1 subunit was mainly synaptically localized opposing vGAT, where Camkv also often showed co-localization (E, F). (G) The Manders' coefficients of Camkv (green channel) with α1 subunit signal (red channel) and of colocalized Camkv and α1 subunit over vGAT (blue channel) was calculated; the latter one is indicated by Manders' coefficients as w/v GAT. The Manders' coefficients are shown ± s.e.m (n=4); Image scale bar = 20 μm; Zoom-in scale bar =5 μm.
Knockdown of Camkv did not affect the cellular proteome
The reverse IP on Camkv demonstrated that it is a multi-functional proteins (Fig. 4) that possibly regulates diverse synaptic functions in addition to GABAAR. To gain insights into the probable functions of Camkv, we investigated whether the depletion of Camkv would lead to quantitative changes in the neuronal proteome. To achieve this, Camkv knockdown in cultured hippocampal neurons at DIV2 was generated using the CRISPR/Cas9 system, targeting three different exon sequences of Camkv[69]. The efficiency of each knockdown is validated by immunoblotting the cell lysate for Camkv at DIV14 (Fig. 6A-B). The infection rate of each knockdown is determined via immuno-staining with anti-Cas9 antibody in another batch of cells and each show an infection rate >85%. Among the three gRNA (KD1-3), KD2 and KD3 reduced the level of Camkv, whereas KD1 failed to induce significant reduction of Camkv.
Proteome analysis of Camkv CRISPR-Cas9 knockdown in neuronal cell culture. (A) Immunoblot analysis of the efficiency of CRISPR/Cas9 knockdown of Camkv expression in stably transfected hippocampal neurons. Protein input is quantified in-gel using 2,2,2-Trichloroethanol and normalized to the total protein amount. (B) Relative protein expression of Camkv in each knockdown cell culture represented as mean ± s.e.m. Statistical significance by two tailed Student's t-tests: **P<0.01. All bar graphs, n=4. (C-E) Overview of differentially expressed proteins as shown by volcano plots in comparison of wild type to (C) knockdown 1, (D) knockdown 2, and (E) knockdown 3. (F) Geneset GO enrichment analysis (GOAT) from the comparisons of WT-KD1, WT-KD2 and WT-KD3 showing their nGene and adjusted p-value from representative GO terms of cellular component.
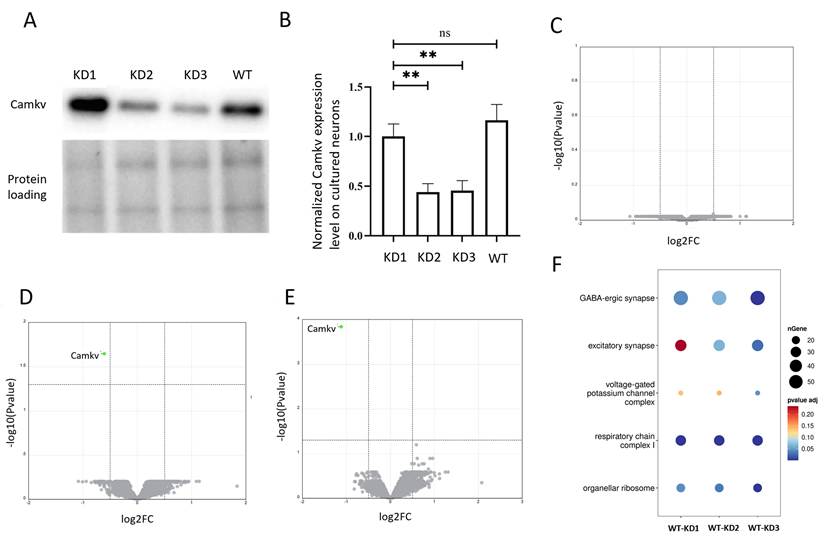
Quantitative proteomics is performed on WT, KD1, KD2 and KD3 cell lysates (n=4 per condition). Volcano plots of WT-KD1, WT-KD2 and WT-KD3 are shown in Fig. 6C-E (Table S6). Both KD2 and KD3 show significant decrease of Camkv, with a higher fold difference for KD3. While Camkv is the only significantly regulated protein, comparison of protein -log(Pvalue) across the three groups reveal a upward shift pattern with WT-KD3 > WT-KD2 > WT-KD1 (Fig. 6C-E, Table S7), which correlates to the reduced Camkv level with KD3 > KD2 > KD1.
To examine if there are cellular components affected by global yet subtle protein changes that could not be detected by overxpression GO enrichment analysis, we used a geneset enrichment GO analysis platform, GOAT[43]. GOAT is a parameter-free algorithm for gene set enrichment analysis of pre-ranked gene lists. It takes into account the fold changes of all the proteins and matches them to the gene sets from each biological process/cellular component/molecular function annotated in the GO. The complete output from GOAT analysis is presented in Table S8. Fig. 6F shows the selected cellular component GO terms, where GABA-ergic synapse, excitatory synapse, and voltage-gated potassium channel complex are significantly regulated in WT-KD3, less so in WT-KD2, and least in WT-KD1. This trend correlates well to the higher down regulation of Camkv in KD3 than KD2, and the changes may be underlied by the physical interaction of CamkV to inhibitory receptors and presumably to proteins in the excitatory synapses, as well as to the cation channls (see Fig. 4).
Knock down of Camkv affected surface expression of GABAAR
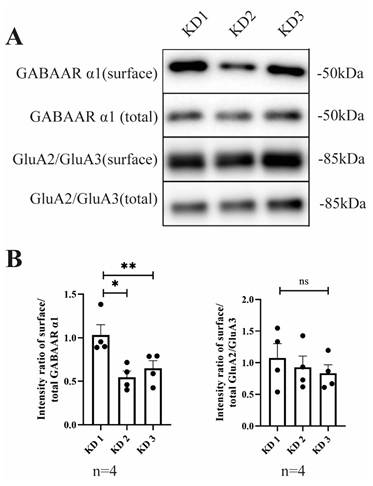
We next investigate the effect of CaMKv knockdown on the cell surface expression level of GABAAR in cultured hippocampal neurons using cell-surface biotinylation and immunoblotting. The ratio of surface to total receptor is calculated to assess the relative receptor surface expression level (Fig. 7A). Interestingly, KD2 and KD3 show significant reduction of cell surface GABAARs with foldchange of 0.53 and 0.62, respectively, compared to KD1. In contrast, AMPA receptor surface expression level does not show significant change (Fig. 7B) indicative of the specificity of the action of Camkv. Taken together, these findings suggest that Camkv may play a role in promoting GABAAR surface delivery and/or the maintenance of the receptor at the membrane.
Surface expression level measurement of the GABAAR and AMPA receptor. A) Immunoblotting of GABAAR α1 and GluA2/3 (Gria2/3) from neuronal total lysate and biotinylated pulled-down cell surface proteins. B) Quantification of the ratio of surface over total receptor. KD1-3: knockdown 1-3; WT: wild type. GABAAR α1 blots, n=4; GluA2/3 blots, n=4. Bar graphs show normalized ratio to WT, error bars represent s.e.m. *p-value <0.05, ** p value < 0.01.
Discussion
In this study we carried out IP targeting GABAAR subunits Gabra1, Gabrb2/3, and Gabrg2, and synaptic scaffolding proteins Nlgn2, Lhfpl4, and Gphn in the first experimental set. We subsequently targeted Gabra1-5 subunits, as well as the novel interactor Camkv. Tens to hundreds of enriched proteins are consistently detected across samples and cluster into several distinct protein interaction networks. Based on their mass spectrometric intensities, protein abundances can be semi-quantified. Qualitative and quantitative differences among identified proteins across bait groups likely reflect bait-specific interactors, enabling functional inference. Thus, our large-scale datasets constitute a valuable resource for studying inhibitory synapse architecture and composition.
To align our findings to the previously reported GABAAR subunits and associated proteins, we compare GABAAR interacting proteins/inhibitory synapse organizers as described in a recent review to our IP data (Table 1)[70]. We reveal good agreement of enriched proteins across different IP sets with only a few proteins showing IP set specific enrichment. Furthermore, other members of the previously reported proteins from the same families are detected. Gphn, a inhibitory marker protein, has a few overlaps with other IP sets, where the detected proteins Gabra2, Arhgef9 and Gphn may form a trimeric complex[54].
The IP enriched proteins compared to a selection of reported GABAAR associated proteins.
| Bait | ||||||
|---|---|---|---|---|---|---|
| Prey | Gphn | Lhfpl4 | Nlgn2 | Gabrg2 | Gabra1 | Gabrb2/3 |
| Arhgef9 | y | y | y | |||
| Cbln4 | y (1.2) | |||||
| Cdh12 | ||||||
| Cdh13 | ||||||
| Clptm1 | ||||||
| Clstn2 | Clstn1 | Clstn1, Clstn1 | Clstn1 | |||
| Dag1 | ||||||
| ErbB4 | ||||||
| Gabarap | ||||||
| Gabra1 | y | y | y | y, y | y | |
| Gabra2 | y | y | y | y | y, y | y |
| Gabra3 | y | y | y | y, y | y | |
| Gabra4 | y | y | y | y | y, y | y |
| Gabra5 | y | y | y | y, y | y | |
| Gabrb1 | y | y | y | y, y | y | |
| Gabrb2 | y | y | y | y, y | y | |
| Gabrb3 | y | y | y | y, y | y | |
| Gabrd | y, y | y | ||||
| Gabrg1 | y | y | y, y | y | ||
| Gabrg2 | y | y | y | y, y | y | |
| Gabrg3 | y | y | y | y, y | y | |
| Gphn | y | y | y | |||
| IgSF11 | ||||||
| IgSF9b | y | |||||
| InSyn1 | y (2a) | y | ||||
| Iqsc3 | y | y | ||||
| Lhfpl4 | y | y | y | y (3), y(3) | y | |
| Magi2 | y (3) | |||||
| Mdga1 | ||||||
| Mdga2 | y | y | y | y, y | y | |
| Nlgn1 | y | y | y | y, y | y | |
| Nlgn2 | y | y | y | y, y | y | |
| Nlgn3 | y | y | y | y | y, y | y |
| Nlgn4 | y | y | y | y, y | y | |
| Nrg1 | ||||||
| Nrxn1 | y | y | y | y, y | y | |
| Nrxn2 | y | y | y, y | y | ||
| Nrxn3 | y | y | y, y | y | ||
| PlxnB2 | ||||||
| Rdx | ||||||
| Sema4b | Sema4g | |||||
| Shisa7 | ||||||
| Slitrk3 | y (4) | y (4), y (1, 4) | ||||
| Srgap2 | Srgap1 | Srgap3 | ||||
| Tmem132B | ||||||
| Wwc2 | Wwc1 | |||||
y represents the presence of the selected protein in the IP, y is the second independent IP set from Gabra1.
Different members of the same families are represented by their gene names.
Individual GABAA receptors are strictly pentameric, with the most prevalent cortical configuration being 2×α1/2×β2-3/1×γ2. Nonetheless, we detected diverse α subunits including α1 through α5 in every IP of GABAAR subunits. This indicates substantial heterogeneity in receptor subtypes, encompassing assemblies with varied subunit stoichiometries and combinations such as heteromeric α1/α2, α1/α3, α1/α4, and α1/α5 pairings co-assembled with multiple β and γ subunit isoforms, consistent with prior studies[71,72].
Using a state-of-the-art interaction proteomics approach combined with large-scale IP experiments as previously employed to map components of well-defined protein complexes[34,37,73,74], we successfully identified six candidate proteins as novel interactors to the most adundant GABAAR subtype of α1β2/3γ2. These proteins are also present in IP of Gabra3 but less so in Gabra2, 4 and 5. Notably, members of Gpc family and Camkv emerge as the most prominent candidates and were experimentally validated to physically interact with GABAAR in HEK293 cells. In parallel, imaging and preliminary functional analyses alongside IP-based mapping of the Camkv interactome suggest that Camkv may contributes to multiple distinct physiological roles, including (i) modulation of GABAAR-mediated inhibitory synaptic currents, partly through regulation of receptor membrane trafficking or synaptic anchoring, (ii) regulation of neuronal excitability via modulation of cation channels, and (iii) influence on metabotropic receptors-dependent neuroplasticity. Collectively, these multifaceted actions may give rise to combinatorial electrophysiological outcomes characterized by precise spatiotemporal dynamics, the phenomena that warrant direct experimental investigation in future studies. Intriguingly, a recent study utilizing DARPin-based molecular tools localized Camkv within Gphn-containing postsynaptic scaffolds[75]. Furthermore, a 2026 preprint (bioRxiv, doi: 10.64898/2026.01.15.699634) applied plasma membrane-targeted photo-proximity labeling to map receptor-specific intracellular interactomes in mouse and human brain tissue, independently confirming the direct GABAAR-Camkv interaction.
Members of the Gpc and Camkv protein families have been implicated in excitatory neurotransmission. Here, we extend this understanding by identifying both proteins as having dual synaptic functions operating at both excitatory and inhibitory synapses. Although the core proteomes of excitatory and inhibitory synapses display considerable structural overlap[34,47,76,77], those associated with ligand-gated ion channels diverge significantly. Both Camkv and Gpc are physically associated with GABAA receptors containing either the α1 or α3 subunit. Notably, Camkv also co-immunoprecipitated with metabotropic glutamate receptors, metabotropic glycine receptors (mGlyR), and a broad spectrum of ion channels, underscoring its multifaceted roles in synaptic signaling. Future work should include in vivo functional analyses using conditional or global knockout models combined with electrophysiological recordings and behavioral assays to precisely delineate the distinct contributions of Camkv and Gpc to excitatory versus inhibitory synaptic transmission.
Supplementary Material
Supplementary figures.

Supplementary table 1: MSDAP sorted, GABRA1, GABRB, GABRG.
Supplementary table 2: MSDAP sorted, GABRA1, LHFPL4, Nlgn2, Gphn.
Supplementary table 3: GABRA1-5 group specific filter.
Supplementary table 4: MSDAP camkv sorted, Bag Ipo, Gria.
Supplementary table 5: Venn camkv.
Supplementary table 6: Volcano plot, knockdown camkv cell culture.
Supplementary table 7: Knockdown camkv cell culture MSDAP sorted for GO analysis.
Supplementary table 8: Knockdown camkv GOAT analysis.
Acknowledgements
We thank Remco Klaassen for his expert technical assistance. The Vrije Universiteit Amsterdam supported this work.
Author contributions
K.W.L.: conceptualization, design of the experiments and analysis of the data. M.C. and K.W.L.: immunoprecipitation, Western blot, and mass spectrometry experiments, quantification of data, and analysis of the data. M.C.: cell culture experiments. K.W.L., F.K., M.A.G.-L., A.B.S., and M.C.: interpretation of the data. M.C., K.W.L., F.K., M.A.G.-L., and A.B.S.: drafting and critical revision of the article. All authors have read and agreed to the published version of the manuscript.
Data availability
Data in this study are included in the supplementary. The raw data supporting the conclusions of this article will be made available by the authors, without undue reservation. The mass spectrometry proteomics data have been deposited to the ProteomeXchange Consortium (https://proteomecentral.proteomexchange.org) via the iProX partner repository[49,50] with the dataset identifier PXD048233. All data will be made public once the manuscript is accepted for publication.
Competing Interests
The authors have declared that no competing interest exists.
References
1. Fritschy JM, Brünig I. Formation and plasticity of GABAergic synapses: physiological mechanisms and pathophysiological implications. Pharmacol Ther. 2003;98(3):299-323 doi:10.1016/s0163-7258(03)00037-8
2. Thomas P, Mortensen M, Hosie AM, Smart TG. Dynamic mobility of functional GABAA receptors at inhibitory synapses. Nat Neurosci. 2005;8(7):889-897 doi:10.1038/nn1483
3. Marín O. Interneuron dysfunction in psychiatric disorders. Nat Rev Neurosci. 2012 13(2). doi:10.1038/nrn3155
4. Tang X, Jaenisch R, Sur M. The role of GABAergic signalling in neurodevelopmental disorders. Nat Rev Neurosci. 2021 22(5). doi:10.1038/s41583-021-00443-x
5. Castellano D, Shepard RD, Lu W. Looking for Novelty in an “Old” Receptor: Recent Advances Toward Our Understanding of GABAARs and Their Implications in Receptor Pharmacology. Front Neurosci. 2021;14. doi:10.3389/fnins. 2020 616298
6. Rudolph U, Möhler H. GABAA receptor subtypes: Therapeutic potential in down syndrome, affective disorders, schizophrenia, and autism. Annu Rev Pharmacol Toxicol. 2014 54. doi:10.1146/annurev-pharmtox-011613-135947
7. Sieghart W, Sperk G. Subunit composition, distribution and function of GABA(A) receptor subtypes. Curr Top Med Chem. 2002;2(8):795-816 doi:10.2174/1568026023393507
8. Olsen RW, Sieghart W. GABA A receptors: subtypes provide diversity of function and pharmacology. Neuropharmacology. 2009;56(1):141-148 doi:10.1016/j.neuropharm.2008.07.045
9. Sieghart W, Fuchs K, Tretter V. et al. Structure and subunit composition of GABA(A) receptors. Neurochem Int. 1999;34(5):379-385 doi:10.1016/s0197-0186(99)00045-5
10. Farrant M, Nusser Z. Variations on an inhibitory theme: phasic and tonic activation of GABA(A) receptors. Nat Rev Neurosci. 2005;6(3):215-229 doi:10.1038/nrn1625
11. Mody I. Distinguishing between GABA(A) receptors responsible for tonic and phasic conductances. Neurochem Res. 2001;26(8-9):907-913 doi:10.1023/a:1012376215967
12. Lüscher B, Keller CA. Regulation of GABAA receptor trafficking, channel activity, and functional plasticity of inhibitory synapses. Pharmacol Ther. 2004;102(3):195-221 doi:10.1016/j.pharmthera.2004.04.003
13. Fang C, Deng L, Keller CA. et al. GODZ-mediated palmitoylation of GABAA receptors is required for normal assembly and function of GABAergic inhibitory synapses. Journal of Neuroscience. 2006;26(49). doi:10.1523/JNEUROSCI.4214-06. 2006
14. O'Sullivan GA, Kneussel M, Elazar Z, Betz H. GABARAP is not essential for GABA receptor targeting to the synapse. Eur J Neurosci. 2005;22(10):2644-2648 doi:10.1111/j.1460-9568.2005.04448.x
15. Kittler JT, Rostaing P, Schiavo G. et al. The subcellular distribution of GABARAP and its ability to interact with NSF suggest a role for this protein in the intracellular transport of GABA(A) receptors. Mol Cell Neurosci. 2001;18(1):13-25 doi:10.1006/mcne.2001.1005
16. Ali H, Marth L, Krueger-Burg D. Neuroligin-2 as a central organizer of inhibitory synapses in health and disease. Sci Signal. 2020 13(663). doi:10.1126/SCISIGNAL.ABD8379
17. Yamasaki T, Hoyos-Ramirez E, Martenson JS, Morimoto-Tomita M, Tomita S. GARLH Family Proteins Stabilize GABA(A) Receptors at Synapses. Neuron. 2017;93(5):1138-1152.e6 doi:10.1016/j.neuron.2017.02.023
18. Chen ZW, Olsen RW. GABAA receptor associated proteins: a key factor regulating GABAA receptor function. J Neurochem. 2007;100(2):279-294 doi:10.1111/j.1471-4159.2006.04206.x
19. Wu M, Tian HL, Liu X, Lai JHC, Du S, Xia J. Impairment of Inhibitory Synapse Formation and Motor Behavior in Mice Lacking the NL2 Binding Partner LHFPL4/GARLH4. Cell Rep. 2018;23(6):1691-1705 doi:10.1016/j.celrep.2018.04.015
20. Ge Y, Kang Y, Cassidy RM. et al. Clptm1 Limits Forward Trafficking of GABA(A) Receptors to Scale Inhibitory Synaptic Strength. Neuron. 2018;97(3):596-610.e8 doi:10.1016/j.neuron.2017.12.038
21. Wang H, Bedford FK, Brandon NJ, Moss SJ, Olsen RW. GABAA-receptor-associated protein links GABAA receptors and the cytoskeleton. Nature. 1999;397(6714):69-72 doi:10.1038/16264
22. Specht CG, Izeddin I, Rodriguez PC. et al. Quantitative nanoscopy of inhibitory synapses: counting gephyrin molecules and receptor binding sites. Neuron. 2013;79(2):308-321 doi:10.1016/j.neuron.2013.05.013
23. Loebrich S, Bähring R, Katsuno T, Tsukita S, Kneussel M. Activated radixin is essential for GABAA receptor alpha5 subunit anchoring at the actin cytoskeleton. EMBO J. 2006;25(5):987-999 doi:10.1038/sj.emboj.7600995
24. Hines RM, Maric HM, Hines DJ. et al. Developmental seizures and mortality result from reducing GABA(A) receptor α2-subunit interaction with collybistin. Nat Commun. 2018;9(1):3130 doi:10.1038/s41467-018-05481-1
25. Davenport EC, Pendolino V, Kontou G. et al. An Essential Role for the Tetraspanin LHFPL4 in the Cell-Type-Specific Targeting and Clustering of Synaptic GABA(A) Receptors. Cell Rep. 2017;21(1):70-83 doi:10.1016/j.celrep.2017.09.025
26. Poulopoulos A, Aramuni G, Meyer G. et al. Neuroligin 2 drives postsynaptic assembly at perisomatic inhibitory synapses through gephyrin and collybistin. Neuron. 2009;63(5):628-642 doi:10.1016/j.neuron.2009.08.023
27. Martenson JS, Yamasaki T, Chaudhury NH, Albrecht D, Tomita S. Assembly rules for GABA(A) receptor complexes in the brain. Elife. 2017 6. doi:10.7554/eLife.27443
28. Leil TA, Chen ZW, Chang CSS, Olsen RW. GABAA receptor-associated protein traffics GABAA receptors to the plasma membrane in neurons. J Neurosci. 2004;24(50):11429-11438 doi:10.1523/JNEUROSCI.3355-04.2004
29. Balasubramanian S, Teissére JA, Raju D V, Hall RA. Hetero-oligomerization between GABAA and GABAB receptors regulates GABAB receptor trafficking. J Biol Chem. 2004;279(18):18840-18850 doi:10.1074/jbc.M313470200
30. Nakamura Y, Morrow DH, Modgil A. et al. Proteomic characterization of inhibitory synapses using a novel phluorin-tagged γ-aminobutyric acid receptor, type a (gabaa ), α2 subunit knock-in mouse. Journal of Biological Chemistry. 2016 291(23). doi:10.1074/jbc.M116.724443
31. Kneussel M, Haverkamp S, Fuhrmann JC. et al. The γ-aminobutyric acid type A receptor (GABAAR)-associated protein GABARAP interacts with gephyrin but is not involved in receptor anchoring at the synapse. Proc Natl Acad Sci U S A. 2000 97(15). doi:10.1073/pnas.97.15.8594
32. Han W, Li J, Pelkey KA. et al. Shisa7 is a GABAAreceptor auxiliary subunit controlling benzodiazepine actions. Science (1979). 2019 366(6462). doi:10.1126/science.aax5719
33. Chen N, Pandya NJ, Koopmans F. et al. Interaction proteomics reveals brain region-specific AMPA receptor complexes. J Proteome Res. 2014;13(12):5695-5706 doi:10.1021/pr500697b
34. van der Spek SJF, Koopmans F, Paliukhovich I. et al. Glycine Receptor Complex Analysis Using Immunoprecipitation-Blue Native Gel Electrophoresis-Mass Spectrometry. Proteomics. 2020;20(3-4):e1900403 doi:10.1002/pmic.201900403
35. Thanou E, Ganz A, Pita-Illobre D. et al. Proteomics of post mortem brains in early- and late-onset Alzheimer's disease: Unraveling differential Aβ effects and potential AD biomarkers. Alzheimer's & Dementia. 2026;22(7):e71662 doi:https://doi.org/10.1002/alz.71662
36. Thanou E, Koopmans F, Pita-Illobre D. et al. Suspension TRAPping Filter (sTRAP) Sample Preparation for Quantitative Proteomics in the Low µg Input Range Using a Plasmid DNA Micro-Spin Column: Analysis of the Hippocampus from the 5xFAD Alzheimer’s Disease Mouse Model. Cells. 2023 12(9). doi:10.3390/cells12091242
37. Chen M, Koopmans F, Paliukhovich I. et al. Blue Native PAGE-Antibody Shift in Conjunction with Mass Spectrometry to Reveal Protein Subcomplexes: Detection of a Cerebellar α1/α6-Subunits Containing γ-Aminobutyric Acid Type A Receptor Subtype. Int J Mol Sci. 2023;24(8):7632 doi:10.3390/ijms24087632
38. Demichev V, Messner CB, Vernardis SI, Lilley KS, Ralser M. DIA-NN: neural networks and interference correction enable deep proteome coverage in high throughput. Nat Methods. 2020;17(1):41-44 doi:10.1038/s41592-019-0638-x
39. Koopmans F, Li KW, Klaassen R V, Smit AB. MS-DAP Platform for Downstream Data Analysis of Label-Free Proteomics Uncovers Optimal Workflows in Benchmark Data Sets and Increased Sensitivity in Analysis of Alzheimer's Biomarker Data. J Proteome Res. 2023 22(2). doi:10.1021/acs.jproteome.2c00513
40. Szklarczyk D, Kirsch R, Koutrouli M. et al. The STRING database in 2023: protein-protein association networks and functional enrichment analyses for any sequenced genome of interest. Nucleic Acids Res. 2023 51(1 D). doi:10.1093/nar/gkac1000
41. Ge SX, Jung D, Jung D, Yao R. ShinyGO: A graphical gene-set enrichment tool for animals and plants. Bioinformatics. 2020 36(8). doi:10.1093/bioinformatics/btz931
42. Lyu F, Han F, Ge C. et al. OmicStudio: A composable bioinformatics cloud platform with real-time feedback that can generate high-quality graphs for publication. iMeta. 2023 2(1). doi:10.1002/imt2.85
43. Koopmans F. GOAT: efficient and robust identification of gene set enrichment. Commun Biol. 2024 7(1). doi:10.1038/s42003-024-06454-5
44. Grosskreutz J, Zoerner A, Schlesinger F, Krampfl K, Dengler R, Buffer J. Kinetic properties of human AMPA-type glutamate receptors expressed in HEK293 cells. European Journal of Neuroscience. 2003;17(6). doi:10.1046/j.1460-9568. 2003 02531.x
45. Beaudoin GMJ 3rd, Lee SH, Singh D. et al. Culturing pyramidal neurons from the early postnatal mouse hippocampus and cortex. Nat Protoc. 2012;7(9):1741-1754 doi:10.1038/nprot.2012.099
46. Bolte S, Cordelières FP. A guided tour into subcellular colocalization analysis in light microscopy. J Microsc. 2006;224(Pt 3):213-232 doi:10.1111/j.1365-2818.2006.01706.x
47. Chen M, Koopmans F, Gonzalez-Lozano MA, Smit AB, Li KW. Brain Region Differences in α1- and α5-Subunit-Containing GABAA Receptor Proteomes Revealed with Affinity Purification and Blue Native PAGE Proteomics. Cells. 2024 13(1). doi:10.3390/cells13010014
48. Rosato M, Gebuis T, Paliukhovich I. et al. A Combined Cellomics and Proteomics Approach to Uncover Neuronal Pathways to Psychiatric Disorder BT - Neuroproteomics. In: Li KW, ed. Springer New York. 2019:199-215 doi:10.1007/978-1-4939-9662-9_16
49. Ma J, Chen T, Wu S. et al. Iprox: An integrated proteome resource. Nucleic Acids Res. 2019 47(D1). doi:10.1093/nar/gky869
50. Chen T, Ma J, Liu Y. et al. iProX in 2021: Connecting proteomics data sharing with big data. Nucleic Acids Res. 2022 50(D1). doi:10.1093/nar/gkab1081
51. van der Spek SJF, Pandya NJ, Koopmans F. et al. Expression and Interaction Proteomics of GluA1- and GluA3-Subunit-Containing AMPARs Reveal Distinct Protein Composition. Cells. 2022 11(22). doi:10.3390/cells11223648
52. Scholze P, Pökl M, Längle S, Steudle F, Fabjan J, Ernst M. Two Distinct Populations of α1α6-Containing GABAA-Receptors in Rat Cerebellum. Front Synaptic Neurosci. 2020;12:43 doi:10.3389/fnsyn.2020.591129
53. Pirker S, Schwarzer C, Wieselthaler A, Sieghart W, Sperk G. GABA(A) receptors: immunocytochemical distribution of 13 subunits in the adult rat brain. Neuroscience. 2000;101(4):815-850 doi:10.1016/s0306-4522(00)00442-5
54. Saiepour L, Fuchs C, Patrizi A, Sassoè-Pognetto M, Harvey RJ, Harvey K. Complex role of collybistin and gephyrin in GABAa receptor clustering. Journal of Biological Chemistry. 2010 285(38). doi:10.1074/jbc.M110.121368
55. Kim S, Kim H, Park D. et al. Loss of IQSEC3 Disrupts GABAergic Synapse Maintenance and Decreases Somatostatin Expression in the Hippocampus. Cell Rep. 2020;30(6). doi:10.1016/j. celrep. 2020 01.053
56. Uezu A, Kanak DJ, Bradshaw TWA. et al. Identification of an elaborate complex mediating postsynaptic inhibition. Science. 2016;353(6304):1123-1129 doi:10.1126/science.aag0821
57. Oikari LE, Okolicsanyi RK, Qin A, Yu C, Griffiths LR, Haupt LM. Cell surface heparan sulfate proteoglycans as novel markers of human neural stem cell fate determination. Stem Cell Res. 2016;16(1). doi:10.1016/j. scr. 2015 12.011
58. Jen YHL, Musacchio M, Lander AD. Glypican-1 controls brain size through regulation of fibroblast growth factor signaling in early neurogenesis. Neural Dev. 2009;4:33 doi:10.1186/1749-8104-4-33
59. Tretter V, Mukherjee J, Maric HM, Schindelin H, Sieghart W, Moss SJ. Gephyrin, the enigmatic organizer at GABAergic synapses. Front Cell Neurosci. 2012;6:23 doi:10.3389/fncel.2012.00023
60. Choii G, Ko J. Gephyrin: a central GABAergic synapse organizer. Exp Mol Med. 2015;47(4):e158-e158 doi:10.1038/emm.2015.5
61. Schmitz LJM, Klaassen R V, Ruiperez-Alonso M. et al. The AMPA receptor-associated protein Shisa7 regulates hippocampal synaptic function and contextual memory. Elife. 2017 6. doi:10.7554/eLife.24192
62. Tretter V, Jacob TC, Mukherjee J, Fritschy JM, Pangalos MN, Moss SJ. The clustering of GABAA receptor subtypes at inhibitory synapses is facilitated via the direct binding of receptor α2 subunits to gephyrin. Journal of Neuroscience. 2008;28(6). doi:10.1523/JNEUROSCI.5050-07. 2008
63. Brandon NJ, Jovanovic JN, Smart TG, Moss SJ. Receptor for activated C kinase-1 facilitates protein kinase C-dependent phosphorylation and functional modulation of GABAA receptors with the activation of G-protein-coupled receptors. Journal of Neuroscience. 2002;22(15). doi:10.1523/jneurosci.22-15-06353. 2002
64. Liang Z, Zhan Y, Shen Y. et al. The pseudokinase CaMKv is required for the activity-dependent maintenance of dendritic spines. Nat Commun. 2016;7(1):13282 doi:10.1038/ncomms13282
65. Bogdanov Y, Michels G, Armstrong-Gold C. et al. Synaptic GABAA receptors are directly recruited from their extrasynaptic counterparts. EMBO J. 2006;25(18):4381-4389 doi:10.1038/sj.emboj.7601309
66. Chuang SH, Reddy DS. Genetic and molecular regulation of extrasynaptic GABA-A receptors in the brain: Therapeutic insights for epilepsy. Journal of Pharmacology and Experimental Therapeutics. 2018 364(2). doi:10.1124/jpet.117.244673
67. Seigneur E, Polepalli JS, Südhof TC. Cbln2 and Cbln4 are expressed in distinct medial habenula-interpeduncular projections and contribute to different behavioral outputs. Proc Natl Acad Sci U S A. 2018 115(43). doi:10.1073/pnas.1811086115
68. Laboute T, Zucca S, Holcomb M. et al. Orphan receptor GPR158 serves as a metabotropic glycine receptor: mGlyR. Science (1979). 2023 379(6639). doi:10.1126/science.add7150
69. Cong L, Ran FA, Cox D. et al. Multiplex genome engineering using CRISPR/Cas systems. Science. 2013;339(6121):819-823 doi:10.1126/science.1231143
70. Dilja Krueger-Burg. Understanding GABAergic synapse diversity and its implications for GABAergic pharmacotherapy. Trends Neurosci. 2025;48(1):47-61
71. Tretter V, Ehya N, Fuchs K, Sieghart W. Stoichiometry and assembly of a recombinant GABAA receptor subtype. J Neurosci. 1997;17(8):2728-2737 doi:10.1523/JNEUROSCI.17-08-02728.1997
72. Fritschy JM, Mohler H. GABAA-receptor heterogeneity in the adult rat brain: differential regional and cellular distribution of seven major subunits. J Comp Neurol. 1995;359(1):154-194 doi:10.1002/cne.903590111
73. Fu Z, Rais Y, Drabovich AP. Immunoprecipitation-targeted proteomics assays facilitate rational development of SARS-CoV-2 serological diagnostics. medRxiv. Published online January 1, 2021:2021.10.25.21265408. doi:10.1101/2021.10.25.21265408.
74. Jensen P, Patel B, Smith S, Sabnis R, Kaboord B. Improved Immunoprecipitation to Mass Spectrometry Method for the Enrichment of Low-Abundant Protein Targets. In: Methods in Molecular Biology. Vol 2261. 2021 doi:10.1007/978-1-0716-1186-9_14
75. Campbell BFN, Dittmann A, Dreier B, Plückthun A, Tyagarajan SK. A DARPin-based molecular toolset to probe gephyrin and inhibitory synapse biology. Elife. 2022 11. doi:10.7554/eLife.80895
76. Laßek M, Weingarten J, Volknandt W. The synaptic proteome. Cell Tissue Res. 2015;359(1):255-265 doi:10.1007/s00441-014-1943-4
77. Chang RYK, Etheridge N, Nouwens AS, Dodd PR. SWATH analysis of the synaptic proteome in Alzheimer's disease. Neurochem Int. 2015;87:1-12 doi:10.1016/j.neuint.2015.04.004
Author contact
Corresponding author: Email: k.w.linl.