Impact Factor ISSN: 1449-2288




Int J Biol Sci 2027; 23(1):489-506. doi:10.7150/ijbs.138723 This issue Cite
Research Paper
Biochemical and Immunological Properties of Engineered Low-Immunogenic Staphylokinases for Next-Generation Thrombolytic Therapy
Alan Strunga1,2, Michaela Peskova2,3,4, Michal Krupka5, Katerina Zachova5, Lenka Sindlerova2,3, Nikola Neumeisterova2,3, Jan Mican1,2, Jan Vitecek2,3, David Bednar1,2, Stanislav Mazurenko1,2, Lukas Kubala2,3, Milan Raska5, Jiri Damborsky1,2  , Zbynek Prokop1,2
1. Loschmidt Laboratories, Department of Experimental Biology and RECETOX, Faculty of Science, Masaryk University, Kamenice 5, 625 00 Brno, Czech Republic
2. International Clinical Research Center, St. Anne's University Hospital Brno, Pekarska 53, 656 91 Brno, Czech Republic
3. Institute of Biophysics of the Czech Academy of Sciences, Kralovopolska 135, 612 65 Brno, Czech Republic
4. Department of Biochemistry, Faculty of Science, Masaryk University, Kamenice 5, 625 00 Brno, Czech Republic
5. Department of Immunology, Faculty of Medicine and Dentistry, Palacky University Olomouc, Hnevotinska 3, 779 00 Olomouc, Czech Republic
Received 2026-6-2; Accepted 2026-10-2; Published 2027-1-1
Abstract
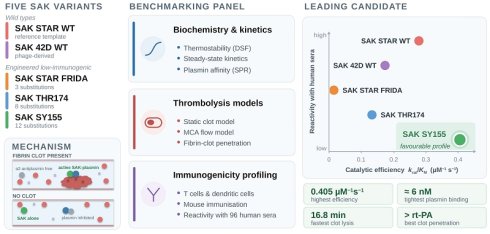
Staphylokinase is a highly fibrin-specific plasminogen activator with significant potential as a safe and affordable thrombolytic. Yet, its clinical translation can be limited by potential immunogenicity. To accelerate the development of improved thrombolytics, a critical step is identifying the most suitable molecular template. Therefore, we performed a comparative analysis of biochemical and immunological properties of three engineered low-immunogenic variants (SAK SY155, SAK THR174, and SAK STAR FRIDA) and two wild types (SAK STAR and SAK 42D), using a newly established panel of assays. All variants retained potent thrombolytic activity, with SAK SY155 displaying the highest catalytic efficiency and fibrin-clot permeability. However, this advantage did not fully translate into improved clot reduction under flow conditions. Comprehensive immunological profiling, including T lymphocyte proliferation, dendritic cell maturation, mouse immunisation models, and human serum reactivity tests, confirmed decreased immunogenicity for two low-immunogenic variants. Overall, low-immunogenic SAK SY155 emerged as the most promising template for rational engineering of next-generation thrombolytics.
Keywords: staphylokinase, thrombolysis, plasminogen activation, fibrin specificity, low-immunogenic, protein engineering, permeability, immunogenicity profiling
Introduction
Stroke is a leading cause of death and long-term disability worldwide, placing a major burden on public health. According to the World Health Organisation (WHO), it is the second most common cause of global mortality and a major contributor to disability-adjusted life years lost each year [1]. Most cases (80 - 85%) are ischemic, caused by obstruction of cerebral blood flow [2,3]. The current standard treatment is intravenous thrombolysis with alteplase (rt-PA), which improves outcomes when given within 4.5 hours [4], but its use is limited by the narrow therapeutic window and the risk of intracranial haemorrhage [5]. After nearly thirty years, an engineered variant with greater fibrin specificity, a longer half-life, and single-bolus administration, called tenecteplase, was approved as an alternative [6-8].
Despite advances, the demand for safer and more effective thrombolytics continues to grow. Staphylokinase (SAK), a bacterial plasminogen activator, is a promising candidate. Unlike rt-PA, it acts only in complex with plasmin and selectively activates fibrin-bound plasminogen, enabling targeted clot dissolution while minimising systemic fibrinogen degradation and bleeding [9-13]. Preclinical studies and early clinical data indicate strong efficacy and safety, suggesting that SAK may overcome several limitations of existing therapies [14-19]. However, its bacterial origin makes it immunogenic, and antibody formation has been reported, potentially limiting repeated or long-term use [20-22].
Multiple less-immunogenic SAK variants have been engineered to address this challenge. Extensive work by Collen and colleagues (1995 - 2005) mapped immunogenic epitopes and generated numerous mutants with reduced immunogenicity and preserved activity [23-28]. In this study, we focus on several of the most promising variants, compare their functional properties relevant to future applications, and evaluate their potential as templates for advanced engineering of safer thrombolytics. We selected three variants: (i) SAK SY155, a 12-point mutant (K35A, E65Q, K74R, D82A, S84A, T90A, E99D, T101S, E108A, K109A, K130T, K135R) identified as one of the most effective [29]; (ii) SAK THR174, an 8-point mutant (E65D, K74Q, R77E, E80S, D82S, V112T, K130Y, E134R) previously advanced toward commercialisation [30]; and (iii) SAK STAR FRIDA, a simpler triple-alanine mutant (K74A, E75A, R77A) related to a variant clinically used in Russia [14].
Because SAK exists in several naturally occurring forms, we also compared two wild-type backgrounds. SAK STAR is widely regarded as the default sequence from Staphylococcus aureus, while alternative phage-derived sequences, SAK 42D (S34G, G36R, H43R) and SAK ΦC (S34G), differ at a few positions [31]. To capture functional diversity, we selected the more distinct SAK 42D variant and compared its performance with SAK STAR, ensuring consistent evaluation across engineered and wild-type forms.
Material and Methods
Construction, production, and purification of low-immunogenic SAK mutants
Previous studies show that both terminal regions of SAK are critical for its function [32-36]. Therefore, we designed a construct in which a tag can be fully removed, leaving no additional residues after purification. For this purpose, a His-tag was fused to a TEV protease recognition site (ENLYFQ/S), enabling complete removal of the added sequence (marked as bold in the sequence in the Supplementary Data). TEV protease was selected as the cleavage enzyme because the native protein begins with a serine residue, for which TEV exhibits particularly high cleavage efficiency.
Recombinant SAK variants were expressed in Escherichia coli (E. coli) BL21(DE3) harbouring pET21b-based constructs. Constructs for all variants (SAK STAR WT, SAK 42D WT, SAK STAR FRIDA, SAK THR174 and SAK SY155) were obtained from gene synthesis. Cultures were grown in 2× Lysogeny broth (LB, 20 g/L tryptone, 10 g/L yeast extract, 10 g/L NaCl; pH 7.0) supplemented with ampicillin (100 µg/mL) at 37 °C to an OD₆₀₀ of ≈0.8, followed by induction with 0.5 mM IPTG for 4 h at 37 °C. Cells were harvested (4000 × g, 30 min, 4 °C), resuspended in binding buffer A (20 mM K₂HPO₄, 500 mM NaCl, 10 mM imidazole, pH 7.5), and stored at -70 °C.
Cell lysis was performed by sonication on ice, and lysates were clarified by centrifugation (19,000 × g, 1 h, 4 °C) and 0.45 µm filtration. The supernatant was loaded onto a Ni²⁺-IMAC column (HisTrap™ Excel) using an ÄKTA Pure system (Cytiva, USA). After washing with binding buffer A, SAK proteins were eluted with elution buffer B (20 mM K₂HPO₄, 500 mM NaCl, 500 mM imidazole; pH 7.5). His-tag removal was carried out by overnight TEV protease digestion during dialysis into phosphate-buffered saline (PBS, 10 mM Na₂HPO₄, 1.8 mM KH₂PO₄, 2.7 mM KCl, 137 mM NaCl; pH 7.4), using 1 mg TEV per 100 mg SAK. A second IMAC step was used to collect tag-free SAK in the flow-through. Final purification was achieved by size-exclusion chromatography (HiLoad 26/600 Superdex 75 pg) in PBS. Pure fractions were pooled, concentrated, flash-frozen in liquid nitrogen, and stored at -70 °C. Protein concentration and purity were assessed by UV spectrophotometry and SDS-PAGE.
Endotoxin removal procedure
Endotoxins were removed from protein samples using Triton X-114 phase separation [37,38]. Triton X-114 was added to the protein solution to a final concentration of 1% (v/v), and the mixture was incubated on ice for 20 min until clarification. Samples were then warmed to 25 - 30 °C to induce phase separation and centrifuged at 5000 rpm for 10 min at 25 °C. The aqueous phase containing proteins was collected, while the detergent phase containing endotoxins was discarded. This procedure was repeated three times to maximise endotoxin removal. All steps were performed using sterile, pyrogen-free plasticware.
Thermostability measurement
Thermostability of SAK variants was evaluated by differential scanning fluorimetry (DSF) using a Prometheus Panta instrument (NanoTemper Technologies, Germany). Protein samples (≈1 mg/mL; ≈65 µM) were loaded into standard glass capillaries in quadruplicate. Thermal scans were recorded in the range of 25 - 90 °C at a 1 °C/min rate, monitoring intrinsic tryptophan fluorescence at 330 and 350 nm. Unfolding transitions were derived from the 350/330 nm fluorescence ratio, and melting (Tm) and onset (Ton) temperatures were determined using Prometheus Panta Evaluation Software. Variants were classified as stable when both Tm and Ton exceeded 37 °C. Long-term stability was assessed by an isothermal DSF/DLS measurement at 37 °C for 120 h using the same protein concentration.
Fluorescence activity measurement
Unless otherwise stated, reactions were performed in PBS. A combination of a fluorogenic assay, an absorbance assay, and surface plasmon resonance (SPR) measurement was selected for thrombolytic activity characterisation [39,40].
A calibration curve was constructed using varying 7-amino-4-methylcoumarin (AMC) concentrations (0, 10, 20, 50, 100, 200, 400, and 600 µM) (Merck, Germany). Fluorescence was monitored continuously for 4 h to ensure signal stability, and a mean value was taken for each concentration. Data were fitted to the conversion Eq. 1.
(Equation 1)
where FI is the fluorescence intensity, [AMC] is the AMC concentration, and A, B, and C are fitting parameters. The obtained function was used to convert fluorescence intensities to AMC concentrations in all subsequent assays.
To characterise human plasmin (PLM) kinetics, reactions were performed with 32 nM plasmin (Athens R&T, USA) and varying D-Valyl-Leucyl-Lysyl-7-amido-4-methylcoumarin (D-VLK-AMC) concentrations (0, 10, 20, 50, 100, 200, 400, and 600 µM) (AAT Bioquest, USA). Fluorescence data were converted to AMC concentrations using the calibration curve. Linear slopes at each substrate concentration were extracted and fitted to the Michaelis-Menten equation to obtain the maximum reaction velocity (Vmax) and Michaelis constant (KM). The turnover number (kcat) and catalytic efficiency (kcat/KM) of plasmin were then calculated from these parameters.
SAK activity was measured using human plasminogen (PLG, Athens R&T, USA) as substrate in the presence of D-VLK-AMC (200 µM). Plasminogen concentrations were 0, 0.16, 0.81, 2.17, 4.35, 8.15, 16.3, and 43.5 µM, while SAK concentration was fixed at 0.5 nM. The mixture was spiked with 0.5 nM of human plasmin to allow the creation of the SAK-PLM complex. The fluorescence was monitored at λex = 355 nm (20 nm bandwidth) and λem = 460 nm (10 nm bandwidth) using an Omega plate reader (BMG Labtech, Germany). Fluorescence progress curves displayed four characteristic phases: lag, parabolic, linear, and plateau. Only the initial parabolic phase, where both plasminogen activation and D-VLK-AMC cleavage occur simultaneously, was used for kinetic evaluation. This phase was fitted with a second-degree polynomial, and quadratic coefficients were taken as apparent reaction velocities. These values were plotted against plasminogen concentration and fitted by the Michaelis-Menten equation to obtain apparent kinetic parameters (Vmax_app and KM_app). The turnover number of the SAK-PLM complex was calculated using Eq. 2, which accounts for plasmin kinetics determined independently:
(Equation 2)
Uncertainty in kcat,SAK-PLM was estimated by error propagation using the standard deviations of Vmax,SAK-PLM, KM,PLM, and kcat,PLM.
Absorbance thrombolytic efficiency measurement
The thrombolytic efficiency of SAK variants was assessed using a simplified version of a previously published Clot Formation and Lysis (CloFAL) assay [40]. For each reaction, 50 µL of thrombin (1 IU/mL) (T6884, Merck, Germany) was premixed with 5 µL of SAK variant (50 nM). Clotting was initiated by adding 50 µL of fibrinogen (10 mg/mL) (F3879, Merck, Germany), which contains traces of plasminogen, and the reaction was immediately monitored in a plate reader by measuring absorbance at 405 nm at 30 s intervals. Reactions were carried out in PBS supplemented with 0.9 mM CaCl₂ and 0.1% Tween80. Calcium was included to support clot formation, while Tween80 prevented clot adherence to the well walls and improved homogeneity of the mixture.
Data analysis was performed using the Shiny App [41]. For each variant, two parameters were determined: the time to 90% clot formation and the time to 50% clot lysis. Thrombolytic efficiency was reported as the difference between these two values, representing the time required for a fully formed clot to undergo 50% lysis.
Surface plasmon resonance (SPR) measurement
To investigate whether differences in activity among SAK variants could be attributed to altered affinity for plasmin, binding kinetics were analysed by surface plasmon resonance (SPR) using a Biacore S200 instrument (Cytiva, USA). Human plasmin (Invitrogen, USA) was immobilised on a CM5 sensor chip via amine coupling. SAK variants were injected in the mobile phase at concentrations of 3.7, 11, 33, 100, 300, and 900 nM at a flow rate of 50 µL/min. For each variant, three measurements were performed on the same chip, with alternating injections to minimise systematic bias. Each sample was injected across all four channels. Channels 1 and 3 served as blank channels, while channels 2 and 4 had two different coverages: 850 response units on channel 2 and 550 response units on channel 4. After subtraction, we obtained two independent traces (2 - 1 and 4 - 3). The association and dissociation phases were both set to 300 s. Regeneration was achieved using 10 mM Glycine/HCl, pH 2.5, for 30 s. The measurement was performed at 25 °C.
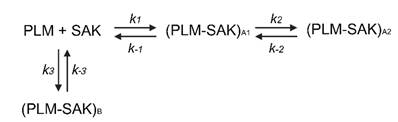
All sensorgrams collected for a given SAK variant were analysed globally using KinTek Explorer (KinTek Corporation, USA). Data fitting was performed by numerically integrating the differential rate equations defined by the kinetic model (Scheme 1), and the resulting simulated sensorgrams were fitted to the experimental data. The best-fitting model suggests two parallel binding events: a two-step induced binding and an independent one-step binding. Parameter estimation was performed by minimising the χ² objective function using nonlinear least-squares regression based on the Levenberg-Marquardt algorithm. The forward integration of the model equations was computed using the Bulirsch-Stoer method with adaptive step-size control to ensure numerical accuracy and stability during optimisation [42]. Residuals were normalised by the sigma value for each data point. The observable sensorgram signal was defined as the sum of the contributions of each species as defined in Eq. 3.
Proposed mechanism of the SAK-PLM interaction. The interaction proceeds through two parallel pathways: a sequential induced-fit pathway in which the initial encounter complex (PLM-SAK)A1 isomerises to (PLM-SAK)A2, and a single-step pathway leading directly to (PLM-SAK)B.

(Equation 3)
In Eq. 3 a scales the signal to the sensitivity of the measurement, and factors b and c define the relative change in signal in forming PLM-SAKA1, PLM-SAKA2, and PLM-SAKB complexes, respectively. The factor d defines the signal contribution of the non-specific binding of SAK. Different fluorescence scaling factors relating to the different sensitivity of the measurements were used for different datasets, but the factors defining the relative change in signal in forming individual complexes were constant globally for all datasets. The scaling factors were used as fitted parameters. The standard error of the obtained parameters was calculated from the covariance matrix during nonlinear regression. The standard error estimates in fitted parameters were propagated to yield error estimates in calculated values, the equilibrium dissociation constants of PLM-SAKA1, PLM-SAKA2, and PLM-SAKB complexes. In addition to standard error values, a more rigorous analysis of the variation of the kinetic parameters was performed using confidence contour analysis with FitSpace Explorer (KinTek Corporation, USA) [43]. In this analysis, the lower and upper limits for each parameter were derived from the confidence contours for the χ² threshold at the boundary of 0.98.
Blood collection and processing
Venous blood was collected from healthy adult donors (both males and females) after obtaining written informed consent. Donors who received acetylsalicylic acid, nonsteroidal anti-inflammatory drugs, or antiplatelet agents within 7 days were excluded. The study protocol was approved by the Ethics Committee of the St. Anne's University Hospital Brno (EK-FNUSA-25/2023).
Red blood cells (RBCs) were isolated from whole blood that had been anticoagulated with 3.8% sodium citrate (at a ratio of 1:9) through three centrifugation cycles (300 × g for 10 min at 4 °C), with two intermediate PBS washes. The final wash used a saline-adenine-glucose-mannitol solution (1.3 mM adenine, 45.4 mM glucose, and 28.8 mM mannitol in PBS, pH 7.4). Isolated RBCs were stored at 4 °C for up to 21 days and centrifuged (150 × g for 10 min at 4 °C) before use [44]. Serum was obtained from coagulated blood accelerated by thrombin (5 IU/mL) and CaCl₂ (14 mM), and then centrifuged (1000 × g for 10 min at 4 °C), aliquoted, and stored at -80 °C.
Clot and fibrin gel preparation
Semi-synthetic clots were formed using human fibrinogen (12.1 mg/mL; Tisseel Kit Lyo, Baxter) and human thrombin (0.77 IU/mL; Tisseel Kit Lyo, Baxter), combined with 4.2×10⁹/mL isolated RBCs, 15-fold diluted serum, and 4.6 mM CaCl₂. Clot formation was performed in 0.5- or 0.2-mL polypropylene tubes for 45 min at 37 °C with >90% relative humidity. The total clot volumes were 90 µL for the static model and 25 µL for the flow model.
For the penetration experiments, fibrin gels were prepared according to a previously published protocol [39] with the following modifications: the final concentrations were as follows: fibrinogen (12.1 mg/mL), thrombin (0.77 IU/mL), and CaCl₂ (6.9 mM). A 30 µL aliquot of the mixture was cast directly into µ-Slide VI 0.4 micro-slide channels (Ibidi, Germany) and allowed to clot under the conditions described above.
Thrombolytic agents in vessel models
To evaluate thrombolytic efficacy, plasminogen activators were tested at a concentration of 1.3 µg/mL, which corresponds to the clinically relevant dose of rt-PA (Actilyse®, Boehringer Ingelheim, Germany). This concentration was derived from pharmacokinetic data [45] and the manufacturer's information. For the penetration assay, the agents were fluorescently labelled with rhodamine B isothiocyanate (HY-112697, MedChemExpress, USA) according to the manufacturer's protocol [39]. Stabilising additives were removed from rt-PA using PD MidiTrap G-25 desalting columns (Cytiva, USA) according to the manufacturer's instructions, enabling buffer exchange with PBS prior to fluorescence labelling. Betaine hydrochloride (90 mM per mg of protein) was added to the rt-PA sample to prevent denaturation during labelling. After labelling, the fluorophore-to-protein ratio was set to 0.39 for all thrombolytic agents. The final concentration in the penetration experiments was set to 0.022 µM, which is equivalent to the clinical concentration of rt-PA.
Determination of thrombolytic efficacy in a static model
Individual clots were incubated in 1.5 mL polypropylene tubes containing 0.5 mL of human plasma (Human Plasma - Pooled, Seqens In Vitro Diagnostic, France) at 37 °C for 60 min, which corresponds to the standard rt-PA infusion duration used in clinical stroke treatment. Lytic efficacy was assessed by measuring the reduction in clot weight and by spectrophotometrically quantifying the release of RBC at 575 nm (haemoglobin) with 700 nm turbidity correction [46,47].
Determination of thrombolytic efficacy in a flow model
An in vitro middle cerebral artery (MCA) flow model was constructed using silicone chips (Sylgard 184, Dow Corning, USA), designed based on the dimensions of patient CT scans (n=4). The models incorporated anatomical narrowing and bifurcation to enable vessel occlusion and permanent circulation. Each MCA chip was connected to a peristaltic pump (Gilson Minipuls 3, Gilson, USA) to maintain plasma flow for up to 120 min at 37 °C or until complete recanalization (clot displacement and restored flow) occurred [48].
Real-time imaging captured clot area changes at 5-minute intervals using a web camera (C525, Logitech, Switzerland) with a resolution of 2 megapixels. Clot lysis was quantified by percentage area reduction, recanalization time, and RBC release. Recanalization frequency represented the percentage of complete recanalization per treatment group.
Clot penetration assay
Fluorescently labelled thrombolytics were applied to individual fibrin gel channels, and the fluorescence intensity was recorded at 5-minute intervals at distances of 0.25, 0.50, 0.75, 1.00, and 1.25 mm from the application site. Imaging was performed using a Zeiss Axio Observer Z1 microscope (Zeiss, Germany) with metal halide fluorescence illumination (HXP 120, LEJ, Germany) and a high-efficiency Filter Set (Filter Set 43 HE: excitation BP 550/25, beam splitter FT 570, and emission BP 605/70). Penetration success was defined as the percentage of runs exceeding three times the standard deviation of background autofluorescence within 180 min.
Image analysis and data processing
Clot area measurements were performed using semi-automated procedures with Python (version 3.13) and ImageJ (version 1.54d). Penetration analysis utilised custom Python scripts with background subtraction and winsorisation at the 5th and 95th percentiles to reduce the influence of outliers [49,50], and normalisation to the baseline (time 0 min). For each acquisition day, background fluorescence in the channel of interest was subtracted from the entire dataset acquired on that day. Baseline correction was performed for each time-lapse series by subtracting the initial integrated fluorescence intensity, expressed in relative fluorescence units (RFU), from the integrated fluorescence intensity at every time point.
Statistics for vessel model experiments
Statistical analyses were performed using GraphPad Prism (version 9.5.1, GraphPad Software, USA) and Python. For each dataset, the statistical test was selected according to the data type and the multiple-comparison correction followed from the omnibus test used. Outliers were identified using Grubbs' test, normality using the Shapiro-Wilk test, and homogeneity of variance using the Brown-Forsythe test. Normally distributed data with equal variances were compared by using one-way ANOVA with Tukey's correction; otherwise, the Kruskal-Wallis test with Dunn's correction was used. Recanalization and penetration success frequencies were analysed using Fisher's exact test, for which no post hoc framework exists; family-wise error was therefore controlled across these tests using Holm-Bonferroni correction. The correlation between the penetration rate and distance was evaluated using Spearman's correlation coefficient. Statistical significance was set at p<0.05.
Monocyte activation test (MAT) and T lymphocyte proliferation and IFN-γ secretion
Low-binding Eppendorf tubes were filled with 800 µL 0.9% NaCl, 100 µL heparinised human whole blood (40 IU/mL), and 100 µL of either NaCl (negative control), lipopolysaccharide (LPS; E. coli O55:B5; 0.007 EU/mL representing the acceptable endotoxin threshold for intravenously administered drugs as defined by the European Pharmacopoeia [51], and 0.07 EU/mL corresponding to a 10-fold higher concentration), rt-PA (1.3 µg/mL, clinically relevant, and 13 µg/mL), or the SAK variants (1.3 and 13 µg/mL). Samples were incubated for 24 h at 37 °C in a humidified 5% CO₂ incubator under sterile conditions. Following incubation, samples were centrifuged at 500 × g for 10 min at room temperature (RT), and plasma was carefully collected without disturbing the cell pellet. IL-6 concentrations were quantified by ELISA (Human IL-6 ELISA kit, Invitrogen, USA) according to the manufacturer's protocol.
Peripheral blood was collected from healthy donors into 4 mM EDTA as an anticoagulant. Peripheral blood mononuclear cells (PBMCs) were isolated, and CD8⁺ T lymphocytes were depleted using the RosetteSep™ Human CD8 Depletion Cocktail (STEMCELL Technologies, Canada) according to the manufacturer's protocol. CD8-depleted PBMC population was labelled immediately after isolation with CellTrace™ Violet (Thermo Fisher Scientific, USA) to determine cell proliferation, resuspended in RPMI 1640 culture medium (Thermo Fisher Scientific, USA) supplemented with 10% low endotoxin fetal bovine serum (FBS LE; Diagnovum, Germany) and antibiotics (100 U/mL penicillin and 100 µg/mL streptomycin, Thermo Fisher Scientific, USA), and seeded in 24-well plates at a density of 5 × 10⁵ cells per well in 500 µL. Cultures were maintained overnight at 37 °C in a humidified 5% CO₂ incubator, under sterile conditions.
On the following day, cells were stimulated with either medium alone (negative control), phytohaemagglutinin (PHA, 5 µg/mL; positive control), rt-PA (1.3 µg/mL, clinically relevant and 13 µg/mL), or SAK variants (1.3 and 13 µg/mL). Cells were incubated for 5 days at 37 °C in a humidified 5% CO₂ incubator under sterile conditions. Lymphocyte proliferation was assessed by flow cytometry (BD FACSVerse; BD Biosciences, USA) using anti-CD3 antibody (Caltag Laboratories, USA) and 7-aminoactinomycin D (7-AAD; Cayman Chemical Company, USA) staining to identify viable, proliferating T cells.
Cells were isolated as described for the proliferation assay and analysed using the FluoroSpot Flex Human IFN-γ/IL-2 kit (Mabtech, Sweden) according to the manufacturer's instructions. Cells were plated at a density of 1 × 10⁵ cells per well with either medium alone (negative control), PHA (5 µg/mL; positive control), rt-PA (1.3 µg/mL, clinically relevant, and 13 µg/mL), or the SAK variants (1.3 and 13 µg/mL). Cells were maintained for 3 days at 37 °C in a humidified 5% CO₂ incubator under sterile conditions. Following incubation, secreted IFN-γ was detected using fluorophore-conjugated antibodies, and fluorescent spots were quantified using the ImmunoSpot® reader (Cellular Technology Limited, Germany). According to internal routine criteria, spot counts below 10 were considered background.
Statistical analyses were performed using GraphPad Prism (version 9.5.1, GraphPad Software, USA). The data normality assumptions were verified for each dataset, and the multiple comparison correction was matched to the omnibus test. For MAT data, outliers were identified using Grubbs' test, and normality was assessed using the Shapiro-Wilk test. Multiple group comparisons were performed using the Kruskal-Wallis test with Dunn's post hoc correction, with all test conditions compared to the response at the negative control and 0.007 EU/mL LPS. For T lymphocyte proliferation data, the variance homogeneity was tested using the Brown-Forsythe test. Multiple group comparisons were performed using ordinary one-way ANOVA with Tukey's post hoc correction. Statistical significance was set at p<0.05.
Mouse immunisation experiments
All experiments were performed on 6- to 8-week-old female BALB/c mice (Anlab, Czech Republic). All animals were free of known pathogens and were kept in a climate-controlled environment and were provided with pellet food and water ad libitum. Mice were immunised three times intradermally with 100 µL of SAK formulation (containing 5 µg of SAK protein) with a three-week interval between doses. For each SAK, one group of mice was immunised with a SAK protein without adjuvant and one with an aluminium adjuvant, as reported earlier [52]. Each group of mice consisted of 3 individuals. Two weeks after the last dose, mice were euthanised under ketamine-xylazine anaesthesia [53] and blood samples were taken from which serum was isolated by centrifugation.
Determination of autoantibodies in the mouse sera
An immunoblotting method was used to determine the potential cross-reactivity of SAK antigens with human autoantigens. We used diagnostic kits EUROLINE Autoimmune Inflammatory Myopathies 16 Ag (IgG) containing the following antigens: Mi-2α, Mi-2β, TIF1γ, MDA5, NXP2, SAE1, Ku, PM-Scl100, PM-Scl75, Jo-1, SRP, PL-7, PL-12, EJ, OJ, Ro-52, EUROLINE ANA profile 3 plus DFS70 (IgG) kit containing antigens nRNP/Sm, Sm, SS-A, SS-B, Scl-70, Jo-1, dsDNA, nucleosomes, histones, ribosomal P-protein, AMA M2, Ro-52, PM-Scl, CENP B, PCNA, and DFS70 and EUROLINE Anti-MPO, -PR3 and -GBM (IgG) (all EUROIMMUN, Germany). As Jo-1 and Ro-52 antigens are included in two sets, a result was obtained for a total of 33 autoantigens. For use with mouse sera, the secondary antibody contained in the kit was replaced by an anti-mouse IgG AP-conjugate antibody (A16093, Invitrogen, USA) as described previously [54].
Determination of murine antibodies against individual SAKs by ELISA
Wells of ELISA plates (Maxisorp, Thermo Fisher Scientific, USA) were coated with 100 µL of individual SAK solutions with a protein concentration of 5 µg/mL in carbonate buffer (100 mM bicarbonate/carbonate, pH 9.6) at 4 °C overnight. The plates were washed with PBS-T solution (PBS buffer containing 0.05% Tween80, pH 7.4), and wells were blocked with blocking solution (5% dry skimmed milk in PBS-T). Mouse serum samples were applied at a 1:500 dilution in PBS-T supplemented with 1% bovine serum albumin (BSA, Merck, Germany). Samples were incubated at 4 °C overnight, wells were washed three times with PBS-T and secondary antibody (anti-mouse IgG γ-chain-specific peroxidase antibody produced in goat, Merck, Germany) was applied at a dilution of 1:5000 in PBS-T with 1% BSA. After two hours of incubation at RT, wells were washed 4× with PBS-T, 2× with PBS and an OPD tablet (Merck, Germany) in Phosphate-Citrate buffer (Merck, Germany) was used to visualise the reaction. The reaction was stopped with 1 M sulphuric acid, and absorbance at 450 nm was measured using BioTek Synergy HTX multi-mode reader (Agilent Technologies, USA).
Determination of murine antibodies against SAK by measuring inhibitory potency
The inhibitory potency of murine sera after administration of SAK was studied using the fluorogenic activity assay. Nine samples were measured for each variant - 3 negative control serum samples, 3 serum samples from adjuvant-free administration and 3 samples from adjuvant-rich administration. All serum samples were first incubated at 56 °C for 30 minutes to inactivate the complement. Then the sera were diluted 10-fold and incubated with SAK at 37 °C for one hour to create complexes between SAK molecules and newly formed antibodies in the sera. Preliminary experiments showed that the optimal concentration of SAK for incubation was 333 nM. The inhibitory potency of individual serum samples was compared by measuring the decrease in reaction rate. The final 50 µL reaction mixture contained 1 µM human plasminogen, 200 µM fluorogenic substrate D-VLK-AMC, 13.3 nM human plasmin, 13.3 nM SAK, and 250-times diluted serum. The decrease in the rates between negative control samples and samples of serum after administration of SAK was studied.
Determination of human antibodies against individual SAKs by ELISA
Wells of ELISA plates (Maxisorp, Thermo Fisher Scientific, USA) were coated with 100 µL of individual SAK variant with a protein concentration of 2 µg/mL in carbonate buffer (100 mM bicarbonate/carbonate, pH 9.6) and incubated at 4 °C overnight. The plates were washed with PBS-T solution (PBS buffer containing 0.05% Tween80, pH 7.4), and wells were blocked with blocking solution (5% dry skimmed milk in PBS-T). Wells were then washed with PBS-T. Defrosted human sera from volunteers were used, under a protocol approved by the Ethics Committee of the University Hospital and Faculty of Medicine and Dentistry of Palacky University Olomouc (121/14). Human sera were collected from 96 randomly selected healthy subjects (age range: 50 - 86 years, average age: 64.16 years, F/M ratio: 33:63). All subjects signed informed consent. Sera were applied at a 1:1000 dilution in PBS-T supplemented with 1% of bovine serum albumin (BSA, Merck, Germany). Samples were incubated at 4 °C overnight, wells were washed three times with PBS-T and secondary antibody (anti-human IgG γ-chain-specific peroxidase-conjugated antibody produced in goats, Sigma-Aldrich, Germany) was applied at a dilution of 1:5000 in PBS-T with 1% BSA. After two hours of incubation at room temperature, wells were washed 4× with PBS-T, 2× with PBS and OPD tablet (Sigma-Aldrich, Germany) in Phosphate-Citrate buffer (Sigma-Aldrich, Germany) was used to visualise the reaction. The reaction was stopped by 1 M sulphuric acid, and absorbance at 450 nm was measured using BioTek Synergy HTX multi-mode reader (Agilent Technologies, USA).
The principal component analysis was then performed on the centred non-normalised values of absorbances, averaged over two independent experiments, using sklearn.decomposition.PCA function from the scikit-learn library (v1.8.0) in Python 3.14. The dendrogram with the SAK variants was calculated on the same values using cluster hierarchy methods of SciPy library (v1.17.0) using default linkage settings.
Bone marrow-derived dendritic cells differentiation
The preparation and differentiation of bone marrow-derived dendritic cells (BMDCs) from mice was performed with the aseptic harvesting of bone marrow from the femurs and tibias of BALB/c mice. All reagents used in this protocol were purchased from Gibco (Thermo Fisher Scientific, USA). After euthanising the mouse under ketamine-xylazine anaesthesia, the bones were cleaned of muscle tissue, sterilised with ethanol, and their ends were cut off to expose the marrow. Using a sterile syringe, the marrow was flushed out with complete RPMI culture medium (10% FBS, 1% penicillin/streptomycin) into a collection tube. Red blood cells were lysed, followed by centrifugation at 250 × g for 5 min at RT. Bone marrow cells were incubated for 7 days in complete RPMI culture medium (10% FBS, 1% penicillin/streptomycin) supplemented with 20 ng/mL GM-CSF and 20 ng/mL IL-4 at 37 °C, 5% CO2. On days 3 and 5, one-third of the media was replaced with fresh media with cytokines. On day 7, 50 µM of particular SAK variants or 150 ng/mL LPS (Merck, Germany) was added to differentiated BMDC and cultivated for another 24 hours.
Cells were washed with PBS by centrifugation at 250 × g for 5 min at RT, and Fc receptors were blocked by TruStain FcX antibody (SONY Biotechnology, USA). A set of cell surface markers anti-MHCII - Alexa Fluor700, anti-MHCI - Pacific Blue, anti-CD11c - APC-Cy7, anti-CD40 - PE, anti-CD80 - PE-Cy5, anti-CD86 - PE-Cy7, anti-CD69 - APC (SONY), and Fixable Viability Dye - eFluor506 (eBioscience, Thermo Fisher Scientific, USA) was used in 2% FBS in PBS for 30 min, RT, in the dark. Cells were washed in PBS and analysed by a SONY SP6800 spectral analyser. Flow cytometry FCS files were analysed in SONY software, more detailed analyses (t-SNE) were performed by FlowJo 10.6.1 software (Becton Dickinson, USA). All statistical analyses were performed in GraphPad Prism 8 software (GraphPad Software, USA).
Results
Protein purity, yield, stability, and aggregation propensity
The purity of all SAK variants (sequences shown in Table S11) was assessed by SDS-PAGE, using samples collected after each purification step and final protein preparations (Fig. S3 and S4). The purification strategy consistently yielded highly pure proteins across all variants; however, protein yields varied considerably between constructs (Table S11). SAK STAR WT was obtained in substantially higher amounts compared to SAK 42D WT. Incorporation of multiple mutations generally resulted in reduced expression yields; however, the high yield of STAR WT ensured sufficient quantities of even the lowest-yielding variants.
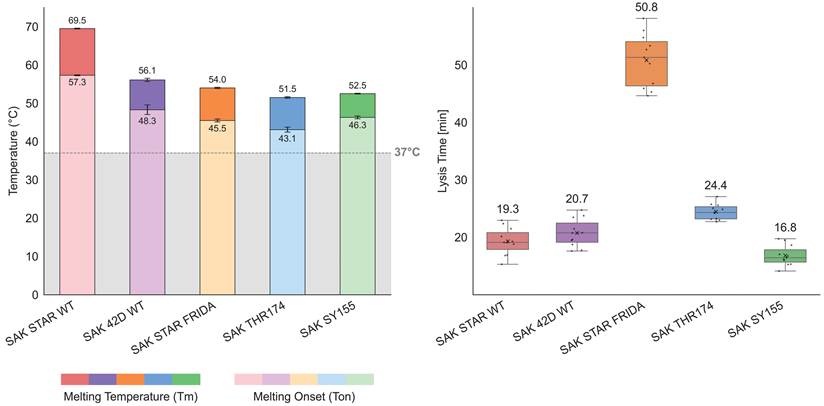
Stability analysis by differential scanning fluorimetry (DSF) (Fig. 1A, S5) revealed that reduced yields were accompanied by decreased thermostability. Among all constructs, SAK STAR WT again showed the most favourable profile, with both melting temperature (Tm) and onset of unfolding temperature (Ton) substantially above 37 °C. Importantly, all variants showed Tm and Ton values above the physiological threshold. To further confirm long-term stability at physiological conditions, a combined isothermal DSF/DLS experiment was performed at 37 °C for 120 h (Fig. S6 and S7). No signs of unfolding or aggregation were observed, demonstrating that all variants remain stable during storage, handling, and conditions relevant to administration.
A) Differential scanning fluorimetry (DSF) analysis of the thermal stability of the five SAK variants. For each variant, the melting temperature (Tm) and onset melting temperature (Ton) are shown. All measurements were performed at ≈1 mg/mL protein concentration (≈65 µM) in quadruplicate. Error bars represent one standard deviation above and below the average. The data demonstrate that all variants maintain Tm and Ton values above physiological temperature (grey line = 37 °C). B) The results of the thrombolytic activity assay on fibrin clots, run at 37 °C in PBS/Ca2+/Tween80; pH 7.4, number of technical repetitions was 11. The reported value is the time between 90% clot formation and 50% clot lysis. The box plot shows the mean value (X), median (line), interquartile ranges (boxes), and minimum and maximum values (whiskers).
Comparison of catalytic activities using in vitro assays
To assess the performance and thrombolytic potential of the SAK variants, we conducted a series of kinetic analyses, affinity measurements, and activity profiling. We analysed the steady-state kinetics of all SAK variants using the fluorogenic assay (Fig. S8). The resulting kinetic parameters are summarised in Table 1. The variants exhibited measurable differences in proteolytic activity. Notably, SAK STAR FRIDA exhibited a significantly elevated Michaelis constant, KM≫50 µM, so only the catalytic efficiency (kcat/KM) could be reliably estimated using linear fitting with Eq. 4.
Apparent kinetic parameters, maximum reaction velocity (Vmax), Michaelis constant (KM), turnover number (kcat), and catalytic efficiency (kcat/KM) were determined from the fluorogenic assay, run with human plasminogen (0 - 43.5 µM) in PBS buffer; pH 7.4; 37 °C in triplicate. ** Due to significantly elevated KM for SAK STAR FRIDA, Michaelis-Menten fit was replaced with simple linear fitting that only allows for assessing catalytic efficiency, but not the remaining parameters.
| Steady-state kinetics parameters | |||||
|---|---|---|---|---|---|
| SAK STAR WT | SAK 42D WT | SAK STAR FRIDA | SAK THR174 | SAK SY155 | |
| Vmax_app [µM s-1](×10-3) | 0.193 ± 0.009 | 0.134 ± 0.006 | ** | 0.194 ± 0.024 | 0.199 ± 0.011 |
| KM_app [µM] | 6.75 ± 0.93 | 7.54 ± 0.98 | ** | 14.17 ± 4.06 | 4.78 ± 0.84 |
| kcat_app [s-1] | 1.88 ± 0.16 | 1.30 ± 0.11 | ** | 1.89 ± 0.27 | 1.94 ± 0.17 |
| kcat/KM_app [µM-1 s-1] | 0.278 ± 0.045 | 0.173 ± 0.027 | 0.016 ± 0.001 | 0.133 ± 0.043 | 0.405 ± 0.080 |
(Equation 4)
Among the remaining variants, measurements were consistent and yielded reliable kinetic parameters. SAK SY155 demonstrated the highest turnover number (kcat = 1.94 ± 0.17 s-1) and catalytic efficiency (kcat/KM = 0.405 ± 0.080 µM-1 s-1), indicating superior catalytic performance. SAK THR174, another low-immunogenic variant, showed a turnover number comparable to SY155 (kcat = 1.89 ± 0.27 s-1), but reduced catalytic efficiency (kcat/KM = 0.133 ± 0.043 µM-1 s-1), due to an elevated KM. Among the two wild-type forms, SAK STAR WT displayed higher activity than SAK 42D WT across all parameters.
Next, we evaluated the thrombolytic efficiency of the SAK variants using the clot formation and lysis (CloFAL) assay (Fig. 1B, Table S14). Among the tested variants, SAK SY155 exhibited the fastest clot lysis (16.8 ± 1.8 min), followed by SAK STAR WT (19.3 ± 2.4 min), SAK 42D WT (20.7 ± 2.4 min), and SAK THR174 (24.4 ± 1.4 min). In contrast, SAK STAR FRIDA (50.8 ± 4.6 min) displayed a markedly reduced thrombolytic efficiency. This ranking is consistent with the results obtained from the steady-state kinetics, using the fluorogenic assay, confirming that while four variants show broadly comparable efficiency, SAK STAR FRIDA underperforms.
The affinity of all five variants for their interaction partner, plasmin, was measured using SPR. The fitting of the SPR binding curves for all variants is shown in the supplement (Fig. S9-13). Reliable estimates were obtained for both the binding equilibrium constants and the association and dissociation rate constants for all tested variants. The equilibrium binding parameters are summarised in Table 2, while the kinetic rates are summarised in Table S16. In contrast to its lower activity, the 42D template (≈ 39 nM) has a higher affinity than the STAR template (≈ 95 nM). SAK STAR FRIDA is again the worst-performing variant by a significant margin (≈ 132 nM). SAK SY155 exhibited the strongest binding (≈ 6 nM), owing mostly to the slower dissociation rates, and again showed superior performance to the other low-immunogenic variant SAK THR174 (≈ 67 nM).
Dissociation constants of SAK variants binding to human plasmin determined by SPR. Human plasmin was immobilised on a CM5 chip via amine coupling, and SAK (3.7 - 900 nM) was injected as the mobile phase in PBS + 0.05% Tween80 (pH 7.4) at 25 °C. Binding curves were fitted to a numeric model corresponding to the proposed mechanism. Kd_app is the apparent dissociation constant of the two-step induced binding. Kd_1 is the dissociation constant of the first step of the two-step induced binding, and Kd_3 is the dissociation constant of the parallel single-step binding.
| SPR affinity kinetic parameters | |||||
|---|---|---|---|---|---|
| SAK STAR WT | SAK 42D WT | SAK STAR FRIDA | SAK THR174 | SAK SY155 | |
| Kd_app [nM] | 94.9 ± 19.4 | 38.4 ± 7.1 | 132.1 ± 36.6 | 66.6 ± 40.7 | 6.1 ± 0.8 |
| Kd_1 [nM] | 142.5 ± 20.3 | 68.8 ± 12.3 | 294.7 ± 64.5 | 88.1 ± 52.1 | 29.0 ± 2.0 |
| Kd_3 [nM] | 15.3 ± 1.1 | 12.5 ± 0.8 | 192.9 ± 43.9 | 22.5 ± 3.4 | 48.0 ± 7.9 |
Comparison of thrombolytic activities with blood clots in a static model
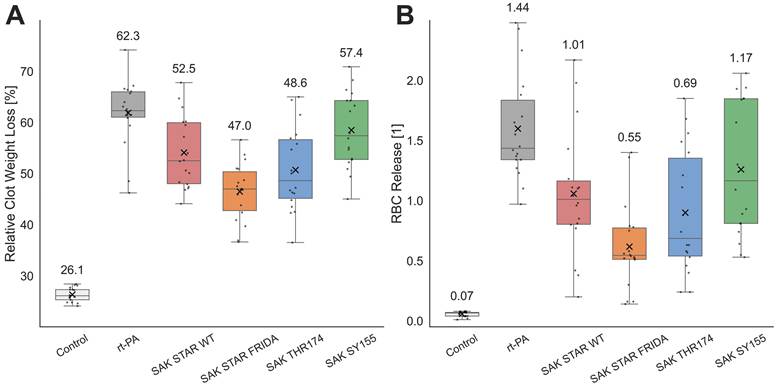
In the in vitro static model, all thrombolytic treatments significantly increased clot lysis, as assessed by relative clot weight loss and RBC release (Fig. 2, Table S1, S2), compared to the control. Among the SAK variants, SAK STAR WT and SAK SY155 exhibited lytic efficacy comparable to that of clinically used rt-PA (p>0.05 for both), while SAK THR174 and SAK STAR FRIDA were significantly worse than rt-PA (p<0.05 for both).
Thrombolytic efficacy in a static in vitro model A) The results of the relative clot weight loss determination. The number of repetitions ranges from 17 to 18, depending on the variant. The concentration of all agents was 1.3 µg/mL. The experiment was performed in 0.5 mL of human plasma at 37 °C for 60 minutes. B) The results of the red blood cell (RBC) release determination. The number of repetitions was 18. The concentration of all agents was 1.3 µg/mL. The box plots show mean value (X), median (line), interquartile ranges (boxes), and minimum and maximum values (whiskers). The value for the median is also stated above the boxes. The experiment was performed in 0.5 mL of human plasma at 37 °C for 60 minutes; the release was monitored by determination of haemoglobin absorbance at 575 nm against the turbidity at 700 nm.
Comparison of thrombolytic activities with blood clots in a flow model
In the flow model, all treatments, except SAK SY155 (p=0.221), significantly reduced recanalization time compared to the control (p<0.05; Fig. 3A, Table S3). No significant differences were observed between the individual treatments. RBC release analysis confirmed enhanced lytic efficacy for all treatments compared to the control (p<0.05 for each group; Fig. 3B, Table S4). Clot area evaluation revealed that rt-PA, SAK STAR WT, SAK STAR FRIDA, and SAK THR174 produced a significant reduction compared to the control after 60 min (p<0.05; Fig. 3C, Table S5), whereas SAK SY155 had no significant effect at 60 min. By 120 min, all treatments achieved a significant reduction in clot size compared to the control (p<0.001 for all; Fig. 3C, Table S5), with no significant differences among the treatments. At 60 min, SAK STAR WT achieved a significantly higher recanalization frequency than the control (p=0.006; Table 3, S6). By 120 min, all thrombolytics had significantly increased recanalization frequencies compared to the control (p<0.05 for all groups; Table 3, S6), with no significant differences among the treatments. Given the unequal group sizes and small cell counts, Fisher's exact test has limited sensitivity for rt-PA vs SAK comparisons; non-significant results should be interpreted as inconclusive rather than as evidence of no difference.
Descriptive statistics of the recanalization frequency in the flow model. Thrombolytic agent efficacy expressed as recanalization frequency at 60 min and 120 min. Experiments were conducted at 37 °C for 120 minutes in human plasma, with 11 repetitions for control, 12 for rt-PA and 18 for each SAK variant. All agents were used at a concentration of 1.3 µg/mL.
| Recanalization frequency: Descriptive statistics | ||||||
|---|---|---|---|---|---|---|
| Control | rt-PA | SAK STAR WT | SAK STAR FRIDA | SAK THR174 | SAK SY155 | |
| At 60 minutes | ||||||
| Recanalization | 0 (0%) | 6 (50%) | 12 (67%) | 5 (28%) | 8 (44%) | 5 (28%) |
| No recanalization | 11 (100%) | 6 (50%) | 6 (33%) | 13 (72%) | 10 (56%) | 13 (72%) |
| Count (100%) | 11 | 12 | 18 | 18 | 18 | 18 |
| At 120 minutes | ||||||
| Recanalization | 0 (0%) | 10 (83%) | 17 (94%) | 14 (78%) | 15 (83%) | 11 (61%) |
| No recanalization | 11 (100%) | 2 (17%) | 1 (6%) | 4 (22%) | 3 (17%) | 7 (39%) |
| Count (100%) | 11 | 12 | 18 | 18 | 18 | 18 |
Clot lysis using an in vitro flow model and the clot penetration experiment. A) Recanalization time. Experiments were conducted at 37 °C for 120 minutes in human plasma, with 11 - 18 repetitions per condition. All agents were used at a concentration of 1.3 µg/mL. Box plots indicate the mean (X), median (line), interquartile range (boxes), and minimum and maximum values (whiskers). B) Red blood cell (RBC) release. Experiments were conducted at 37 °C for 120 minutes in human plasma, with 11 - 18 repetitions per condition. RBC release was monitored by the determination of haemoglobin absorbance at 575 nm against the turbidity at 700 nm. Box plots indicate the mean (X), median (line), interquartile range (boxes), and minimum and maximum values (whiskers). C) Relative clot reduction over time. Data are shown as mean ± standard error of the mean at 5-minute intervals. Experiments were conducted at 37 °C for 120 minutes in human plasma, with 11 - 18 repetitions per condition. All agents were used at 1.3 µg/mL. D) Clot penetration rates. Data are presented as mean ± standard deviation of the penetration rate versus distance. Experiments were conducted at 37 °C for 180 minutes in PBS, with 19 - 23 repetitions per condition. All agents were used at a concentration of 0.022 µM.
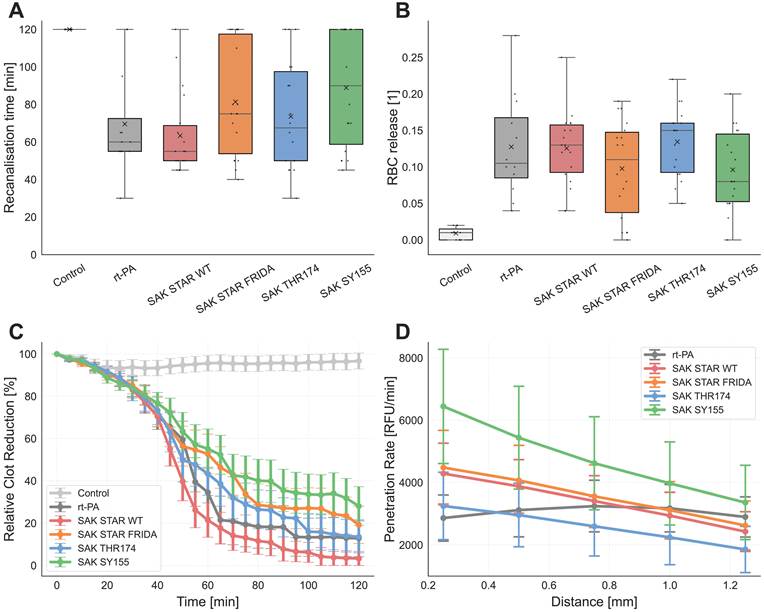
Penetration efficiency testing using the clot penetration assay
Distance-dependent analysis revealed significant negative correlations between penetration rate and depth for all SAK variants (rs=-1.0, p=0.017; Fig. 3D, Table S7), whereas rt-PA showed no correlation (rs=0.3; p=0.683; Fig. 3D, Table S7). At 0.25 mm, SAK STAR WT, SAK STAR FRIDA, and SAK SY155 exhibited higher penetration rates than rt-PA (p<0.05; Fig. S1, Table S8), with SAK SY155 also outperforming SAK STAR WT, SAK STAR FRIDA, and SAK THR174 (p<0.001; Fig. S1, Table S8). SAK SY155 maintained higher rates than rt-PA up to 0.75 mm and, together with SAK STAR FRIDA, surpassed SAK THR174 across all distances up to 1.25 mm (p<0.05; Fig. S1, Table S8). Penetration time analysis (Fig. S2, Table S9) confirmed that SAK SY155 reached thresholds significantly faster than rt-PA (0.25 - 0.50 mm, p<0.05), SAK STAR WT (0.25, 0.75 - 1.25 mm, p<0.05), and SAK THR174 (across all distances, p<0.001). rt-PA showed shorter penetration times than SAK THR174 at 0.75 and 1.0 mm (p<0.05). Penetration frequency analysis (Table S10) revealed that rt-PA and SAK SY155 exceeded SAK THR174 at 0.75 and 1.00 mm (p<0.05). SAK SY155 further demonstrated higher success than rt-PA and other SAK variants at 1.25 mm.
MAT
The MAT was performed to confirm the removal of endotoxin from the SAK variants. As expected, the assay controls confirmed validity: both the negative control and LPS at 0.007 EU/mL, corresponding to the maximal level permitted in intravenously administered drugs, induced only very low cytokine release. In contrast, a 10-fold higher concentration of LPS (0.07 EU/mL) triggered a markedly stronger cytokine release, thereby confirming the proper functionality and dynamic range of the assay (Fig. S18A, Table S12). The clinically used reference, rt-PA, did not induce significant cytokine release at either the clinically relevant concentration (1.3 µg/mL) or the 10-fold higher concentration (13 µg/mL), with responses comparable to those of the negative control and 0.007 EU/mL LPS. Similarly, none of the SAK variants triggered cytokine release above this baseline level at either concentration (Fig. S18A, Table S12).
Immunogenicity testing using T lymphocyte proliferation and IFN-γ secretion
T lymphocyte proliferation was evaluated in CD8-depleted PBMCs from four healthy donors (Fig. S18B, Table S13). The negative control induced only minimal proliferation, whereas the positive control (PHA) elicited robust proliferative responses (p<0.001) compared to the negative control and all treatment variants, confirming cell viability and validating assay performance. Neither rt-PA nor any of the SAK variants induced proliferation significantly above the negative control at either tested concentration (p>0.05). Consistent with these findings, FluoroSpot analysis showed no IFN-γ responses above the predefined background threshold following stimulation with rt-PA or the SAK variants, whereas PHA induced a clear positive response (Fig. S17).
Determination of autoantibodies in the sera of immunised mice
Using human diagnostic immunoblot kits, we tested the ability of individual SAK variants to induce antibodies cross-reacting with known human organ-nonspecific autoantigens as a marker of potential autoimmune reaction elicitation by SAK. No borderline or positive results were detected for individual autoantigens present in diagnostic immunoblots with any of the SAK-immunised mouse groups. This experiment provided no evidence that SAK proteins induce antibodies cross-reacting with autoantigens commonly recognised in human systemic autoimmune diseases (Fig. S14, S15, S16).
Induction of specific antibody response after vaccination with individual SAK variants
We compared the immunogenicity of individual SAK types in experimental mice immunised either with individual SAK proteins or with a combination of SAK protein and aluminium adjuvant. Serum levels of antibodies against individual SAK proteins after immunisations were evaluated using the ELISA method (Fig. S20, Table S15) and serum-inhibited SAK activity measurement.
In the ELISA method, all groups of mice were tested on plates coated with each of the SAK variants used for vaccination. In the groups vaccinated with the protein alone, only very low levels of antibodies were detected, in most groups comparable to negative sera from unvaccinated mice (Table S15). Antibody levels were an order of magnitude higher in the groups of mice vaccinated with aluminium-adjuvanted SAK proteins (Fig. S20). For most SAKs, the highest reactivity was observed in the group vaccinated with the same variant as was used to coat the individual ELISA plates, but differences between groups were minimal and statistically insignificant due to the high level of cross-reactivity. These results indicate only a marginal effect of the sequence variation among the tested SAKs on their overall antigenicity. The low antibody response of mice immunised with individual SAK variants without adjuvants indicates low, if any, spontaneous immunogenicity and generally high SAK purity devoid of contaminants, which could otherwise stimulate the immune system to an antigen-specific response. A well-detectable antibody response to SAK plus adjuvant immunisation indicates that, at least in mice, there is no active tolerance to the tested SAK variants.
In the inhibitory potency measurement, the activity in the presence of each serum was assessed and normalised to the negative control serum activity, which is set to 100%. As shown in Fig. S19, as with ELISA, no significant differences between variants were observed. For all variants, the adjuvant-free serum showed similar or higher activity, while adjuvant-rich serum generally had lower activity than the negative control (the exception here was SAK STAR FRIDA). This experiment suggests that, without an adjuvant, no variant induces significant antibody generation.
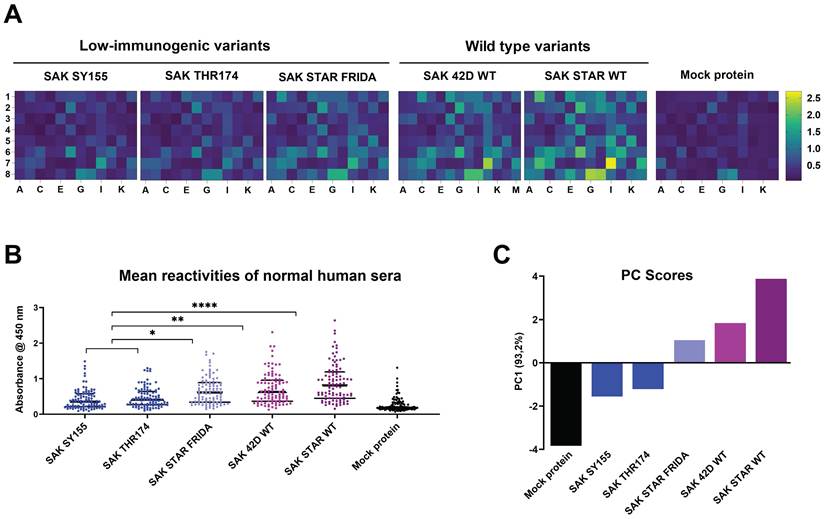
Furthermore, we compared the reactivity of a set of randomly selected human sera to all five SAK variants and a mock protein, human myomesin. Results are shown in Fig. 4 and S21. Variants SAK SY155 and SAK THR174 exhibited a significant reduction in reactivity with sera in comparison to both wild types SAK 42D (p<0.01) and SAK STAR (p<0.0001). Although variant SAK STAR FRIDA also exhibited reduced reactivity (PC score for SAK STAR FRIDA 1.022 versus 1.78 for SAK 42D or 3.80 for SAK STAR), it did not reach statistical significance.
Reactivity of human sera with individual SAK variants. A) Frozen-stored human sera from randomly selected 96 healthy subjects (age range: 50 - 86 years, average age: 64.16 years, F/M ratio: 33:63) providing informed consent were tested for reactivity with individual recombinant SAK variants coated on the ELISA plates. Analyses were performed with anti-human IgG γ-chain HRP-conjugated antibody in two independent replicates, and mean values of absorbances for each serum are presented in heat maps for each SAK. B) Individual absorbances are present in dots, and median ± quartiles are shown in black lines. Data were analysed for statistical significance using the Kruskal-Wallis test followed by Dunn's multiple comparisons test. *, **, **** denote p<0.05, 0.01, 0.0001, respectively. C) The first principal component of the human sera reactivity (mean values of absorbances) separates the immunogenic and low-immunogenic SAK variants, capturing 93.2% of the variance in the data distribution. The immunogenicity follows the order: SAK SY155 < SAK THR174 < SAK STAR FRIDA < SAK 42D < SAK STAR.
Analysis of dendritic cell activation
Flow cytometry analysis tested the potency of individual SAK variants to activate murine dendritic cells in vitro. The intensity of activation was compared with the negative control (medium plus phosphate buffer) group (labelled Ctrl), and the positive control (LPS) using several surface markers (MHCII, CD40, CD69, CD80, and CD86). No significant activation over the control group was detected for most of the tested SAK variants (SAK STAR WT, SAK STAR FRIDA, and SAK SY155) using dendritic cell activation markers (Fig. 5A). In the case of the SAK THR174 variant, a significant but biologically moderate increase in the number of CD40high cell population (58%) over the Ctrl group (52%) was detected (Fig. 5).
Analysis of bone marrow-derived dendritic cells activation mediated by different SAK variants. A) Activation of BMDCs mediated by different SAK was characterised by determining MHCIIhigh, CD40high, CD69high, CD80high and CD86high cell populations in CD11c+ MHCII+ cells. The MHCIIhigh cell population represented a subset of the broader MHCII+ population and exhibited fluorescence intensities above the MHCII+ threshold used, together with CD11c positivity, for antigen-presenting cell gating. B) Visualisation of high-dimensional data describing the potential of SAK variants to activate dendritic cells in vitro was performed using t-SNE (t-distributed stochastic neighbour embedding). LPS (150 ng/mL) as a positive control and PBS as a negative control (Ctrl) were used. Significance values were calculated vs CTRL by one-way ANOVA and Dunnett's post hoc test comparing individual SAK variant groups with Ctrl group,* p<0.05, *** p<0.001 and **** p<0.0001. SAK 42D WT was not evaluated in this panel.
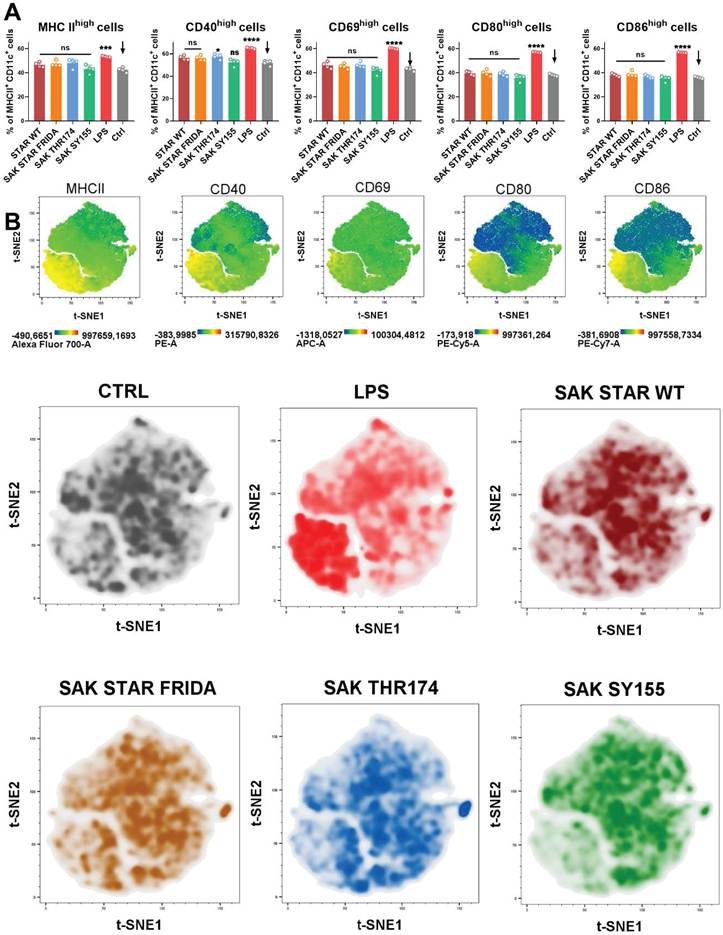
t-SNE visualisation shows the expression of particular markers by heatmap layouts, from where it is evident that the MHCIIhigh, CD40high, CD69high, CD80high and CD86high cell populations (yellow colour) are focused in the lower left quadrants of the heatmaps marked for each characterised marker (Fig. 5B). Analysed SAK variants together with LPS as positive control and PBS as negative control are expressed as density plots. Whereas most cells exposed to individual SAK variants are localised in the middle of the graph, similarly to the Ctrl group, LPS activation shifts the cells to the lower left part of the density graph. Our results show that generally all the SAK variants (SAK STAR WT, SAK STAR FRIDA, SAK THR174, and SAK SY155) show a similar pattern as the negative control compared to the LPS group (Fig. 5B). From these results, it could be summarised that none of the SAK variants can effectively activate murine BMDC cells in vitro, with the only exception of SAK THR174, where the results indicate a moderate potential to increase the population of activated CD40high BMDC.
Discussion
To accelerate the development of safer and more effective thrombolytics, it is essential to identify the most suitable starting scaffold [55]. We conducted a systematic comparative analysis of the functional and immunogenic properties of selected SAK wild types (SAK STAR and SAK 42D) and engineered low-immunogenic variants SAK SY155, SAK THR174, and SAK STAR FRIDA. The aim was to determine the variant with the most favourable molecular profile to serve as a template for the design of the next generation of thrombolytics.
Biochemical characterisation, including production yields, thermal stability, aggregation propensity, together with enzyme kinetics, yielded two main conclusions. First, SAK STAR WT significantly outperforms the SAK 42D WT template across all measured parameters, except affinity. Second, the engineered variants differ considerably in kinetic performance: SAK SY155 shows the highest catalytic efficiency and affinity towards plasmin, surpassing even the SAK STAR WT, whereas SAK THR174 performs slightly worse, and SAK STAR FRIDA is markedly weaker. In SPR measurements, the SAK 42D template showed higher binding affinity (≈ 39 nM) than the SAK STAR template (≈95 nM), despite its lower activity. SAK STAR FRIDA performed the worst (≈132 nM), while SAK SY155 was the strongest binder (≈6 nM), largely due to slow dissociation, outperforming the other low-immunogenic variant SAK THR174 (≈67 nM).
We believe that these kinetic observations are particularly notable given the absence of complementary structural insights into the interaction between SAK and full-length plasmin and plasminogen, as only the interaction with microplasmin has been studied so far [56] and our kinetic data could help bridge the gap.
In static thrombolysis assays, all SAK variants enhanced clot lysis compared with the control. SAK STAR WT, and especially SAK SY155 achieved efficacy comparable to rt-PA, consistent with their kinetic profiles. However, under flow conditions, the performance ranking changed: SAK SY155 showed the smallest effect, followed by SAK STAR FRIDA. These discrepancies likely reflect flow-dependent transport phenomena, including the balance between diffusion and convection and variant-specific fibrin-binding dynamics [57-60]. Diffusion experiments further supported this view, revealing that SAK SY155 penetrates fibrin gels more efficiently than other SAK variants and rt-PA, while SAK THR174 exhibits reduced penetration, mirroring its static assay performance. Possible limitations of these findings are the use of flow rates lower than those typically observed in vivo, which may reduce the pressure gradients across the clot. This adjustment was necessary to maintain clot stability while preserving susceptibility to enzymatic degradation. Although both static and flow-based in vitro models lack excretory mechanisms, this simplification allowed us to sustain a consistent local concentration of thrombolytic agents without continuous plasma supplementation. The concentrations of rt-PA and SAK variants were chosen to reflect therapeutically relevant levels, corresponding to clinical rt-PA dosing in ischemic stroke treatment [45].
Immunogenicity, a major barrier to address for clinical deployment of SAK [20,24,61,62], was assessed using several complementary approaches: (i) T-cell proliferation, (ii) human autoantigen cross-reactivity, (iii) ELISA detection of SAK-specific antibodies developed in immunised mice, (iv) inhibitory potency of SAK-specific antibodies developed in immunised mice, (v) reactivity of human sera with individual SAK variants, and (vi) murine dendritic-cell activation assays. None of the tested SAK variants activated T lymphocyte proliferation. Moreover, none of the variants induced human autoantigen-cross-reactive antibodies developed after immunisation of experimental mice, and non-adjuvanted SAK failed to elicit detectable antibody responses in mice. Only under strong inflammatory stimulation using aluminium adjuvant did all variants generate SAK-specific antibodies, consistent with their nature as foreign proteins. None of the tested SAK variants activated murine dendritic cells in vitro, suggesting a limited innate immune stimulatory potential. Finally, in the human serum reactivity test, we detected significant differences between the variants. The experiment showed that the low-immunogenic variants SAK THR174 and SAK SY155 exhibit lower reactivity with human sera than either wild type (SAK STAR WT or SAK 42D WT). The third studied low-immunogenic variant, SAK STAR FRIDA, exhibits lower reactivity as well, but this decrease is not statistically significant.
These experiments are in agreement with previously published differences in immunogenicity of these variants [26,29]. However, the differences are only observable when human sera are used, not in mice, especially in inbred pathogen-free mice, which do not fully reflect the reality in an HLA-variable human population exposed to SAK after potential prior contact with Staphylococcus sp. bacteria, a natural producer of SAK. Future studies evaluating immunogenicity under repeated-dosing conditions and using human cells and sera samples will be essential to fully determine the clinical safety profile of SAK variants.
Overall, our findings reveal clear variant-specific differences in catalytic behaviour, transport dynamics, thrombolytic efficacy, and immunogenicity. These insights highlight the wild type SAK STAR and low-immunogenic variant SAK SY155 as the most promising scaffolds for further engineering, while emphasising the importance of considering both biochemical properties and physiological flow conditions in the development of next-generation thrombolytic agents.
The differences between the two low-immunogenic variants (SAK THR174 and SAK SY155) motivated a follow-up study [63] that used NMR, X-ray crystallography, HDX-MS and molecular modelling to probe their structural basis.
A related but distinct case is the relative underperformance of the triple-alanine mutant (SAK STAR FRIDA), which was unexpected given that these mutations underlie the clinically studied Fortelyzin® variant. However, our construct differs from the Fortelyzin® variant [64] at several residues, most notably the 34-36-43 triplet (G-G-R in Fortelyzin®), that also distinguishes the 42D (G-R-R) and STAR templates (S-G-H), and includes stabilising additives that may affect performance. These construct differences preclude direct comparison with the Russian clinical data. A dedicated comparative study would be a valuable next step.
Conclusions
This study reconfirms that SAK is a potent thrombolytic agent with catalytic efficacy comparable to rt-PA. Importantly, this activity was maintained across all tested variants, even after introducing mutations designed to reduce immunogenicity. While the SAK STAR FRIDA and SAK THR174 variants showed small to moderate decreases in activity, the SAK SY155 variant displayed higher activity and affinity with plasmin than SAK STAR WT. Moreover, SAK SY155 showed significantly higher permeability than rt-PA, adding to its favourable profile. Although this did not yet translate into greater clot reduction under flow conditions, low-immunogenic SAK SY155 is the most promising candidate for further engineering. Our study also confirmed that low-immunogenic variants SAK THR174 and SAK SY155 significantly decrease reactivity with the human immune system.
Supplementary Material
Supplementary figures.

Acknowledgements
This project has received funding from the European Union's Horizon 2020 research and innovation programme under grant agreements No. 857560 (CETOCOEN), Horizon Europe Framework programme No. 101136607 (CLARA) and the EU from the Operational Programme Jan Amos Komenský (OP JAK) (project “Center for Artificial Intelligence and Quantum Computing in System Brain Research'', reg. no. CZ.02.01.01/00/23_029/0008437). ZP acknowledges the Czech-Swiss grant No. 25-15784L and DB the grant No. 25-18233M supported by the Czech Science Foundation (GACR) and project No. NW26A-NUVR supported by the Ministry of Health of the Czech Republic in cooperation with the Czech Health Research Council within the National Institute for Cancer Research. MP and JV were supported by the Ministry of Health of the Czech Republic in cooperation with the Czech Health Research Council under project No. NW24-08-00064. We also acknowledge the grant of the Ministry of Education, Youth, and Sport of the Czech Republic CZ.02.1.01/0.0/0.0/16_025/0007397, Palacky University grant IGA_LF_2026_013 and Ministry of Health, Czech Republic MHCZ-DRO, FNOL 00098892. Computational resources were provided by the e-INFRA CZ, ELIXIR-CZ, and RECETOX RI projects (Nos. 90254, LM2023055, and LM2023069), supported by the Ministry of Education, Youth and Sport of the Czech Republic. AS and JM received the Brno PhD Talent scholarship. CIISB, Instruct-CZ Centre of Instruct-ERIC EU consortium, funded by MEYS CR infrastructure project LM2023042 and European Regional Development Fund-Project “Innovation of Czech Infrastructure for Integrative Structural Biology“ (No. CZ.02.01.01/00/23_015/0008175), is gratefully acknowledged for the financial support of the measurements at the CF Biomolecular Interactions and Crystallography. Views and opinions expressed are however those of the author(s) only and do not necessarily reflect those of the European Union or REA. Neither the European Union nor the granting authority can be held responsible for any use that may be made of the information it contains.
Data availability
Raw data from activity, stability, SPR, static/flow models and penetration experiments, including scripts used for their evaluation were uploaded to the Zenodo repository and can be found using the DOI 10.5281/zenodo.22207084.
Author contributions
Alan Strunga - Laboratory work (protein production, endotoxin removal, and biochemical characterisation - activity, affinity, stability, inhibition assay), data evaluation and interpretation, conceptualisation, manuscript writing (all parts), preparation of the figures.
Michaela Peskova - Laboratory work (thrombolysis assays in vessel models, penetration experiments), data evaluation and interpretation, manuscript writing (methodology, results, discussion).
Michal Krupka - Laboratory work (endotoxin testing and removal, immunisation experiments on the mouse model, evaluation of the humoral immune response), data evaluation and interpretation, manuscript writing (methodology, results, discussion).
Katerina Zachova - Laboratory work (flow cytometry analysis), manuscript writing (methodology, results, discussion), preparation of figures.
Lenka Sindlerova - Laboratory work (immunology - MAT test, T cell proliferation), manuscript writing (methodology, results, discussion), data evaluation and interpretation, supervision.
Nikola Neumeisterova - Laboratory work (immunology - MAT test, T cell proliferation), manuscript writing (methodology, results, discussion).
Jan Mican - Manuscript revisions.
Jan Vitecek - Data interpretation (thrombolysis assays in vessel models, penetration experiments).
David Bednar - Manuscript revisions, supervision.
Stanislav Mazurenko - Data interpretation (PCA).
Lukas Kubala - Data interpretation (immunological characterisation), manuscript writing (methodology, results, discussion), manuscript revisions, supervision.
Milan Raska - Data interpretation (immunological characterisation), conceptualisation, manuscript revisions, supervision.
Jiri Damborsky - Data interpretation, conceptualisation, manuscript revisions, supervision.
Zbynek Prokop - Kinetic data analysis, data interpretation, conceptualisation, manuscript revisions, supervision.
Declaration of AI-assisted writing
AI was used for language editing and correction to improve the clarity, grammar, and readability of the manuscript. All scientific content, interpretations, and conclusions were developed and verified by the authors, who take full responsibility for the final content of the manuscript.
Competing Interests
The authors have declared that no competing interest exists.
References
1. [Internet] WHO. Global Health Estimates: Leading Causes of Death.
2. Prendes CF. et al. Burden of Stroke in Europe: An Analysis of the Global Burden of Disease Study Findings From 2010 to 2019. Stroke. 2024;55:432-442
3. Renedo D. et al. Burden of Ischemic and Hemorrhagic Stroke Across the US From 1990 to 2019. JAMA Neurol. 2024;81:394-404
4. Hacke W. et al. Thrombolysis with Alteplase 3 to 4.5 Hours after Acute Ischemic Stroke. N Engl J Med. 2008;359:1317-1329
5. Merlino G. et al. The use of alteplase, although safe, does not offer clear clinical advantages when mild stroke is non-disabling. Front Neurol. 2023;14:1212712
6. Parsons M. et al. A Randomized Trial of Tenecteplase versus Alteplase for Acute Ischemic Stroke. N Engl J Med. 2012;366:1099-1107
7. Wang Y. et al. Tenecteplase versus alteplase in acute ischaemic cerebrovascular events (TRACE-2): a phase 3, multicentre, open-label, randomised controlled, non-inferiority trial. Lancet. 2023;401:645-654
8. Wang L. et al. Comprehensive Review of Tenecteplase for Thrombolysis in Acute Ischemic Stroke. J Am Heart Assoc. 2024;13:e031692
9. Collen D, Lijnen H. Staphylokinase, a fibrin-specific plasminogen activator with therapeutic potential? Blood. 1994;84:680-686
10. Toul M. et al. Hidden Potential of Highly Efficient and Widely Accessible Thrombolytic Staphylokinase. Stroke. 2022;53:3235-3237
11. Chen H, Mo W, Su H, Zhang Y, Song H. Characterization of a novel bifunctional mutant of staphylokinase with platelet-targeted thrombolysis and antiplatelet aggregation activities. BMC Mol Biol. 2007;8:88
12. Lijnen HR, De Cock F, Van Hoef B, Schlott B, Collen D. Characterization of the Interaction Between Plasminogen and Staphylokinase. Eur J Biochem. 1994;224:143-149
13. Jespers L. et al. Structural and Functional Basis of Plasminogen Activation by Staphylokinase. Thromb Haemost. 1999;81:479-485
14. Gusev EI. et al. Non-immunogenic recombinant staphylokinase versus alteplase for patients with acute ischaemic stroke 4.5 h after symptom onset in Russia (FRIDA): a randomised, open label, multicentre, parallel-group, non-inferiority trial. Lancet Neurol. 2021;20:721-728
15. Leontyev SG. et al. The Safety of Non-immunogenic Recombinant Staphylokinase in Elderly Patients with Massive Pulmonary Embolism: A Randomized Clinical Trial FORPE. Health Sci Rep. 2025;8:e70826
16. Kirienko AI. et al. Non-immunogenic recombinant staphylokinase versus alteplase for patients with massive pulmonary embolism: a randomized open-label, multicenter, parallel-group, non-inferiority trial, FORPE. J Thromb Haemost. 2025;23:657-667
17. Vanderschueren S. et al. A Randomized Trial of Recombinant Staphylokinase Versus Alteplase for Coronary Artery Patency in Acute Myocardial Infarction. Circulation. 1995;92:2044-2049
18. Vanderschueren S. et al. Randomized coronary patency trial of double-bolus recombinant staphylokinase versus front-loaded alteplase in acute myocardial infarction. Am Heart J. 1997;134:213-219
19. Collen D, Vanderschueren S, Van De Werf F. Fibrin-Selective Thrombolytic Therapy With Recombinant Staphylokinase. Haemostasis. 1996;26(Suppl 4):294-300
20. Declerck PJ, Vanderschueren S, Billiet J, Moreau H, Collen D. Prevalence and Induction of Circulating Antibodies against Recombinant Staphylokinase. Thromb Haemost. 1994;71:129-133
21. Vanderschueren S, Van De Werf F, Collen D. Recombinant staphylokinase for thrombolytic therapy. Fibrinolysis Proteolysis. 1997;11:39-44
22. Vanderschueren S, Stassen JM, Collen D. Comparative Antigenicity of Recombinant Wild-Type Staphylokinase (SakSTAR) and a Selected Mutant (SakSTAR.M38) in a Baboon Thrombolysis Model. J Cardiovasc Pharmacol. 1996;27:809-815
23. Collen D. et al. Recombinant Staphylokinase Variants with Altered Immunoreactivity: I: Construction and Characterization. Circulation. 1996;94:197-206
24. Collen D, Moreau H, Stockx L, Vanderschueren S. Recombinant Staphylokinase Variants with Altered Immunoreactivity: II: Thrombolytic Properties and Antibody Induction. Circulation. 1996;94:207-216
25. Collen D. et al. Recombinant Staphylokinase Variants with Altered Immunoreactivity: III: Species Variability of Antibody Binding Patterns. Circulation. 1997;95:455-462
26. Collen D, Stockx L, Lacroix H, Suy R, Vanderschueren S. Recombinant Staphylokinase Variants with Altered Immunoreactivity: IV: Identification of Variants With Reduced Antibody Induction but Intact Potency. Circulation. 1997;95:463-472
27. Silence K. et al. Structure-Function Relationships in Staphylokinase as Revealed by 'Clustered Charge to Alanine' Mutagenesis. J Biol Chem. 1995;270:27192-27198
28. Jespers L, Jenné S, Lasters I, Collen D. Epitope mapping by negative selection of randomized antigen libraries displayed on filamentous phage. J Mol Biol. 1997;269:704-718
29. Laroche Y. et al. Recombinant staphylokinase variants with reduced antigenicity due to elimination of B-lymphocyte epitopes. Blood. 2000;96:1425-1432
30. Diwan D. et al. Thrombolytic Enzymes of Microbial Origin: A Review. Int J Mol Sci. 2021;22:10468
31. Kim SH, Chun HS, Han MH, Park NY, Suk K. A Novel Variant of Staphylokinase Gene from Staphylococcus aureus ATCC 29213. Thromb Res. 1997;87:387-395
32. Kaur P, Sethi D, Hade MD, Kaur J, Dikshit KL. C-terminal lysine residues enhance plasminogen activation by inducing conformational flexibility and stabilization of activator complex of staphylokinase with plasmin. Arch Biochem Biophys. 2023;743:109671
33. Rajamohan G, Dikshit KL. Role of the N-terminal region of staphylokinase (SAK): evidence for the participation of the N-terminal region of SAK in the enzyme-substrate complex formation. FEBS Lett. 2000;474:151-158
34. Schlott B, Gührs KH, Hartmann M, Röcker A, Collen D. Staphylokinase Requires NH2-terminal Proteolysis for Plasminogen Activation. J Biol Chem. 1997;272:6067-6072
35. Kaur P, Singh S, Kaur J, Dikshit KL. Dispensability of a positively charged residue at Lys11 in staphylokinase for plasminogen activation. Int J Biol Macromol. 2025;308:142305
36. Schlott B, Gührs KH, Hartmann M, Röcker A, Collen D. NH2-terminal Structural Motifs in Staphylokinase Required for Plasminogen Activation. J Biol Chem. 1998;273:22346-22350
37. Aida Y, Pabst MJ. Removal of endotoxin from protein solutions by phase separation using Triton X-114. J Immunol Methods. 1990;132:191-195
38. Liu S. et al. Removal of Endotoxin from Recombinant Protein Preparations. Clin Biochem. 1997;30:455-463
39. Nikitin D. et al. Computer-aided engineering of staphylokinase toward enhanced affinity and selectivity for plasmin. Comput Struct Biotechnol J. 2022;20:1366-1377
40. Goldenberg NA, Hathaway WE, Jacobson L, Manco-Johnson MJ. A new global assay of coagulation and fibrinolysis. Thromb Res. 2005;116:345-356
41. Longstaff C. Development of Shiny app tools to simplify and standardize the analysis of hemostasis assay data: communication from the SSC of the ISTH. J Thromb Haemost. 2017;15:1044-1046
42. Johnson KA, Simpson ZB, Blom T. Global Kinetic Explorer: A new computer program for dynamic simulation and fitting of kinetic data. Anal Biochem. 2009;387:20-29
43. Johnson KA, Simpson ZB, Blom T. FitSpace Explorer: An algorithm to evaluate multidimensional parameter space in fitting kinetic data. Anal Biochem. 2009;387:30-41
44. Lagerberg JW, Korsten H, van der Meer PF, de Korte D. Prevention of red cell storage lesion: a comparison of five different additive solutions. Blood Transfus. 2017;15:456-462
45. Acheampong P, Ford GA. Pharmacokinetics of alteplase in the treatment of ischaemic stroke. Expert Opin Drug Metab Toxicol. 2012;8:271-281
46. Vitecek J. et al. Factors influencing the efficacy of recombinant tissue plasminogen activator: Implications for ischemic stroke treatment. PLoS One. 2024;19:e0302269
47. Thalerova S. et al. Effect of Apixaban Pretreatment on Alteplase-Induced Thrombolysis: An In Vitro Study. Front Pharmacol. 2021;12:740930
48. Thalerova S. et al. A collateral circulation in ischemic stroke accelerates recanalization due to lower clot compaction. PLoS One. 2024;19:e0314079
49. Jadhav NH, Kashid DN. Robust Winsorized Shrinkage Estimators for Linear Regression Model. J Mod Appl Stat Methods. 2014;13:131-150
50. Blaine BE. Winsorizing. In: Frey BB, ed. The SAGE Encyclopedia of Educational Research, Measurement, and Evaluation. Thousand Oaks, USA: SAGE Publications. 2018 doi:10.4135/9781506326139.n747
51. EDQM. Monocyte Activation Test. In: European Pharmacopoeia. Strasbourg, France: European Pharmacopoeia. 2016
52. Krupka M. et al. The Position of His-Tag in Recombinant OspC and Application of Various Adjuvants Affects the Intensity and Quality of Specific Antibody Response after Immunization of Experimental Mice. PLoS One. 2016;11:e0148497
53. Raska M. et al. Delivery of DNA HIV-1 vaccine to the liver induces high and long-lasting humoral immune responses. Vaccine. 2008;26:1541-1551
54. Sloupenska K. et al. Antigenicity and immunogenicity of different morphological forms of Borrelia burgdorferi sensu lato spirochetes. Sci Rep. 2024;14:4014
55. Mican J, Toul M, Bednar D, Damborsky J. Structural Biology and Protein Engineering of Thrombolytics. Comput Struct Biotechnol J. 2019;17:917-938
56. Parry MAA. et al. The ternary microplasmin-staphylokinase-microplasmin complex is a proteinase-cofactor-substrate complex in action. Nat Struct Biol. 1998;5:917-923
57. Diamond SL, Anand S. Inner clot diffusion and permeation during fibrinolysis. Biophys J. 1993;65:2622-2643
58. Wu TP, Padmanabhan KP, Tulinsky A. The structure of recombinant plasminogen kringle 1 and the fibrin binding site. Blood Coagul Fibrinolysis. 1994;5:157-166
59. Bannish BE, Chernysh IN, Keener JP, Fogelson AL, Weisel JW. Molecular and Physical Mechanisms of Fibrinolysis and Thrombolysis from Mathematical Modeling and Experiments. Sci Rep. 2017;7:6914
60. Zeng Z, Christodoulides A, Alves NJ. Real-time tracking of fibrinolysis under constant wall shear and various pulsatile flows in an in-vitro thrombolysis model. Bioeng Transl Med. 2023;8:e10511
61. He J. et al. Simultaneous elimination of T- and B-cell epitope by structure-based mutagenesis of single Glu80 residue within recombinant staphylokinase. Acta Biochim Biophys Sin. 2010;42:209-215
62. Wang M. et al. Construction of a novel Staphylokinase (SAK) mutant with low immunogenicity and its evaluation in rhesus monkey. Int J Biol Macromol. 2020;146:781-789
63. Legrand AP. et al. Investigating the Conformational Flexibility of Staphylokinase Across Multiple Time Scales. 2026; preprint. doi:10.64898/2026.02.03.703606.
64. Vilkin YF, Markin SS, Semenov AM. Recombinant plasmid DNA containing the sequence of mature Staphylococcus aureus staphylokinase with codons K74, E75 and R77 replaced by Ala-coding triplets, Escherichia coli strain MZ09, and a method for obtaining the recombinant protein. Russian Federation patent application 2010111449/15, filed 26 March 2010; decision to grant 16 December. 2010
Author contact
Corresponding authors: Jiri Damborsky (Email: jirimuni.cz) and Zbynek Prokop (Email: zbynekmuni.cz)